

Exploring the relationship between air pollution, non-alcoholic fatty liver disease, and liver function indicators: a two-sample Mendelian randomization analysis study
- PMID: 39678198
- PMCID: PMC11637881
- DOI: 10.3389/fendo.2024.1396032
Exploring the relationship between air pollution, non-alcoholic fatty liver disease, and liver function indicators: a two-sample Mendelian randomization analysis study
Abstract
Background and aims: Non-alcoholic fatty liver disease (NAFLD) is a common metabolic disorder worldwide, with an increasing incidence in recent years. While previous studies have suggested an association between the air pollutant PM2.5 and NAFLD, there is still considerable debate regarding the existence of a clear causal relationship between air pollution and NAFLD. This study aims to employ Mendelian randomization methods to evaluate the causal relationship between major air pollutants and NAFLD.
Method: We conducted Mendelian randomization analyses on a large-scale publicly available genome-wide association study (GWAS) dataset of European populations to dissect the association between air pollutants, NAFLD, and liver function indicators. We used five different analysis methods, including Inverse-variance weighted (IVW), Weighted median, MR-Egger, Simple mode, and Weighted mode, to analyze the data. We also tested for pleiotropy, heterogeneity, and sensitivity of the results.
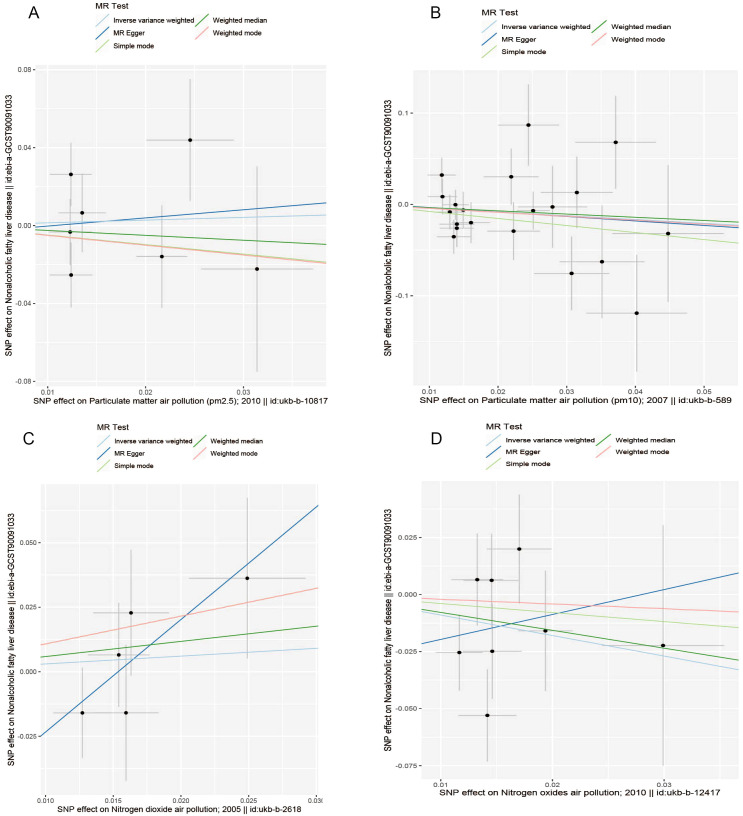
Results: This study utilized four common exposures related to air pollution and four outcomes related to NAFLD. The results regarding the association between air pollutants and NAFLD (PM2.5: P=0.808, 95% CI=0.37-3.56; PM10: P=0.238, 95% CI=0.33-1.31; nitrogen dioxide: P=0.629, 95% CI=0.40-4.61; nitrogen oxides: P=0.123, 95% CI=0.13-1.28) indicated no statistically significant correlation between them. However, notably, there was a causal relationship between PM10 and serum albumin (ALB) levels (P=0.019, 95% CI=1.02-1.27).
Conclusion: This MR study found no evidence of a causal relationship between air pollution and NAFLD in European populations. However, a statistically significant association was observed between PM10 and ALB levels, suggesting that the air pollutant PM10 may impact the liver's ability to synthesize proteins.
Keywords: Mendelian randomization study; PM2.5; air pollution; causal relationship; liver function indicators; non-alcoholic fatty liver disease.
Copyright © 2024 Song, Pan, Pan, Zheng, Fan, Zhen, Pi, Liang, Shen, Li, Yang and Zhang.
Conflict of interest statement
The authors declare that the research was conducted in the absence of any commercial or financial relationships that could be construed as a potential conflict of interest.
Figures


References
MeSH terms
Substances
LinkOut - more resources
Full Text Sources
Medical
Miscellaneous