. 2024 Oct 12;7(4):335-350.
doi: 10.1093/abt/tbae028. eCollection 2024 Oct.

Leveraging high-throughput analytics and automation to rapidly develop high-concentration mAb formulations: integrated excipient compatibility and viscosity screening

Affiliations

Leveraging high-throughput analytics and automation to rapidly develop high-concentration mAb formulations: integrated excipient compatibility and viscosity screening

Lun Xin et al. Antib Ther. .

Abstract

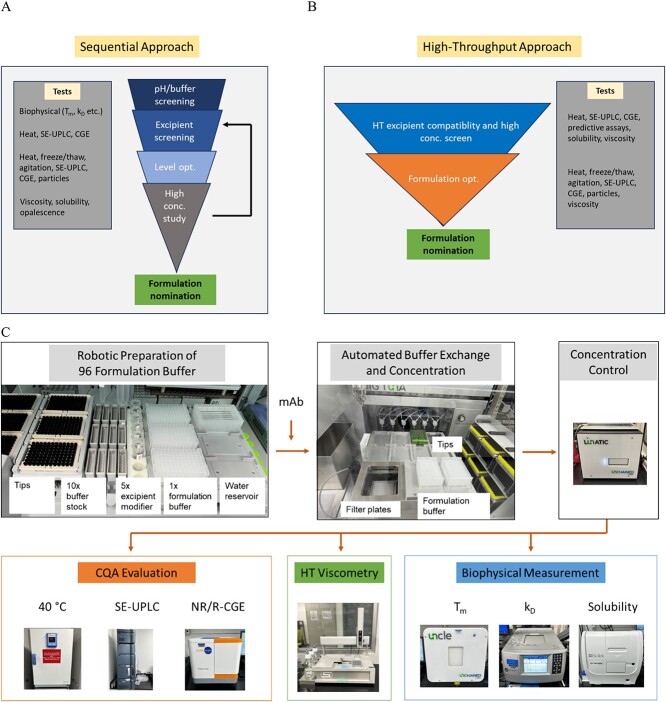
Background: Formulation screening is essential to experimentally balance stability and viscosity in high-concentration mAb formulations. We developed a high-throughput approach with automated sample preparation and analytical workflows to enable the integrated assessment of excipient compatibility and viscosity of mAb formulations.

Methods: Ninety-six formulations of a trastuzumab biosimilar were screened by combining 8 types of excipient modifiers with 4 types of buffers across a pH range of 4.5 to 7.5. Key stability risks, including high molecular weight (HMW) aggregation and fragmentation, were thoroughly assessed along with viscosity at high concentrations. Additionally, several biophysical parameters were evaluated for their ability to predict stability or viscosity outcomes. Multiple linear regression was applied to fit the data and identify key factors.

Results: The optimal pH range for the trastuzumab biosimilar was found to be 5.0 to 6.5, based on opposing pH dependencies for stability and viscosity. Buffer type had a minor effect on viscosity and fragmentation but played a significant role in influencing HMW aggregates, with Na-acetate and histidine-HCl being the best candidates. The impact of excipient modifiers on viscosity, HMW, and fragmentation depended on both pH and buffer type, showing strong interactions among factors. Arginine-HCl and lysine-HCl effectively lowered viscosity of the trastuzumab biosimilar at pH levels above 6.0, while glycine formulations were more effective at reducing viscosity below pH 6.0. Histidine-HCl, arginine-HCl, and lysine-HCl lowered the risk of HMW aggregation, whereas formulations containing Na-phosphate or NaCl showed higher HMW aggregation. Formulations with arginine-HCl, lysine-HCl, and NaCl demonstrated a rapid increase in fragmentation at pH levels below 5.0, while Na-aspartate formulations showed increased fragmentation at pH levels above 6.5.

Conclusion: Hence, it is important to optimize the levels of each chosen excipient in the formulation study to balance their benefits against potential incompatibilities. This study serves as a foundation for identifying high-concentration antibody formulations using a high-throughput approach, where minimal materials are required, and optimized formulation design spaces can be quickly identified.

Keywords: automated buffer exchange and ultrafiltration; colloidal interaction; excipient compatibility; high-concentration antibody formulation; melting temperature; multiple linear regression; stability; viscosity.


Conflict of interest statement

The authors would like to disclose that funding for the study is provided by Catalent Pharma Solutions. At the time of study, all authors were employees of Catalent Pharma Solutions and may hold Catalent’s stock. Yunsong Li is a guest editor of Antibody Therapeutics and was blinded from reviewing or making decisions for this manuscript.

Figures

Figure 1
Figure 1
Typical workflow for mAb formulation development. A) Sequential approach that is traditionally used in the industry. B) High-throughput approach that can reduce time and allow the study of interactions among formulation parameters. C) Implemented automation workflow for high-throughput formulation screening (see methods for details).
Figure 2
Figure 2
Impact of formulation conditions on the melting temperature (Tm) of trastuzumab biosimilar. Data are shown as experimental values (solid symbols) overlaid with fitted lines to guide data reading. Each formulation consists of a 20 mM buffer at the target pH and an excipient modifier (see methods for details on formulation conditions). Control formulation with only buffer and no excipient modifier is labeled as No modifier. Formulations consisting of the same buffer are labeled using the same color (blue: Na-acetate; red: Na-succinate; green: Histidine-HCl; purple: Na-phosphate).
Figure 3
Figure 3
Impact of formulation conditions on diffusion interaction parameter (kD) of trastuzumab biosimilar. Data are shown as experimental values (solid symbols) overlaid with fitted lines to guide data reading. Each formulation consists of a 20 mM buffer at the target pH and an excipient modifier (see methods for details on formulation conditions). Control formulation with only buffer and no excipient modifier is labeled as No modifier. Formulations consisting of the same buffer are labeled using the same color (blue: Na-acetate; red: Na-succinate; green: Histidine-HCl; purple: Na-phosphate).
Figure 4
Figure 4
Correlation matrix for the diffusion interaction parameter (kD), relative solubility, buffer exchange in process measurements, and viscosity of trastuzumab biosimilar in different formulation conditions. Density ellipse with an alpha value of 0.95 was shown to guide the reading on the distribution of data. Formulations consisting of the same buffer are labeled using the same color in the correlation (blue: Na-acetate; red: Na-succinate; green: Histidine-HCl; purple: Na-phosphate). Heatmap shows the level of correlation between variables with their Pearson correlation coefficients shown inside.
Figure 5
Figure 5
Impact of formulation conditions on the viscosity of the trastuzumab biosimilar at 125 mg/mL. Data are shown as experimental values (solid symbols) overlaid with fitted lines to guide data reading. Each formulation consists of a 20 mM buffer at the target pH and an excipient modifier (see methods for details on formulation conditions). Control formulation with only buffer and no excipient modifier is labeled as No modifier. Formulations consisting of the same buffer are labeled using the same color (blue: Na-acetate; red: Na-succinate; green: Histidine-HCl; purple: Na-phosphate).
Figure 6
Figure 6
Correlation matrix for the melting temperature (Tm), diffusion interaction parameter (kD), net increase in HMW as measured by SE-UPLC (D_HMW), net increase in HMW as measured by NR-CGE (D_NR_HMW), and net increase in HMW as measured by R-CGE (D_R_HMW) of the trastuzumab biosimilar in different formulation conditions. For HMW measurement, 5 mg/mL trastuzumab biosimilar formulations were stressed at 40 °C for 2 weeks and subsequently subjected to analytical testing to determine the relative change in HMW value. Density ellipse with an alpha value of 0.95 was shown to guide the reading on the distribution of data. Formulations consisting of the same buffer are labeled using the same color in the correlation (blue: Na-acetate; red: Na-succinate; green: Histidine-HCl; purple: Na-phosphate). Heatmap shows the level of correlation between variables with their Pearson correlation coefficients shown inside.
Figure 7
Figure 7
Impact of formulation conditions on the HMW aggregation of trastuzumab biosimilar. Trastuzumab biosimilar formulations at 5 mg/mL were stressed at 40 °C for 2 weeks and subsequently subjected to SE-UPLC to determine the net increase in HMW value. Data are shown as experimental values (solid symbols) overlaid with fitted lines to guide data reading. Each formulation consists of a 20 mM buffer at the target pH and an excipient modifier (see methods for details on formulation conditions). Control formulation with only buffer and no excipient modifier is labeled as No modifier. Formulations consisting of the same buffer are labeled using the same color (blue: Na-acetate; red: Na-succinate; green: Histidine-HCl; purple: Na-phosphate).
Figure 8
Figure 8
Correlation matrix for the melting temperature (Tm), net increase in LMW as measured by SE-UPLC (D_LMW), net increase in fragmentation as measured by NR-CGE (D_NR_Frag), and net increase in fragmentation as measured by R-CGE (D_R_Frag) of trastuzumab biosimilar in different formulation conditions. For fragmentation measurement, trastuzumab biosimilar formulations at 5 mg/mL were stressed at 40 °C for 2 weeks and subsequently subjected to analytical testing to determine the relative change in fragmentation value. Density ellipse with an alpha value of 0.95 was shown to guide the reading on the distribution of data. Formulations consisting of the same buffer are labeled using the same color in the correlation (blue: Na-acetate; red: Na-succinate; green: Histidine-HCl; purple: Na-phosphate). Heatmap indicates the level of correlation between variables with their Pearson correlation coefficients shown inside.
Figure 9
Figure 9
Impact of formulation conditions on the fragmentation of trastuzumab biosimilar. Trastuzumab formulations at 5 mg/mL were stressed at 40 °C for 2 weeks and subsequently subjected to analytical tests to determine the net increase in fragmentation value (panel a: Net increase in fragmentation as determined by SE-UPLC (D_LMW); panel B: Net increase in fragmentation as determined by NR-CGE (D_NR_Frag). Data are shown as experimental values (solid symbols) overlaid with fitted lines to guide data reading. Each formulation consists of a 20 mM buffer at the target pH and an excipient modifier (see methods for details on formulation conditions). Control formulation with only buffer and no excipient modifier is labeled as No modifier. Formulations consisting of the same buffer are labeled using the same color (blue: Na-acetate; red: Na-succinate; green: Histidine-HCl; purple: Na-phosphate).

References

    1. Viola M, Sequeira J, Seiça R. et al. . Subcutaneous delivery of monoclonal antibodies: how do we get there? J Control Release . 2018;286:301–14. 10.1016/j.jconrel.2018.08.001. - DOI - PubMed
    1. Jiskoot W, Hawe A, Menzen T. et al. . Ongoing challenges to develop high concentration monoclonal antibody-based formulations for subcutaneous administration: quo Vadis? J Pharm Sci . 2022;111:861–7. 10.1016/j.xphs.2021.11.008. - DOI - PubMed
    1. Collins DS, Sánchez-Félix M, Badkar AV. et al. . Accelerating the development of novel technologies and tools for the subcutaneous delivery of biotherapeutics. J Control Release. 2020;321:475–82. 10.1016/j.jconrel.2020.02.036. - DOI - PubMed
    1. Mathaes R, Koulov A, Joerg S. et al. . Subcutaneous injection volume of biopharmaceuticals-pushing the boundaries. J Pharm Sci. 2016;105:2255–9. 10.1016/j.xphs.2016.05.029. - DOI - PubMed
    1. Whitaker N, Xiong J, Pace SE. et al. . A formulation development approach to identify and select stable ultra-high-concentration monoclonal antibody formulations with reduced viscosities. J Pharm Sci. 2017;106:3230–41. 10.1016/j.xphs.2017.06.017. - DOI - PubMed

LinkOut - more resources