[Preprint]. 2024 Dec 5:rs.3.rs-5448262.
doi: 10.21203/rs.3.rs-5448262/v1.

Myosin-dependent short actin filaments contribute to peripheral widening in developing stereocilia

Affiliations

Myosin-dependent short actin filaments contribute to peripheral widening in developing stereocilia

Xiayi Liao et al. Res Sq. .

Update in

Abstract

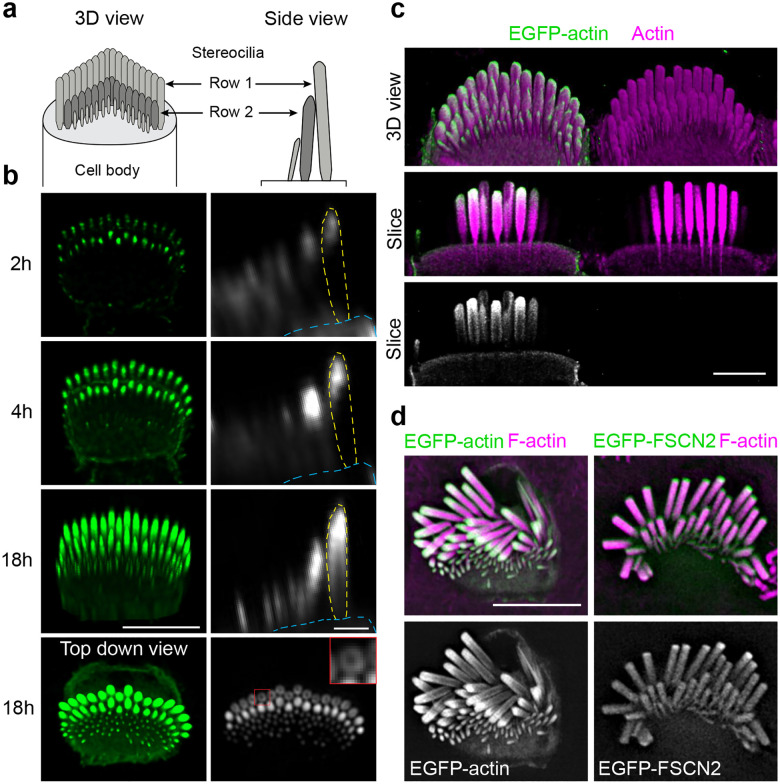
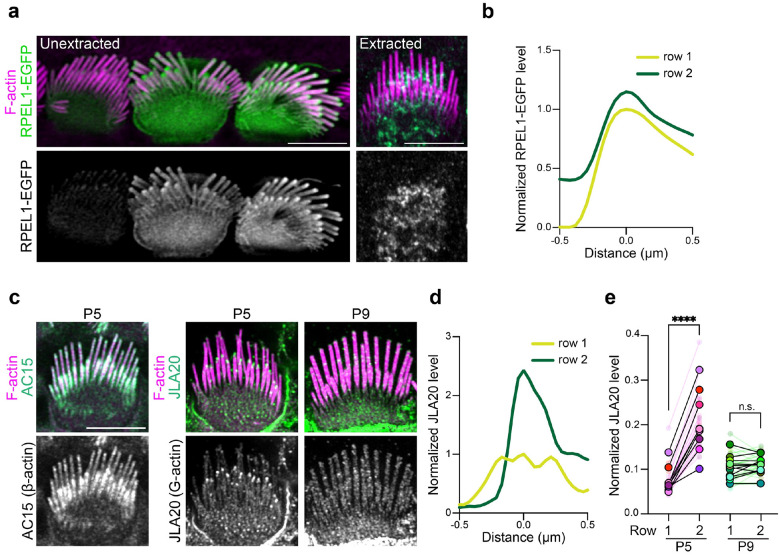
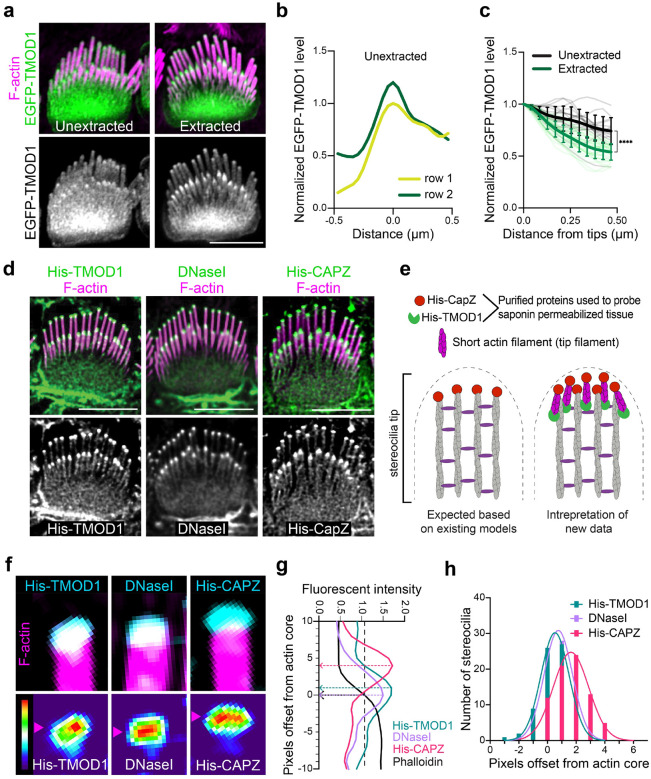
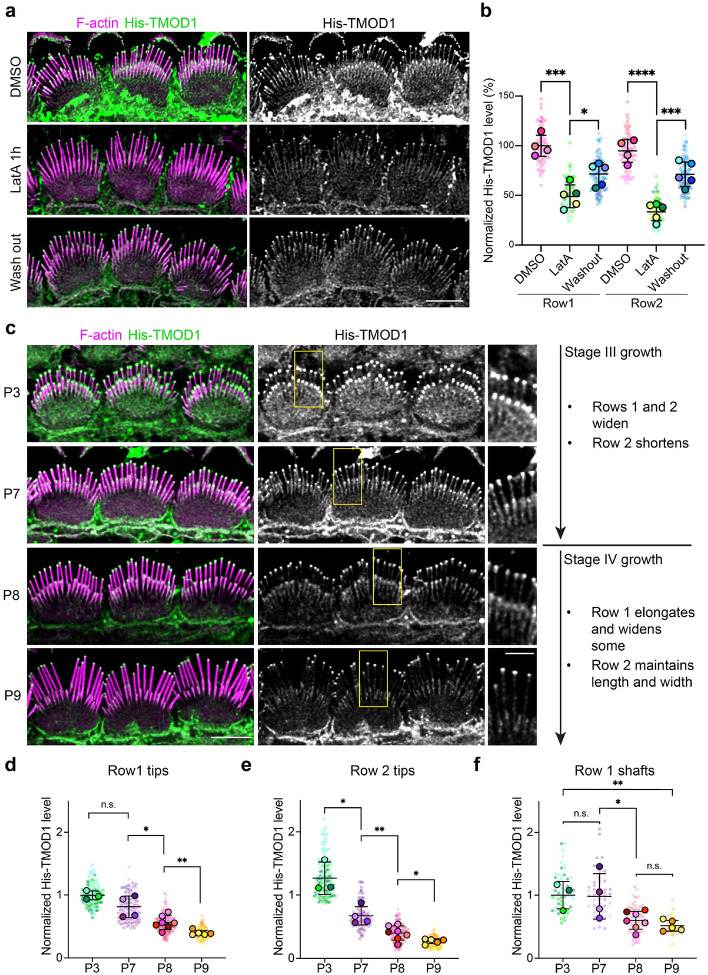
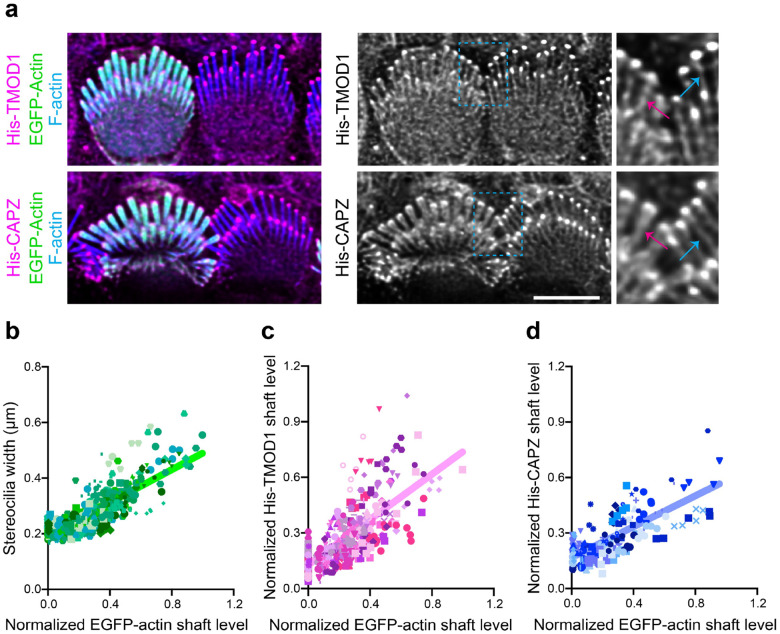
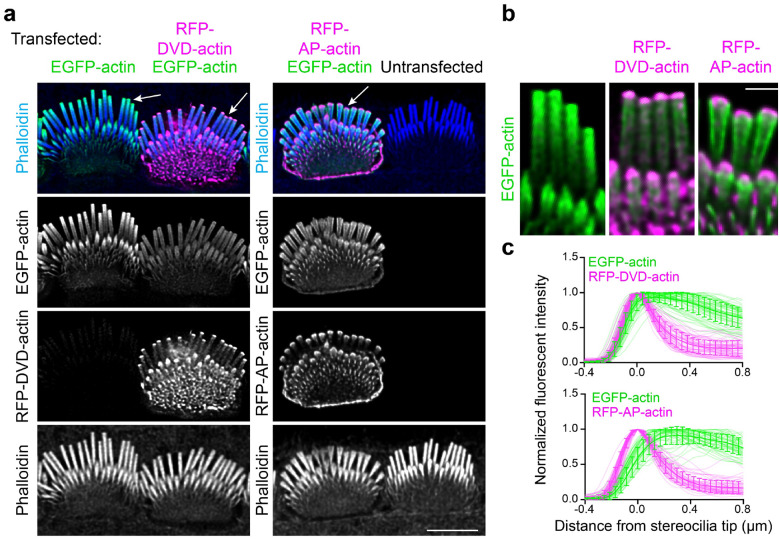
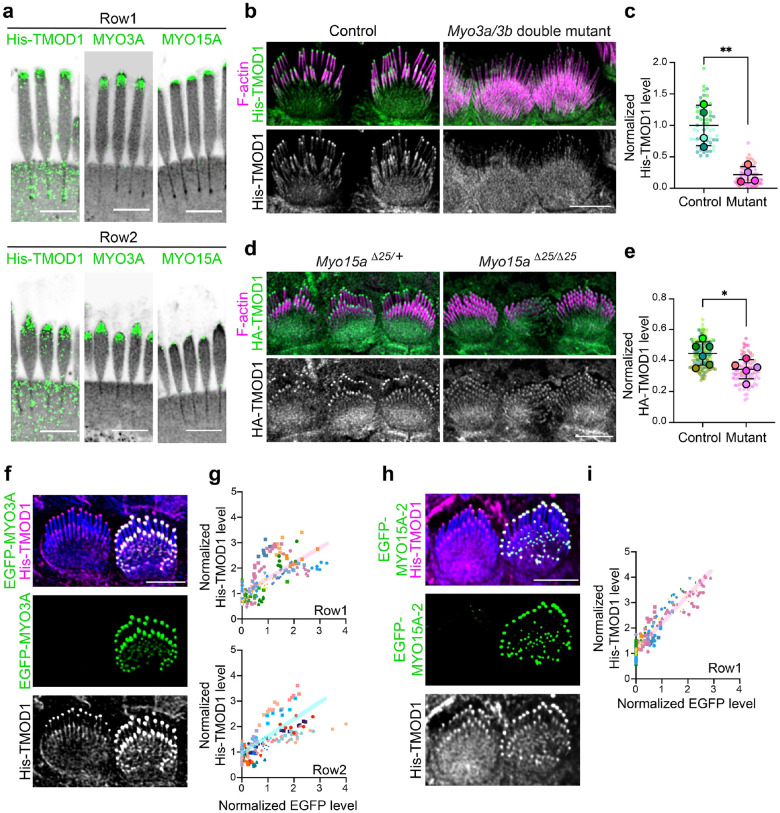
In the auditory and vestibular systems, stereocilia are actin-based protrusions that convert mechanical stimuli into electrical signals. During development, stereocilia elongate and widen by adding filamentous actin (F-actin), attaining their mature shape necessary for mechanosensitive function. Myosin motors, including MYO3A/B and MYO15A, are required for normal stereocilia growth, but the regulation of actin and the impact of myosins on actin assembly remain unclear. We focused on stereocilia widening, which requires the addition of new filaments to the bundle of linear F-actin comprising the initial stereocilia core. Our findings revealed that newly expressed actin incorporates at the stereocilia tip first, then along the shaft to promote stereocilia widening. The newly incorporated F-actin surrounded the existing F-actin core, suggesting that the core is stable once formed, with additional actin adding only to the periphery. To better understand the nature of incorporating actin, we used several probes to detect globular (G-) actin, F-actin barbed ends, and F-actin pointed ends. While F-actin core filaments are parallel and thought to present only barbed ends at stereocilia tips, we also detected F-actin pointed ends, indicating a previously undetected population of short actin filaments. Overexpression of actin resulted in abundant F-actin pointed and barbed ends along the periphery of the stereocilia shaft, suggesting that short actin filaments contribute to stereocilia widening. Short actin filament levels correlated with the levels of MYO3A/B and MYO15A at stereocilia tips, suggesting these myosins generate or stabilize short actin filaments essential for stereocilia widening and elongation.


Conflict of interest statement

Additional Declarations: There is NO Competing Interest.

Figures

Fig. 1:
Fig. 1:. EGFP-actin incorporation pattern during stereocilia widening.
a, Diagrams of inner hair cell (IHC) stereocilia, oriented en face in a 3D view and as a side view. b, A single P6 IHC imaged at timepoints (from 2 to 18 h) after transfection with EGFP-actin. Left panels are 3D reconstructions oriented en face except for the final image, which is a top-down view (scale bar represents 5 μm). Right panels are side views of stereocilia made from x-z reslices (scale bar represents 1 μm). The outline of a row 1 stereocilium is traced by yellow dashed lines and the cuticular plate is denoted by blue dashed lines. The lowest panel is an x-y slice showing stereocilia in cross-section mid-way down row 1 stereocilia. The inset (1 × 1 μm), a magnified region marked by a red box, demonstrates peripheral EGFP-actin localization around row 1 stereocilia. c, EGFP-actin transfected IHC (P5) imaged by expansion microscopy, stained with antibodies against γ-actin (ACTG1) (magenta) and EGFP (green). The top panel is a 3D reconstruction and lower panels are x-y slices through the center of stereocilia. Scale bar represents 10 μm. d, Lattice SIM images of EGFP-actin or EGFP-FSCN2 (green and grey) from transfected IHC (P5) stereocilia with phalloidin-stained F-actin (magenta). Scale bar represents 5 μm.
Fig. 2:
Fig. 2:. G-actin is enriched at stereocilia tips.
a, RPEL1-EGFP transfected IHCs unextracted or extracted by saponin before fixation. F-actin was stained with phalloidin (magenta). b, Representative line scans drawn down the center of stereocilia in RPEL1-EGFP transfected, unextracted IHCs at P5. In (b) and (d), line scans were drawn from tip towards the base down the center of stereocilia, the peak fluorescent signal was set as 0 on the x-axis, and the fluorescent intensity was normalized to the row 1 maximum. c, Images of IHCs from saponin-permeabilized P5 or P9 mouse organ of Corti that was probed before fixation with antibodies against β-actin (AC15) or G-actin (JLA20) (green and grey); F-actin was counterstained post-fixation with phalloidin (magenta). d, Representative line scans of JLA20 stained P5 IHC stereocilia. e, Quantification of JLA20 level at stereocilia tips normalized to the average intensity of cell junctions. Smaller circles represent the average value of stereocilia tips from individual cells. Larger open circles represent the average value of cells from one individual cochlea (N). P values from two-tailed paired t tests based on N are indicated (n.s., not significant; ****, P < 0.0001). Results are collected from 9–11 cochleae and from at least 2 independent experiments. Scale bar represents 5 μm.
Fig. 3:
Fig. 3:. F-actin barbed ends and F-actin pointed ends are present at stereocilia tips.
a, EGFP-TMOD1 transfected P5 IHCs, either unextracted or extracted by saponin before fixation, that were also stained with phalloidin for F-actin (magenta). b, Representative line scans drawn down the center of stereocilia of EGFP-TMOD1 transfected, unextracted P5 IHCs. The peak EGFP level was set as 0 on x axis and the fluorescence intensity was normalized to the maximal fluorescence intensity of row 1. c, Line scans quantifying EGFP-TMOD1 levels from stereocilia tips toward shafts in saponin-extracted or unextracted P5 IHCs. The shadow lines represent individual stereocilia (n); the thick solid lines are the average level of all stereocilia. The line scan results were collected from 0 to 0.5 μm (below tips) on x axis described in (b). Results were collected from 2–3 cochleae. The data were plotted as mean ± SD and analyzed by two-way ANOVA (****, P < 0.0001 for the effects of extraction, distance from stereocilia tips, and interactions between these parameters, based on n). d, His-TMOD1, DNaseI, or His-CAPZ (green, gray) localization after probing permeabilized IHCs at P5–6. F-actin was stained with phalloidin (magenta). e, Diagrams of potential actin structures in stereocilia with F-actin barbed and pointed ends bound by His-CAPZ and His-TMOD1, respectively. f, Lattice SIM images of His-TMOD1, DNaseI, and His-CAPZ (cyan, thermal lookup table) at row 1 stereocilia tips with phalloidin-stained F-actin (magenta), which were quantified in (g-h). Magenta arrowheads denote the position of peak fluorescence intensity. g, Representative line scans drawn down the center of stereocilia showing the intensity of His-TMOD1 (blue), DNaseI (purple), His-CAPZ (red), and F-actin actin (black). The stereocilia tip was defined as being the point where phalloidin intensity reached the average value in the tip region (indicated by the black dashed arrow). Peak intensities for His-TMOD1, DNaseI, and His-CAPZ are indicated by colored dashed arrows. The offset of the probe centers from the stereocilia tips (− is below tips; + is above tips) were determined and plotted in (h). h, A frequency histogram showing the pixel offsets of His-TMOD1 (blue), DNaseI (purple), and His-CAPZ (red) from the stereocilia tip. The histogram of each probe is fitted with a Gaussian curve. Mean offsets for peak of the Gaussian curves based on the pixel size (31 nm × 31nm): His-TMOD1, 16 nm; DNaseI, 24 nm; His-CAPZ, 51 nm. R-squared value of the fit: His-TMOD1, 0.996; DNaseI, 0.976; His-CAPZ, 0.984. All scale bars represent 5 μm.
Fig. 4:
Fig. 4:. Tip filament levels during development of apical IHCs.
a, His-TMOD1 staining (green, grey) of P5 IHCs after latrunculin A (LatA) treatment and following washout; F-actin stained with phalloidin (magenta). b, Quantification of His-TMOD1 level from row 1 and row 2 stereocilia tips. The fluorescence intensity was normalized to the average fluorescence intensity of row 1 stereocilia from DMSO-treated samples. Five cochleae were averaged and plotted ± SD (large open circles); His-TMOD1 mean intensity from tips of individual stereocilia were plotted as small dots with the color corresponding to their cochlea. P values from two-tailed unpaired t tests comparing cochlea averages are indicated (*, P < 0.05; ***, P < 0.001; ****, P < 0.0001). Scale bar represents 5 μm. c, Left panels are His-TMOD1 labeling (green, grey) of IHCs at P3, 7, 8, and 9. F-actin in stereocilia was stained with phalloidin (magenta). Scale bar represents 5 μm. Regions marked by yellow boxes are magnified to the side (Scale bar represents 2 μm). The timeline on the right is of IHC bundle development in mouse cochlea showing the growth details of specific rows during Stage III and IV based on. d-e, Quantification of His-TMOD1 level from stereocilia tips at P3, 7, 8, and 9. Row 1 and 2 are separately plotted. f, Quantification of His-TMOD1 level from row 1 stereocilia shafts at P3, 7, 8, and 9. Fluorescence quantifications from (d-f) were normalized to the average fluorescence intensity of the row 1 level from P3 samples to allow comparison between multiple experiments. P values for two-tailed unpaired t tests are indicated (*, P < 0.05; **, P < 0.01) based on cochleae. Smaller circles represent stereocilia; larger open circles represent cochleae. Results from 3–7 cochleae were averaged and plotted ± SD. The data were collected from at least 2 independent experiments.
Fig. 5:
Fig. 5:. Stereocilia widening correlates with increased F-actin barbed and pointed levels in the shaft.
a, His-TMOD1 or His-CAPZ (magenta, gray) labeling in permeabilized IHCs transfected by EGFP-actin (green). F-actin is stained with phalloidin (blue) to show stereocilia. Regions of interest are denoted by light blue dashed boxes and magnified to the right. For comparison, stereocilia shaft labeling of His-TMOD1 or His-CAPZ is indicated by blue arrows in untransfected cells and magenta arrows in EGFP-actin transfected cells. Images were acquired by conventional confocal microscopy and processed by deconvolution. b-d, Graphs showing the linear correlation of the EGFP-actin level in the stereocilia shaft with stereocilia width (b), His-TMOD1 shaft staining (c), and His-CAPZ shaft staining (d). Stereocilia are plotted as individual symbols and those from the same cell are represented by identical color and shape. Simple linear regression analysis was applied to the data. R-squared values for linear regressions from (b-d) are 0.66, 0.52, 0.55, respectively. 9–13 cochleae from at least 2 independent experiments were collected for analysis. Scale bar represents 5 μm.
Fig. 6:
Fig. 6:. Polymerization-incompetent mutant actin disrupts the incorporation of wild-type actin at stereocilia tips.
a, IHCs transfected with EGFP-actin (green) and mutant actins (magenta). Left panels: IHCs transfected with EGFP-actin alone or in combination with RFP-DVD-actin; Right panels: IHC transfected with EGFP-actin and RFP-AP-actin, adjacent to an untransfected IHC. White arrows indicate the selected region magnified in (b). Scale bar represents 5 μm. b, Magnified insets from left to right: expression of EGFP-actin only, co-expression of EGFP-actin with RFP-DVD-actin or RFP-AP-actin. Scale bar represents 1 μm. c, Line scans quantifying the fluorescence distribution of RFP-mutant actin relative to EGFP-actin from the co-transfected IHCs. The peak RFP level was set as 0 on x axis and the fluorescence intensity was normalized to the maximal fluorescence intensity of row 1. The line scan results were collected from −0.4 μm (above tips) to 0.8 μm (below tips) on x axis as described. The shadow lines represent individual stereocilia; the thick solid lines with error bars are the average level of all stereocilia with SD. Results were collected from 16–19 cells.
Fig. 7:
Fig. 7:. Tip filaments depend on tip-localized myosins.
a, Representative images of His-TMOD1 stained row 1 stereocilia and row 2 stereocilia, co-labeled after expansion microscopy with antibodies to endogenous MYO3A or MYO15A (green) from P5 mice. NHS-ester (grey) stained total protein. b, His-TMOD1 (green, grey) labeling in Myo3 double mutant (Myo3aΔ14/Δ14 Myo3bΔ12/Δ12, noted in Supplementary Fig. 5a) and littermate control IHCs at P4. c, Quantification of His-TMOD1 level from the tips of row 1 stereocilia in Myo3a;Myo3b G0 mutants generated via i-GONAD (Supplementary Fig. 5a) and in littermate control IHCs, each at P4. The His-TMOD1 level was normalized to the average fluorescence intensity of row 1 stereocilia in control. Smaller circles represent stereocilia; larger open circles represent averages from mice (N). Results from 4 mice were plotted with mean ± SD. d, HA-TMOD1 (green, grey) labeling in Myo15a mutant (Myo15aΔ25/Δ25) and littermate control (Myo15aΔ25/+) IHCs at P4. e, Quantification of HA-TMOD1 level from the tips of row 1 stereocilia in MYO15A mutant and littermate control IHCs (P4). The level of HA-TMOD1 was normalized to the average intensity of cell junctions. Smaller circles represent stereocilia; larger open circles represent averages from cochleae (N). Results from 3 mice were plotted with mean ± SD. P values of (c) and (e) for two-tailed unpaired t tests are indicated based on N (*, P < 0.05 and **, P < 0.01). f, His-TMOD1 (magenta, grey) labeling in an EGFP-MYO3A (green) transfected IHC and a neighboring untransfected cell (P5). F-actin was stained by phalloidin (blue). g, Graphs of His-TMOD1 and EGFP-MYO3A fluorescence intensities at row 1 or row 2 stereocilia tips. Simple linear regression analysis was applied to the data. Linear regression R-squared value was 0.52 (row 1) and 0.51 (row 2). h, His-TMOD1 (magenta, grey) labeling in an EGFP-MYO15A-2 (green) transfected IHC and a neighboring untransfected cell (P5). i, Graph of His-TMOD1 and EGFP-MYO15A-2 fluorescence intensities at row 1 stereocilia tips. Simple linear regression analysis was applied to the data. Linear regression R-squared value was 0.88. Individual stereocilia are plotted, collected from 9–10 cochleae. At least 2 independent experiments were collected for analysis in (g) and (i). Scale bars in all panels represent 5 μm.

References

    1. Tilney L. G., Derosier D. J. & Mulroy M. J. The organization of actin filaments in the stereocilia of cochlear hair cells. J Cell Biol 86, 244–259 (1980). 10.1083/jcb.86.1.244 - DOI - PMC - PubMed
    1. Schneider M. E., Belyantseva I. A., Azevedo R. B. & Kachar B. Rapid renewal of auditory hair bundles. Nature 418, 837–838 (2002). 10.1038/418837a - DOI - PubMed
    1. Krey J. F. et al. Mechanotransduction-Dependent Control of Stereocilia Dimensions and Row Identity in Inner Hair Cells. Curr Biol 30, 442–454 e447 (2020). 10.1016/j.cub.2019.11.076 - DOI - PMC - PubMed
    1. Krey J. F. et al. Control of stereocilia length during development of hair bundles. PLoS Biol 21, e3001964 (2023). 10.1371/journal.pbio.3001964 - DOI - PMC - PubMed
    1. Rzadzinska A. K., Schneider M. E., Davies C., Riordan G. P. & Kachar B. An actin molecular treadmill and myosins maintain stereocilia functional architecture and self-renewal. J Cell Biol 164, 887–897 (2004). 10.1083/jcb.200310055 - DOI - PMC - PubMed

Publication types

LinkOut - more resources