[Preprint]. 2024 Dec 5:rs.3.rs-5510550.
doi: 10.21203/rs.3.rs-5510550/v1.

Fatty Acid Synthase-Derived Lipid Stores Support Breast Cancer Metastasis

Affiliations

Fatty Acid Synthase-Derived Lipid Stores Support Breast Cancer Metastasis

Chaylen Andolino et al. Res Sq. .

Update in

Abstract

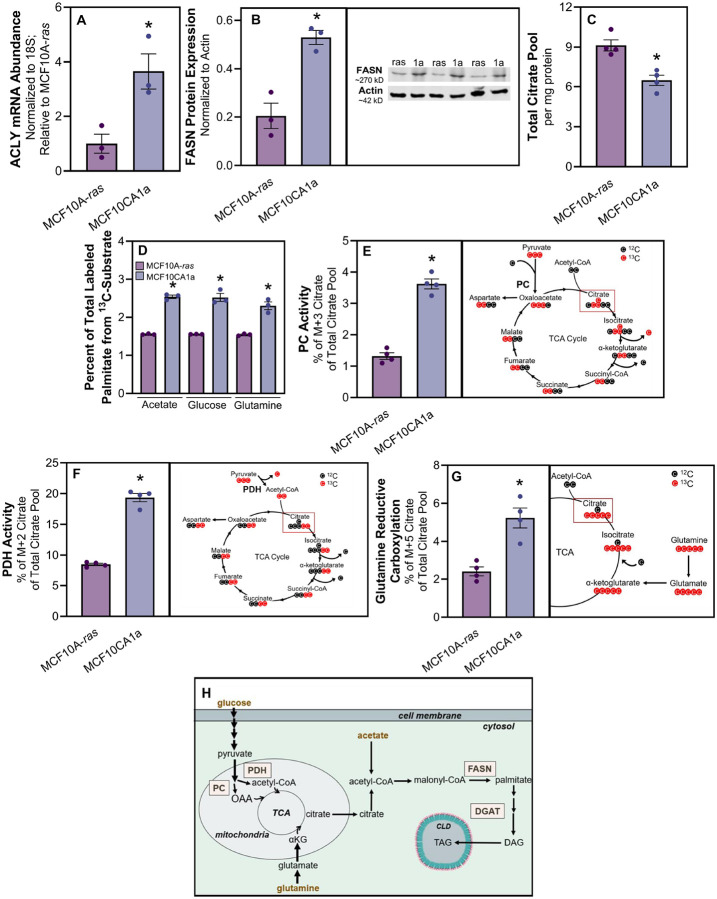
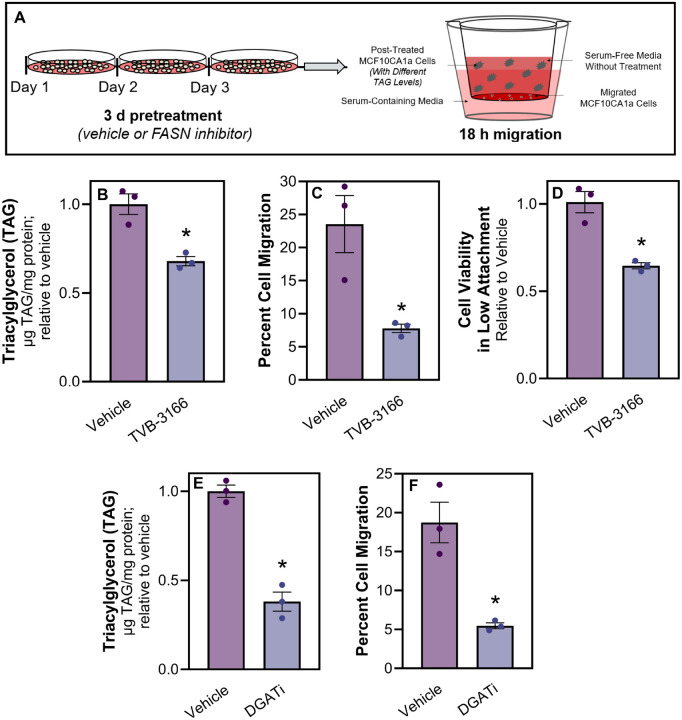
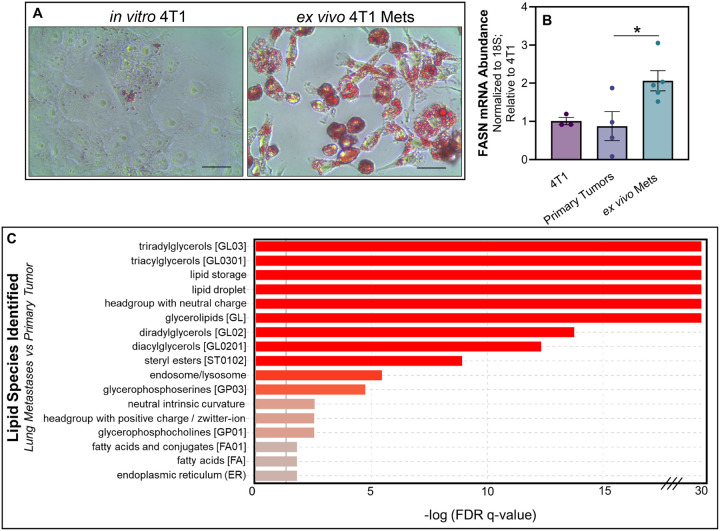
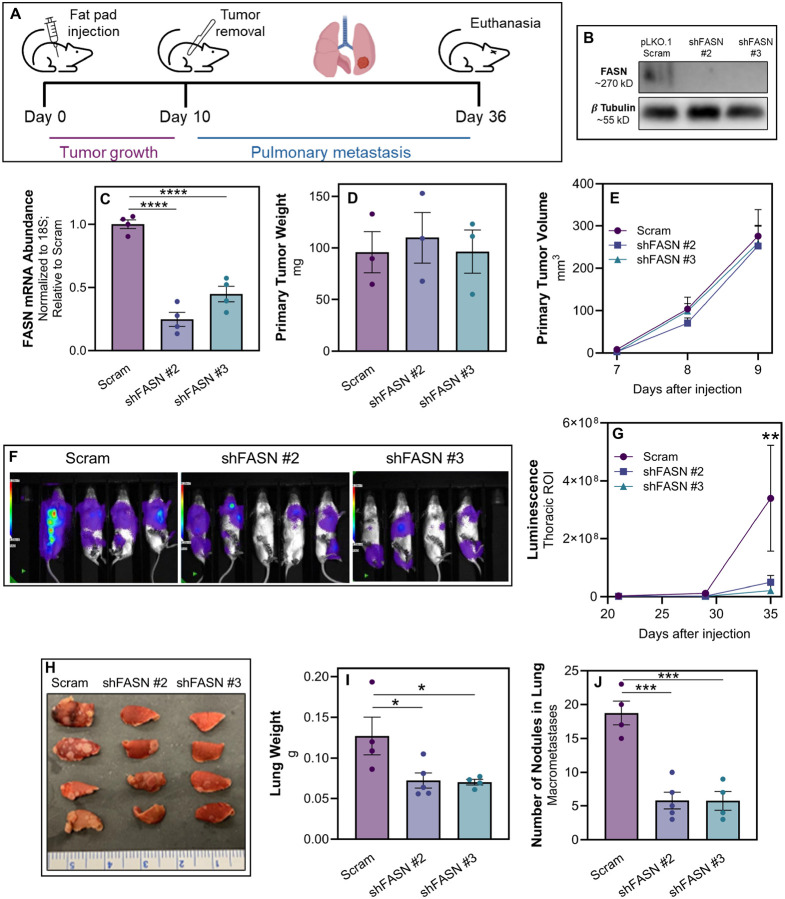
Lipid accumulation is associated with breast cancer metastasis. However, the mechanisms underlying how breast cancer cells increase lipid stores and their functional role in disease progression remain incompletely understood. Herein we quantified changes in lipid metabolism and characterized cytoplasmic lipid droplets in metastatic versus non-metastatic breast cancer cells. 14C-labeled palmitate was used to determine differences in fatty acid (FA) uptake and oxidation. Despite similar levels of palmitate uptake, metastatic cells increase lipid accumulation and oxidation of endogenous FAs compared to non-metastatic cells. Isotope tracing also demonstrated that metastatic cells support increased de novo lipogenesis by converting higher levels of glutamine and glucose into the FA precursor, citrate. Consistent with this, metastatic cells displayed increased levels of fatty acid synthase (FASN) and de novo lipogenesis. Genetic depletion or pharmacologic inhibition of FASN reduced cell migration, survival in anoikis assays, and in vivo metastasis. Finally, global proteomic analysis indicated that proteins involved in proteasome function, mitotic cell cycle, and intracellular protein transport were reduced following FASN inhibition of metastatic cells. Overall, these studies demonstrate that breast cancer metastases accumulate FAs by increasing de novo lipogenesis, storing TAG as cytoplasmic lipid droplets, and catabolizing these stores to drive several FAO-dependent steps in metastasis.

Keywords: FASN; TNBC; breast cancer; fatty acid synthase; fatty acids; lipid droplet; lipid metabolism; lipid storage; mass spectrometry; metastasis.


Conflict of interest statement

Competing interests The authors have no conflict of interest to disclose.

Figures

Figure 1
Figure 1
Metastatic breast cancer cells accumulate lipid. A Representative transmission electron micrographs of MCF10A-ras (top) or MCF10CA1a (bottom) cells. Images stacked above and below each other were taken at the same magnification. The yellow arrow indicates LDs. B Quantification of TEM imaging; size of LDs determined using ImageJ. C Representative Oil Red O images of MCF10A-ras(left) or MCF10CA1a (right) cells. Images were taken at the same magnification. D TAG accumulation in MCF10A-ras(white) and MCF10CA1a (gold) cells. Asterisk indicates p < 0.05 between MCF10A-ras and MCF10CA1a; 3 biological replicates per cell line.
Figure 2
Figure 2
Fatty acid oxidation is required for metastatic cell migration. A Wound healing assay using MCF10A-ras (black) and MCF10CA1a (gold) cells, either treated with vehicle (DMSO; dotted) or etomoxir (75 μM; solid). B Transwell migration assay following 18 hours of treatment as described in (A). C 14Cpalmitate uptake in MCF10A-ras (white) and MCF10CA1a (gold) cells after 15 minutes of incubation. D 14C-palmitate oxidation in MCF10A-ras (white) and MCF10CA1a (gold) cells after 2 hours of incubation. E Oxygen consumption rate (OCR) in MCF10A-ras (darker shades) and MCF10CA1a (lighter shades) with either media (blue) or FAO inhibitor (etomoxir, green). Basal response is indicated as time before first injection, acute response to FAO inhibition is displayed following second injection, and maximal response to FAO inhibition is demonstrated following the third injection. F Histogram of maximal response in vehicle- and etomoxir-treated cells. G Cells were treated with either vehicle (DMSO, white), FAO inhibitor (etomoxir, gray), adipose triacylglycerol lipase inhibitor (ATGListatin; black check), or etomoxir and ATGListatin together (gray and black check) during 18 hour transwell incubation. Asterisks indicate p < 0.05 between MCF10A-ras and MCF10CA1a, or treatment and vehicle, at given time point (A) or at end of assay (B); 3 biological replicates per cell line or treatment; 6 technical replicates per Seahorse assay. Seahorse assay data presented is representative of results from two independent experiments.
Figure 3
Figure 3
Metastatic cells have increased fatty acid synthesis from non-lipid substrates. A Relative ATP citrate lyase (ACLY) mRNA abundance in MCF10A-ras (white) and MCF10CA1a (gold) cells. B Fatty acid synthase (FASN) protein expression between MCF10A-ras (white) and MCF10CA1a (gold) cells. C Total citrate pool size between MCF10A-ras (white) and MCF10CA1a (gold) cells. D Percent of carbon incorporation from acetate, glucose, or glutamine into palmitate in MCF10A-ras (white) or MCF10CA1a (gold) cells. E Pyruvate carboxylase (PC) activity between MCF10A-ras (white) and MCF10CA1a (gold). PC activity is indicated by the M+3 labeling pattern of citrate following 13C-glucose incubation (right panel). F Pyruvate dehydrogenase (PDH) activity between MCF10A-ras (white) and MCF10CA11a (gold). PDH activity is indicated by the M+2 labeling pattern of citrate following 13C-glucose incubation (right panel). G Carbon flux from glutamine through the reverse tricarboxylic acid (TCA) cycle is indicated by the M+5 labeling pattern of citrate following 13C-glutamine incubation. H Schematic of substrates (gold) that contribute to synthesis of FAs within the MCF10CA1a cell. Asterisks indicate p < 0.05 between MCF10A-ras and MCF10CA1a among 3 or 4 biological replicates, as indicated by individual data points. Abbreviations: OAA = oxaloacetate; TCA = tricarboxylic acid cycle; DGAT = diacylglycerol acyltransferase; TAG = triacylglycerol.
Figure 4
Figure 4
Inhibition of Fatty Acid Synthase (FASN) decreases TAG stores and limits metastatic cell migration. A Schematic of experimental design of migration assays. MCF10CA1a cells were treated with inhibitors denoted in each figure panel, or vehicle (DMSO). After 72 hours of treatment, TAG analysis was assessed or cells were plated for an additional 18 hours in a transwell, without any treatments present. B TAG and C migration were measured between vehicle (white) or 20 μM TVB-3166 (FASNi; grey) treated MCF10CA1a cells. D MCF10CA1a cell viability in detached conditions following vehicle (white) or TVB3166 (FASNi; grey) treatment for 72 hours. E TAG and F migration were measured between vehicle or simultaneous PF 04620110 + PF 06424439 (DGAT 1 and 2 inhibitors, respectively; DGATi; grey) treated MCF10CA1a cells. Asterisk indicates p < 0.05 between vehicle and inhibitor treated MCF10CA1a cells of 3 biological replicates.
Figure 5
Figure 5
FASN-inhibition by TVB-3166 alters whole cell protein abundance patterns. A Top 20 clusters of statistically enriched Kyoto Encyclopedia of Genes and Genomes (KEGG) pathways and Gene Ontology Biological Processes (GO_BP) terms lower in FASN-inhibited MCF10CA1a cells compared to vehicle-treated cells (top). Enriched clusters of KEGG pathways and GO_BP terms higher in FASN-inhibited presented in network format (bottom). B Top 20 clusters of statistically enriched Kyoto Encyclopedia of Genes and Genomes (KEGG) pathways and Gene Ontology Biological Processes (GO_BP) terms higher in FASN-inhibited MCF10CA1a cells (top). Enriched clusters of KEGG pathways and GO_BP terms higher in FASN-inhibited presented in network format (bottom). The greater the −log10(P) value for top panels indicate more enriched terms. Statistically enriched similar terms are organized into clusters and colored based on the representative parent term for the cluster. Each circle within a colored cluster represents one term, and the size of the circle correlates with the number of proteins identified within that term. Similar terms are connected by a line, with a thicker line indicating higher similarly between terms. Enrichment values and cluster networks were calculated using Metascape.
Figure 6
Figure 6
FASN expression and lipid accumulation are increased following metastasis. A Oil Red O staining of in vitro cultured 4T1 cells and those isolated from lung metastases. B Quantitative RT-PCR analyses of FASN expression in in vitro cultured 4T1 cells, or those cultured ex-vivo within 3 passages post isolation from either mammary fat pad primary tumors (1° tumors) or pulmonary metastases (mets). Data are normalized to FASN levels in in vitro cultured 4T1 cells and derived from four separate primary tumors and five separate pulmonary metastases. Asterisk indicates p < 0.05 between primary tumors and pulmonary metastases. C LIPID Informatics Analysis (LION) enrichment analysis comparing lipidomic pro les between ex vivo cultures of 4T1 cells from lung metastasis (LM) cells and primary tumor (PT). Lipid classes are ranked based on the -log of the q-value’s false discovery rate (FDR), with a higher value indicating greater enrichment. Red bars denote lipid classes that are significantly more enriched in LM cells compared to PT cells, while grey bars represent lipid classes with no significant difference in enrichment.
Figure 7
Figure 7
FASN is required for lung metastasis. A Schematic representation of the experimental design for assessing the impact of FASN depletion on tumor progression and metastasis in 4T1 cells. Following fat pad engraftment of 4T1 cells, primary tumors were surgically removed and subsequent development of pulmonary metastasis was monitored by bioluminescence over 26 days. B Western blot analysis demonstrating depletion efficiency of FASN in 4T1 cells expressing a scrambled shRNA (pLKO.1 scram) or shRNAs targeting FASN (shFASN #2 and #3). β-Tubulin served as a loading control. C Quantitative RTPCR analysis of FASN mRNA expression levels in 4T1 cells post-transfection with scrambled shRNA or shFASN constructs. Data represents mRNA expression fold change, normalized to GAPDH expression. Data are the mean of 3 biological replicates completed in triplicate where **** indicates p < 0.0001. D Bar graph showing the weight of 4T1 primary tumors upon excision from the mammary fat pad. The weights are presented as mean ± SEM. E Growth curve representing the volume of mammary tumors measured at the indicated time points following fat pad engraftment. F In vivo bioluminescent imaging of mice bearing control (Scram) and FASN-depleted (shFASN) 4T1 metastases, 35 days after fat pad engraftment. G Quantitative analysis of thoracic bioluminescence from 4T1 tumor bearing mice. Data represent the mean thoracic luminescence intensity ± SEM for each group at specified time points after cell injection. H Photograph of excised lungs from mice in each treatment group, showing differences in macroscopic metastases burden. I Bar graph depicting the total lung weights from each group. Weights are presented as mean ± SEM. J Quantification of macroscopic nodules present in the lungs. For panels D-J, data are the mean of each group (n ≥ 4) ± SEM, with ‘ns’ indicating no significant difference, * indicating p < 0.05, and *** indicating p < 0.001.

References

    1. Siegel RL, Miller KD, Wagle NS, Jemal A. Cancer statistics, 2023. CA Cancer J Clin. 2023. Jan;73(1):17–48. - PubMed
    1. Scully OJ, Bay BH, Yip G, Yu Y. Breast cancer metastasis. Cancer Genomics Proteomics. 2012. Oct;9(5):311–20. - PubMed
    1. Valastyan S, Weinberg RA. Tumor metastasis: molecular insights and evolving paradigms. Cell. 2011. Oct 14;147(2):275–92. - PMC - PubMed
    1. Hanahan D. Hallmarks of Cancer: New Dimensions. Cancer Discov. 2022. Jan;12(1):31–46. - PubMed
    1. Bergers G, Fendt SM. The metabolism of cancer cells during metastasis. Nat Rev Cancer. 2021. Mar;21(3):162–80. - PMC - PubMed

Publication types

LinkOut - more resources