[Preprint]. 2024 Dec 3:rs.3.rs-5454144.
doi: 10.21203/rs.3.rs-5454144/v1.

Identification of specific microbiota members that induce beige fat biogenesis in response to dietary cues

Affiliations

Identification of specific microbiota members that induce beige fat biogenesis in response to dietary cues

Kenya Honda et al. Res Sq. .

Abstract

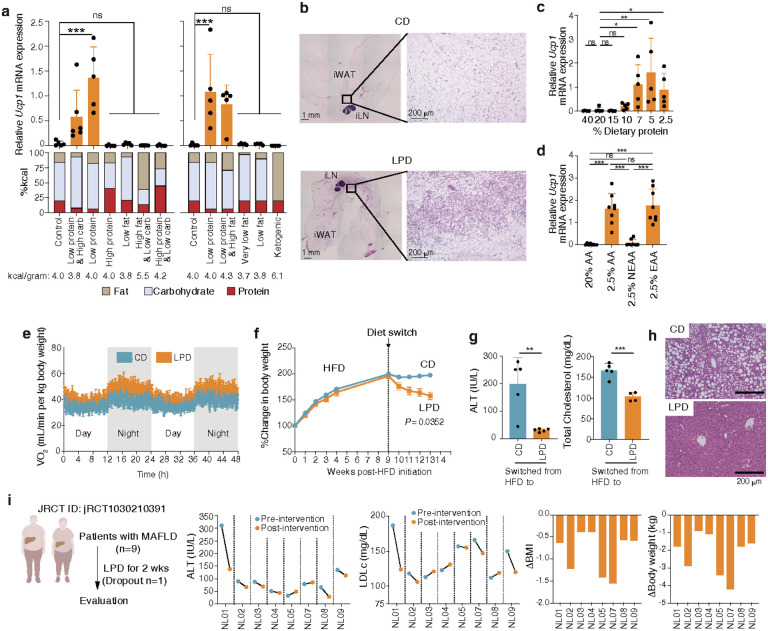
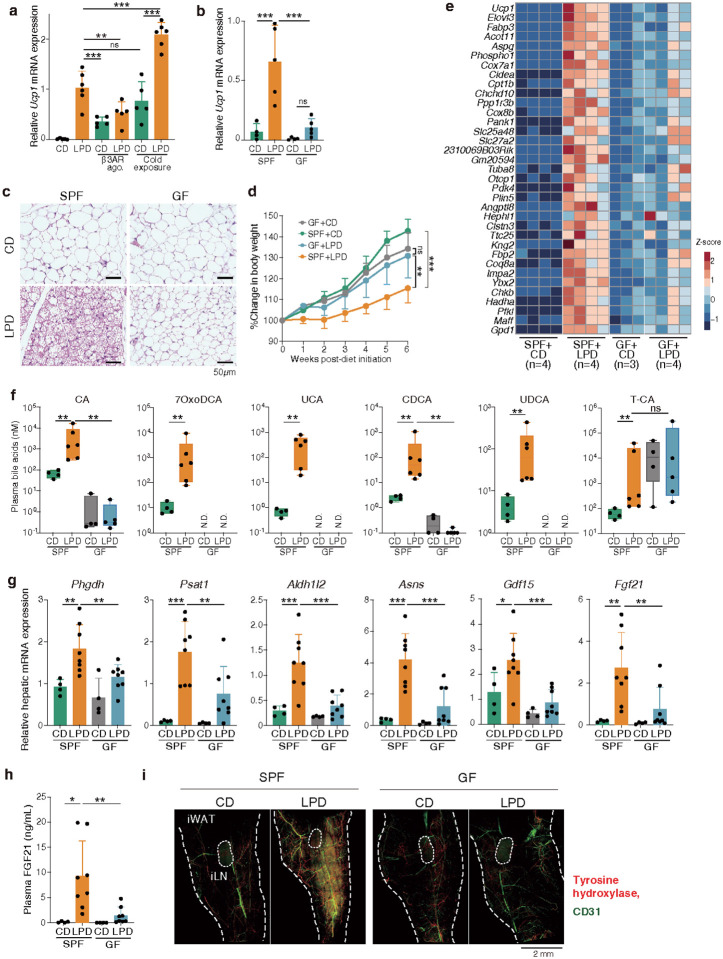
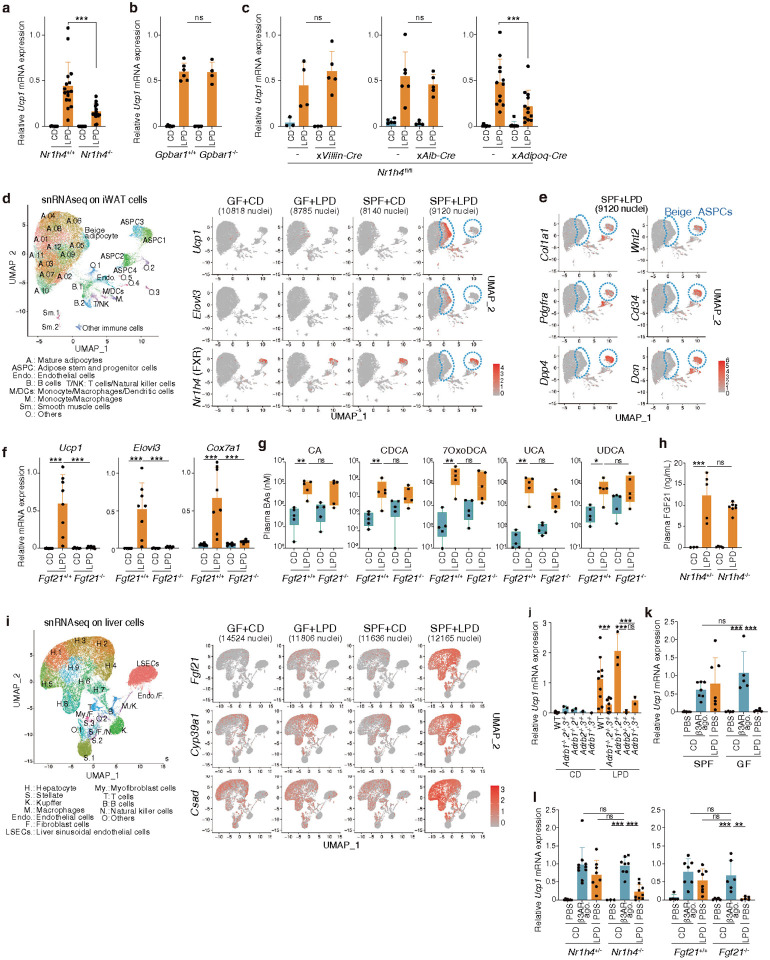
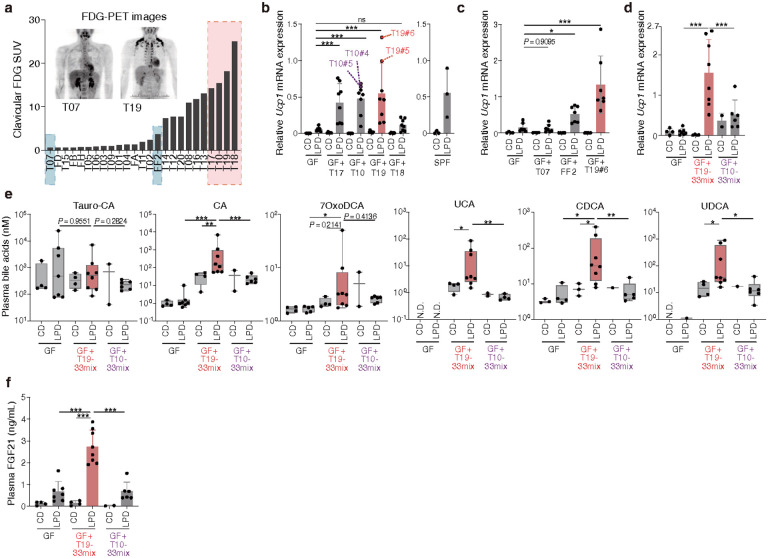
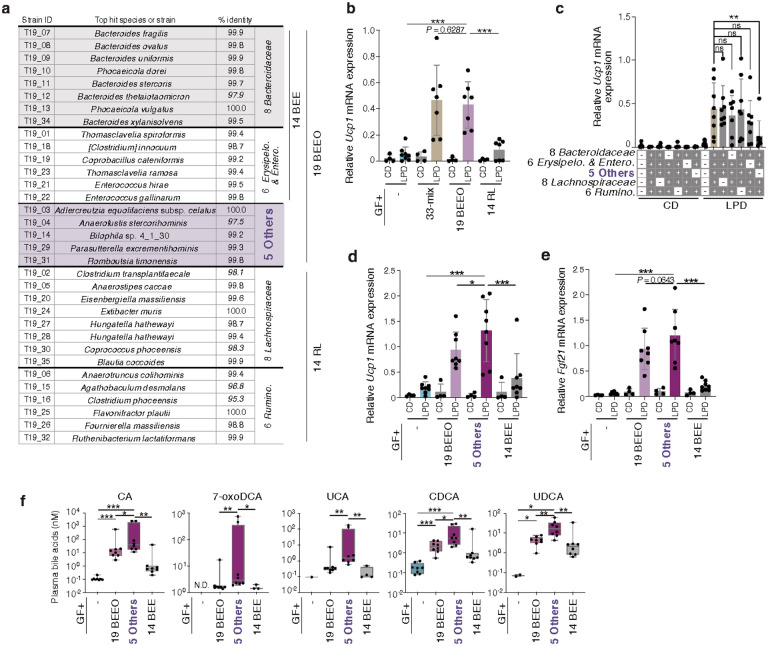
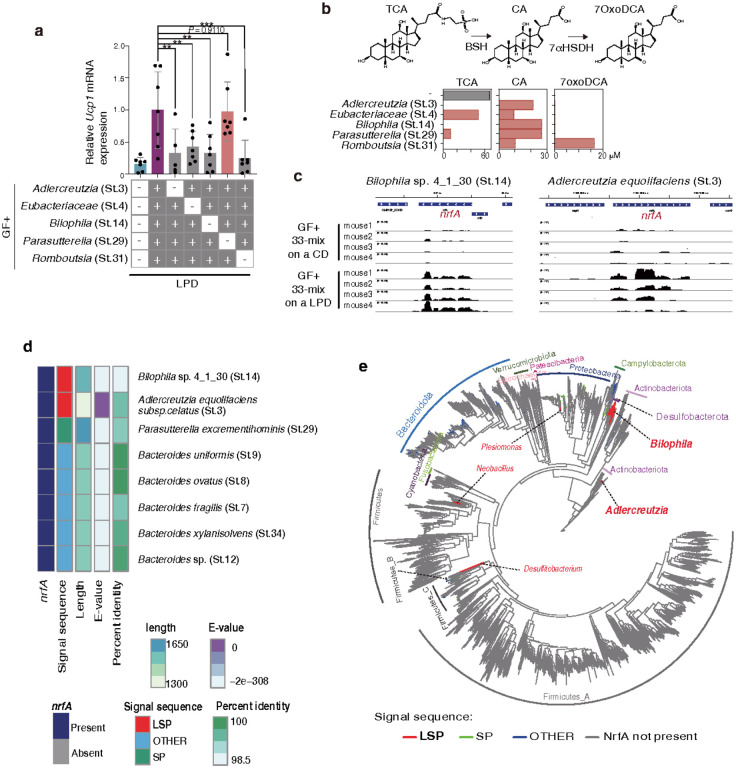
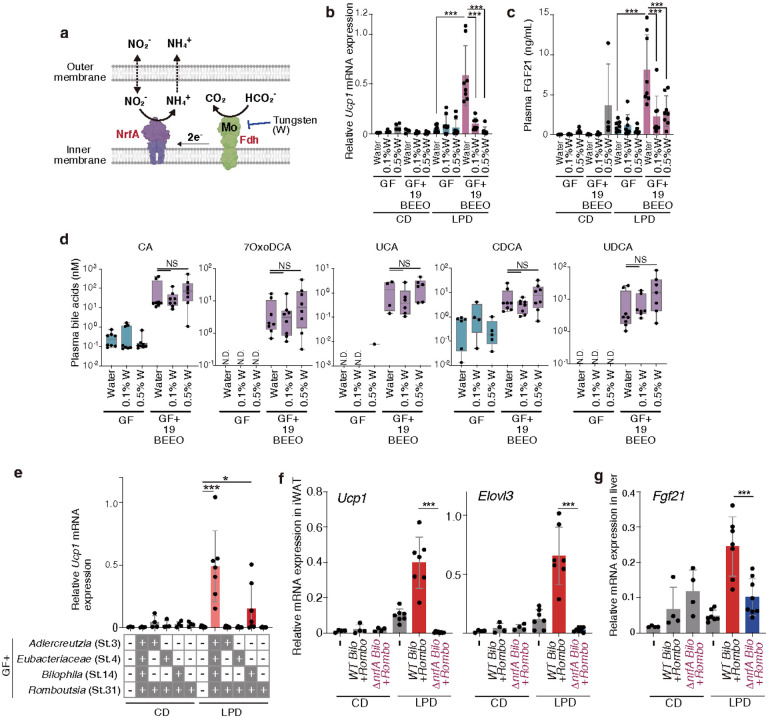
Activation of brown and beige fat biogenesis promotes metabolic health in rodents and humans, but typically requires cold exposure or pharmacological activation of β-adrenergic receptors, which may pose cardiovascular risks. Dietary intervention represents a clinically viable alternative strategy to induce beige cells and thus enhance metabolic health, though the underlying mechanisms remain poorly understood. In this study, we identified specific microbiota members in both mice and humans that promote browning of white adipose tissue (WAT) and ameliorate metabolic disorders in the context of a low-protein diet (LPD). Diets with low protein, regardless of fat and carbohydrate content, induced robust WAT browning to a degree comparable to that achieved by cold exposure or β-adrenergic receptor agonist administration. LPD-mediated browning was markedly diminished in germ-free (GF) mice, highlighting the essential role of the gut microbiota. Microbiota-induced browning occurred independently of the immune system and primarily through mechanisms involving increased circulating deconjugated bile acids, activation of the farnesoid X receptor (FXR) in WAT progenitor cells, and enhanced hepatic production of FGF21. The browning defect in GF mice was rescued by transplanting microbiota from conventional mice or from brown/beige fat-positive healthy human volunteers, as determined by fluorodeoxyglucose positron-emission tomography (FDG-PET). Defined bacterial consortia, comprising strains isolated from mice or FDG-PET-positive human volunteers, were sufficient to elevate plasma bile acids and hepatic FGF21 levels by modulating nitrogen metabolism, ultimately restoring browning in response to a LPD. Our findings highlight the significant impact of diet-microbiota interactions on WAT browning and suggest their therapeutic potential for managing metabolic diseases.


Conflict of interest statement

Additional Declarations: Yes there is potential Competing Interest. Kenya Honda is a scientific advisory board member of Vedanta Biosciences and 4BIO CAPITAL. Masahiro Ueda is an employee of JSR corporation. Ramnik J. Xavier is co-founder of Jnana Therapeutics and Celsius Therapeutics, scientific advisory board member at Nestlé, and board director at MoonLake Immunotherapeutics. Damian.R.Plichta is an employee of Novonesis A/S. All other authors declare no competing interests.

Figures

Figure 1
Figure 1. Low protein diets induce beige cells and ameliorate obesity and fatty liver disease.
a, SPF B6 male mice were fed diets with varying proportions of protein, carbohydrates, and fats for 6 weeks. Ucp1 mRNA expression in inguinal white adipose tissue (iWAT), normalized to Ppib, is shown along with stacked bar graphs representing each diet’s macromolecular composition and total energy content (kcal/g). The left and right panels show results from two independent experiments. b, Hematoxylin and eosin (H&E) staining of iWAT from mice fed either a control diet (CD, 20% protein content) or a low-protein diet (LPD, 7% protein content) for 6 weeks. c, d, Relative iWAT Ucp1 expression in mice fed isocaloric diets containing various concentrations of protein (c) or 2.5% essential or nonessential amino acids (d) for 6 weeks. e, Oxygen consumption rate (VO2) of SPF B6 mice fed a CD or LPD (n=5 mice per group) was measured every 3 minutes over 48 hours. Mean ± s.e.m. is shown at each time point. f-h, SPF B6 male mice were fed a high-fat diet (HFD) for 9 weeks and then switched to a CD or LPD (n=5 mice per group). Body weight change (f), plasma levels of alanine transaminase (ALT) and cholesterol (g), and representative liver H&E staining (h) are shown. i, Patients with fatty liver disease were placed on commercially available LPDs for 2 weeks. Changes in plasma ALT, LDL(low-density lipoprotein cholesterol), body mass index (BMI), and body weight are shown. In a, c, d, g, each circle represents an individual animal, and the height of each bar represents the mean ± s.d. ***P < 0.001; **P < 0.01; *P < 0.05; ns, not significant; analyzed by one-way ANOVA with Benjamini–Hochberg correction for multiple comparisons (a, d), Mann-Whitney test (two-tailed) for each comparison (c), unpaired t-test (g), or two-way ANOVA with Bonferroni’s correction (f).
Figure 2
Figure 2. LPD-induced browning is dependent on the microbiota
a, SPF B6 male mice were fed a CD or LPD for 6 weeks. During the last week, they either received daily intraperitoneal injections of a β3 adrenergic receptor agonist (β3AR ago, CL316,243, 20 mg/mouse/day) or were housed at 6°C. b-h, GF and SPF B6 male mice were fed a CD or LPD for 6 weeks. Relative gene expression in iWAT and liver was measured by qPCR and normalized to Ppib (a, b, g). Representative H&E staining of iWAT (c) and percent change in body weight (d) is shown. Heat map displays genes with higher expression levels in iWAT from SPF+LPD mice compared to SPF+CD, GF+CD, and GF+LPD mice, as determined by RNA-seq. These genes exhibit RPKM values ≥ 200, a fold change ≥ 4, and an adjusted p-value < 0.05 relative to the SPF+CD condition (e). Plasma bile acids were quantified by LC-MS/MS (f), relative expression of hepatic genes was quantified by qPCR and normalized to Ppib (g), and plasma FGF21 was quantified by ELISA (h). Representative merged images of whole-mount iWAT staining with anti-tyrosine hydroxylase and anti-CD31 antibodies obtained using a light sheet microscope after iDISCO processing (i). Dashed lines indicate the boundaries of the inguinal lymph nodes (center; iLN) and iWAT (periphery). In a, b, g, each circle represents an individual animal, and bars indicate the mean ± s.d. In f, horizontal lines in the box plots represent the median; box boundaries indicate the interquartile range; and whiskers indicate the data range. ***P < 0.001; **P < 0.01; *P < 0.05; ns, not significant; analyzed by one-way ANOVA with the Benjamini–Hochberg correction for multiple comparisons (a, b, g, h), two-way ANOVA (d), or two-tailed Mann-Whitney test for each comparison (f). N.D., not detected.
Figure 3
Figure 3. FXR and FGF21 signalling mediate LPD-induced browning.
a–c, f, j, SPF B6 mice of the indicated genotypes were fed a CD or LPD for 6 weeks. Gene expression in iWAT, normalized to Ppib, was measured by qPCR. d, e, i, snRNA-seq was performed on iWAT (d, e) and liver samples (i) from GF and SPF mice fed a CD or LPD. Uniform manifold approximation and projection (UMAP) plots and expression of the indicated genes are shown. g, h, Mice of the indicated genotypes were fed a CD or LPD, and plasma bile acids (g) and FGF21 (h) were quantified by LC-MS/MS and ELISA, respectively. k, l, SPF and GF B6 mice, or SPF mice of the indicated genotypes, were fed a CD or LPD for 6 weeks. During the last week, they received daily intraperitoneal injections of a β3 adrenergic receptor agonist (β3AR ago., CL316,243, 20 μg/mouse/day) or PBS. Relative Ucp1 expression in iWAT, normalized to Ppib, was determined by qPCR. Each circle represents an individual animal. In a–c, f, h, j–l, the height of each bar indicates the mean ± s.d. Horizontal lines in box plots (g) indicate the median; box boundaries indicate the interquartile range; and whiskers indicate the data range. ***P < 0.001; **P < 0.01; *P < 0.05; ns, not significant; analyzed by one-way ANOVA with Benjamini–Hochberg correction for multiple comparisons (a–c, f, h, j–l) or two-tailed Mann-Whitney test for each comparison (g).
Figure 4
Figure 4. 20 mouse-derived microbial isolates promote LPD-mediated browning.
a, Schematic representing the strategy for isolation of browning-inducing commensal strains from the gut microbiota of SPF mice. b, c, e, f, GF mice were colonized with ileal microbiota from LPD-fed SPF mouse A, SPF mouse B, or exGF mouse B#28, or with defined bacterial consortia (18-mix or 20-mix). Gnotobiotic mice were fed a LPD for 6 weeks, and relative Ucp1 expression in iWAT was measured by qPCR. d, Ileal microbiota compositions of mouse B, B#28, and B#28–1 were determined by 16S rRNA gene sequencing. The 20 strains isolated from mouse B#28–1 are listed. g, Representative H&E staining images of iWAT from the indicated groups of mice. h, i, Plasma bile acids (h) and FGF21 (i) were quantified in the indicated mice by LC-MS/MS and ELISA, respectively. j, Ucp1 expression in iWAT from GF Nr1h4/− or GF Fgf21/− mice inoculated with 20-mix or vehicle control and fed a CD or LPD for 6 weeks. In b, c, e, f, h-j, each circle represents an individual animal and the height of each bar indicates the mean ± s.d. Horizontal lines in box plots indicate the median; box boundaries indicate the interquartile range; whiskers indicate the data range (g). ***P < 0.001; **P < 0.01; *P < 0.05; ns, not significant; analyzed by one-way ANOVA with Benjamini–Hochberg correction for multiple comparisons (b, c, e, f, i, j) or two-tailed Mann-Whitney test for each comparison (h). N.D., not detected.
Figure 5
Figure 5. Down-selection of human-derived bacterial strains that induce LPD-mediated browning.
a, Standardized uptake values (SUV) of FDG in the supraclavicular regions of each volunteer. Highlighted columns indicate samples that were selected for follow-up analysis, and representative FDG-PET images are shown as inserts. b–f, GF B6 mice were colonized with faecal microbiota from the indicated human subjects or with defined bacterial consortia and then fed either a CD or LPD for 6 weeks. Relative Ucp1 expression in iWAT, normalized to Ppib, was determined by qPCR (b-d). Plasma bile acids (e) and FGF21 (f) were quantified by LC-MS/MS and ELISA, respectively. Each circle represents an individual animal. The height of each bar indicates exact SUV values (a) or the mean ± s.d. (b-d, f). Horizontal lines in box plots indicate the median; box boundaries indicate the interquartile range, and whiskers indicate the data range (e). ***P < 0.001 ; **P < 0.01; *P < 0.05; ns, not significant; analyzed by one-way ANOVA with Benjamini–Hochberg correction for multiple comparisons (b-d, f) or two-tailed Mann-Whitney test for each comparison (e). N.D., not detected.
Figure 6
Figure 6. Identification of five human-derived isolates that promote browning.
a, List of the 33 T19-derived strains, as determined by 16S rRNA sequencing. b–f, GF B6 mice were colonized with the indicated bacterial consortia and fed a CD or LPD for 4 weeks. Expression of Ucp1 in iWAT (b, c, d) and Fgf21 in the liver (e), normalized to Ppib, were measured by qPCR. Plasma bile acids in the indicated LPD-fed gnotobiotic mice were quantified by LC-MS/MS (f). Each circle represents an individual animal and the height of each bar indicates the mean ± s.d. (b–e). Horizontal lines in box plots (f) represent the median; box boundaries indicate the interquartile range; and whiskers indicate the data range. ***P < 0.001; **P < 0.01; *P < 0.05; ns, not significant; analyzed by one-way ANOVA with Benjamini–Hochberg correction for multiple comparisons (b–e) or two-tailed Mann-Whitney test for each comparison (f). N.D., not detected.
Figure 7
Figure 7. Exploring the role of four human-derived isolates in promoting browning
a, GF B6 mice were colonized with the indicated bacterial consortium selected from 5 Others strains (‘+’ indicates inclusion and ‘−’indicates exclusion) and fed a LPD for 4 weeks. Relative Ucp1 expression in iWAT, normalized to Ppib, was measured by qPCR. b, In vitro bile acid metabolic capacity of the 5 Others strains when starting with 50 μM taurine-conjugated cholic acid. Each circle represents an individual animal and the height of each bar indicates mean ± s.d. (a) or exact bile acid concentration (b). ***P < 0.001; **P < 0.01; *P < 0.05; ns, not significant; analyzed by one-way ANOVA with Benjamini–Hochberg correction for multiple comparisons (a). c,Metatranscriptomic analysis of bacterial RNA extracted from the caecal contents of gnotobiotic mice colonized with T19-derived 33-mix and fed a CD or LPD. Sequence reads are mapped to the nrfA genomic loci of Bilophilasp. 4_1_30 (St.14) and Adlercreutzia equolifaciens (St.3). d, Eggnog-mapper was used to annotate NrfA proteins. Signal sequences of nrfAhomologues were analyzed using SignalP6.0. Bilophila sp. 4_1_30 (St.14) and Adlercreutzia equolifaciens (St.3) possess unique lipoprotein signal sequences (LSP), which are predicted to facilitate localization to the periplasm. “Percent identity” reflects homology to the closest NrfA protein, as assigned by Eggnog-mapper and calculated with BLASTP. “E-value” represents the expect value, indicating the number of chance alignments with an equal or higher bit score, as computed by BLASTP. “Length” indicates the length of the protein from each isolate that best aligns to NrfA as predicted by Eggnog-mapper. e. nrfA was annotated in all reference genomes from the Unified Human Gastrointestinal Genome (UHGG) using Eggnog, and signal sequences were analyzed using SignalP. “SP” stands for Sec/SPI: the “standard” secretory signal peptide putatively transported by the Sec translocon and cleaved by Signal Peptidase I, whereas LSP is Sec/SPII: lipoprotein signal peptide known to be transported by the Sec translocon and cleaved by Signal Peptidase II. Species carrying LSP containing nrfA homologues are highlighted in red.
Figure 8
Figure 8. Bilophila-encoded nrfAcontributes to LPD-mediated browning.
a, Schematic illustrating nitrite reduction by NrfA in combination with formate dehydrogenase (Fdh). b–d, GF B6 mice were colonized with 19BEEO-mix and fed a CD or LPD for 3 weeks. During the last 2 weeks, mice were treated with 0.1% or 0.5% sodium tungstate dihydrate (W) via the drinking water. Relative Ucp1 expression in iWAT (b), plasma FGF21 levels (c), and plasma bile acid concentrations (d) were measured using qPCR, ELISA, and LC-MS/MS, respectively. e, GF B6 mice were colonized with the indicated 2 bacterial strains selected from the hu4-mix (‘+’ indicates inclusion and ‘−’indicates exclusion) and fed a CD or LPD for 4 weeks. Relative UcP1 expression in iWAT, normalized to Ppib, was measured by qPCR. f, g, GF B6 mice were colonized with either ΔnrfAor wild-type (WT) Bilophila sp. 4_1_30 (St.14) (Bilo) in combination with Romboutsia timonensis (St.31) (Rombo) and fed a CD or LPD for 4 weeks. Expression of Ucp1 and Elovl3 in iWAT and Fgf21in the liver, normalized to Ppib, were determined by qPCR. Each circle represents an individual animal and the height of each bar indicates the mean ± s.d. (b, c, e-g). Horizontal lines in box plots (d) represent the median; box boundaries indicate the interquartile range; and whiskers indicate the data range. ***P < 0.001; **P < 0.01; *P < 0.05; ns, not significant; analyzed by one-way ANOVA with Benjamini–Hochberg correction for multiple comparisons (b, c, e–g) or two-tailed Mann-Whitney test for each comparison (d). Mo, molybdopterin, N.D., not detected.

References

    1. Sidossis L. & Kajimura S. Brown and beige fat in humans: thermogenic adipocytes that control energy and glucose homeostasis. J Clin Invest 125,478–486 (2015). 10.1172/JCI78362 - DOI - PMC - PubMed
    1. Becher T. et al. . Brown adipose tissue is associated with cardiometabolic health. Nat Med 27, 58–65 (2021). 10.1038/s41591-020-1126-7 - DOI - PMC - PubMed
    1. Sakers A., De Siqueira M. K., Seale P. & Villanueva C. J. Adipose-tissue plasticity in health and disease. Cell 185,419–446 (2022). 10.1016/j.cell.2021.12.016 - DOI - PMC - PubMed
    1. Arch J. R. Challenges in beta(3)-Adrenoceptor Agonist Drug Development. TherAdvEndocrinol Metab 2, 59–64 (2011). 10.1177/2042018811398517 - DOI - PMC - PubMed
    1. Cypess A. M. et al. Activation of human brown adipose tissue by a beta3-adrenergic receptor agonist. Cell Metab 21, 33–38 (2015). 10.1016/j.cmet.2014.12.009 - DOI - PMC - PubMed

Publication types

LinkOut - more resources