. 2024 Sep 20;2(9):100422.
doi: 10.1016/j.device.2024.100422. Epub 2024 Jun 14.

Ex Vivo Evaluation of a Soft Optical Blood Sensor for Colonoscopy

Affiliations

Ex Vivo Evaluation of a Soft Optical Blood Sensor for Colonoscopy

Arincheyan Gerald et al. Device. .

Abstract

Colonoscopies are vital procedures allowing diagnosis of colorectal cancer and other gastrointestinal diseases. However, excessive forces may be applied to the colon during navigation. This can cause bleeding, especially in patients presenting inflammatory bowel diseases. The endoscopist is often unable to detect bleeding as visualization is limited to the distal tip camera of the endoscope. Thus, there is a need to have bleeding detection capabilities behind the device tip. This work presents a soft optical blood sensor that can be mounted onto a colonoscope. The presence of blood in the sensor's microchannel causes a reduction in optical transmission, and the endoscopist is alerted. We evaluate the sensor safety and performance ex vivo with a cohort of 10 endoscopists (novices and experts). We demonstrate the ability of the sensor to rapidly identify bleeding and easily integrate into the clinical workflow, without significantly affecting navigation time and the users' learning curve.

Keywords: Colonoscopy; Ex Vivo; Minimally Invasive Surgery; Soft Robotics; Soft Sensing.


Conflict of interest statement

Declaration of Interests Max McCandless is currently a post-doctoral researcher at Boston Children’s Hospital, Harvard University. His contributions in this paper were from his tenure as a PhD student at the Material Robotics Laboratory, Boston University (affiliation as declared on the manuscript).

Figures

1.
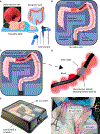
1.. Blood sensor overview.
A) Diagram of the issue of bleeding induced behind the colonoscope’s distal tip. The endoscopist cannot identify bleeding due to lack of visualization. B) An illustration depicting the soft blood sensor mounted onto a colonoscope. As the colonoscope navigates through the colon with bleeding present, the blood enters the sensor microchannel and attenuates incident light from the waveguides. This allows the sensor to detect blood and inform the endoscopist to investigate further. (C) CAD rendering of the sensor showing the microchannel and the optical waveguides that transmit green light and infrared light for selective identification of blood. D) Image of blood sensor mounted on a colonoscope, with the blood analog in the microchannel. Visible (green) and infrared (blue) waveguides are highlighted. E) Microscope image showing the interfacing of the optical waveguides with the microchannel at the optical interrogation zone. F) Microscope image displaying the transmission of light across the microchannel filled with an illuminating tracer dye. The micro-lens is shown focusing the incident visible light.
2.
2.. Optical loss behavior of the blood sensor in response to blood analog.
A) Sensor shows a dual-response to the presence of blood in the microchannel. Visible light is attenuated causing an optical loss while infrared light is unaffected. B) Visible light optical response of the blood sensor with respect to the blood analog ranging from 20% to 100% concentration (v/v). The solid line is the mean value and the shaded area represents the standard deviation computed on four prototypes.
3.
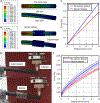
3.. Finite element modeling results.
A) Von Mises stress distribution of colonoscope subject to 10 mm tip displacement. B) Von Mises stress distribution of colonoscope and sensor sleeve subject to 10 mm tip displacement. C) Force vs displacement graph of selected node at the colonoscope distal tip. D) Colonoscope subject to 10 mm tip displacement. E) Colonoscope and sensor sleeve subject to 10 mm tip displacement. F) Force vs displacement graph of the colonoscope with and without sensor sleeve. The solid line is the mean value and the shaded area represents the standard deviation computed on three prototypes.
4.
4.. Force testing setup and optical loss behavior of the sensor in response to incident force.
A) Test setup showing blood sensor sleeve mounted on cylindrical fixture underneath the Instron indenter. B) Plot displaying optical loss of the sensor in response to incident force. The solid line is the mean value and the shaded area represents the standard deviation computed on three prototypes.
5
5. Schematic of the ex vivo test set-up.
A) Clinical workflow of an actual colonoscopy procedure, highlighting the navigational path and distal camera view for the endoscopist. B) Explanted bovine colon arranged in the EndoSim simulator. The colonoscope navigates through the tortuous regions of the colon with the sensor attached on the colonoscope body. C) Bleeding is simulated at a location on the colon behind the distal tip. D) The sensor approaches the location and detects bleeding. E)-F) Images of the EndoSim ColoEASIE 2 simulator with the ex vivo colon inside.
6
6. Images showing the ex vivo test. Top left: view from colonoscope camera, top right: graphical user interface, bottom right: external tripod view of colon in the simulator, bottom left: borescope camera view of sensor mounted on the colonoscope.
A) The sensor is mounted onto the colonoscope and is inserted into the colon. The navigational path is highlighted in blue. B) The colonoscope tip navigates past the intended bleeding location and blood is injected into the colon. C) The sensor comes into contact with the blood at the bleeding site. The blood is visible from the bore-scope camera behind the sensor. D) The sensor detects the blood as it enters its microchannel. The graphical user interface alerts the endoscopist of the bleeding.
7.
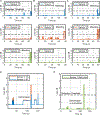
7.. Ex vivo test results displaying sensor loss from four different testing sessions. The graphs display loss data from the sensor triplet as the colonoscope navigates through the colon. When bleeding is simulated at the perforation site, the loss data exhibits sharp spikes above the threshold indicating the detection of blood.
A) Test data from user 1, trial number 4 displaying bleeding detection by sensor 3. B) Test data from user 4, trial 5 displaying bleeding detection by sensor 1 and 2. C) Test data from user 8, trial 2 displaying bleeding detection by sensors 1 and 2. D)-E) Test data from user 10, trial 2 displaying loss of similar magnitude across visible and infrared signals while the sensor navigates through the colon and experiences incident deformation. The net loss from deformation normalizes to a low magnitude below the threshold. The net loss only shows a spike when bleeding is simulated.
8.
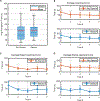
8.. Average navigation times and learning curves for users.
A) Average and median navigation time with and without the sensor attached to the colonoscope. B) Average learning curve for all users. C) Average learning curve for experts. D) Average learning curve for novices.
9.
9.. NASA Task Load Index scores from users with and without the sensor attached onto the colonoscope.
A) Average TLX workload score for all users. B) Average TLX workload score for expert users. C) Average TLX workload score for novice users. D) Average weighted sub-scale ratings contributing to the workload for the two tasks.
10.
10.. Sensor Manufacturing Process.
A) Silicon wafers are patterned using UV lithography. B) PDMS is spin coated onto patterned and blank wafers and then heat cured to form the cladding. C) Patterned cladding is bonded to a blank substrate via oxygen plasma modification. D) Waveguides channels are filled under vacuum with NOA 73 UV adhesive. E) Optical fibers are inserted into the waveguide channels and the core material is UV cured. F) Sensor is bonded onto a 3D printed flexible sleeve that can be mounted onto a colonoscope.
11.
11.. Blood sensor control system schematic.
Diagram displaying the pneumatic control system (left) and optoelectronic circuit (right).

References

    1. Chhikara BS and Parang K (2023). Global Cancer Statistics 2022: the trends projection analysis. Chemical Biology Letters 10, 451.
    1. Siegel RL, Wagle NS, Cercek A, Smith RA, and Jemal A (2023). Colorectal cancer statistics, 2023. CA: A Cancer Journal for Clinicians; 73, 233–254. 10.3322/caac.21772. - DOI - PubMed
    1. Lin JS, Perdue LA, Henrikson NB, Bean SI, and Blasi PR (2021). Screening for Colorectal Cancer: Updated Evidence Report and Systematic Review for the US Preventive Services Task Force. JAMA - Journal of the American Medical Association 325, 1978–1997. 10.1001/jama.2021.4417. - DOI - PubMed
    1. Hong SM and Baek DH (2023). A Review of Colonoscopy in Intestinal Diseases. Diagnostics 13, 1262. 10.3390/diagnostics13071262. - DOI - PMC - PubMed
    1. Baum S, Athanasoulis CA, Waltman AC, Galdabini J, Schapiro RH, Warshaw AL, and Ottinger LW (1977). Angiodysplasia of the right colon: a cause of gastrointestinal bleeding. American Journal of Roentgenology 129, 789–794. 10.2214/ajr.129.5.789. - DOI - PubMed

LinkOut - more resources