

RNA sequencing reveals dynamic expression of genes related to innate immune responses in canine small intestinal epithelial cells induced by Echinococcus granulosus protoscoleces
- PMID: 39679172
- PMCID: PMC11638162
- DOI: 10.3389/fvets.2024.1503995
RNA sequencing reveals dynamic expression of genes related to innate immune responses in canine small intestinal epithelial cells induced by Echinococcus granulosus protoscoleces
Abstract
Background: Dogs are definitive hosts of Echinococcus granulosus, with the small intestine being the only site of parasitic infections. However, the immunomodulatory processes that occur during interactions between E. granulosus and its definitive host remain unclear. Therefore, this study aimed to evaluate gene transcription patterns in canine small intestinal epithelial cells (CIECs) following stimulation by E. granulosus protoscoleces (PSCs). Particularly, this study investigated the roles of pattern recognition receptors (PRRs), involved in recognizing pathogen-associated molecular patterns (PAMPs) and mediating the host innate immune response to the tapeworm E. granulosus.
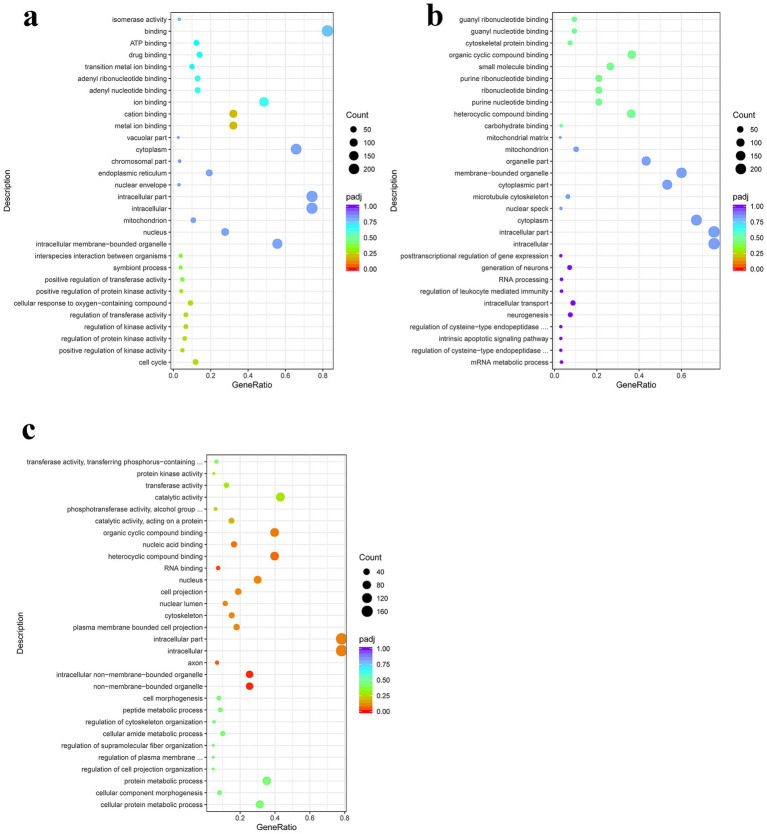
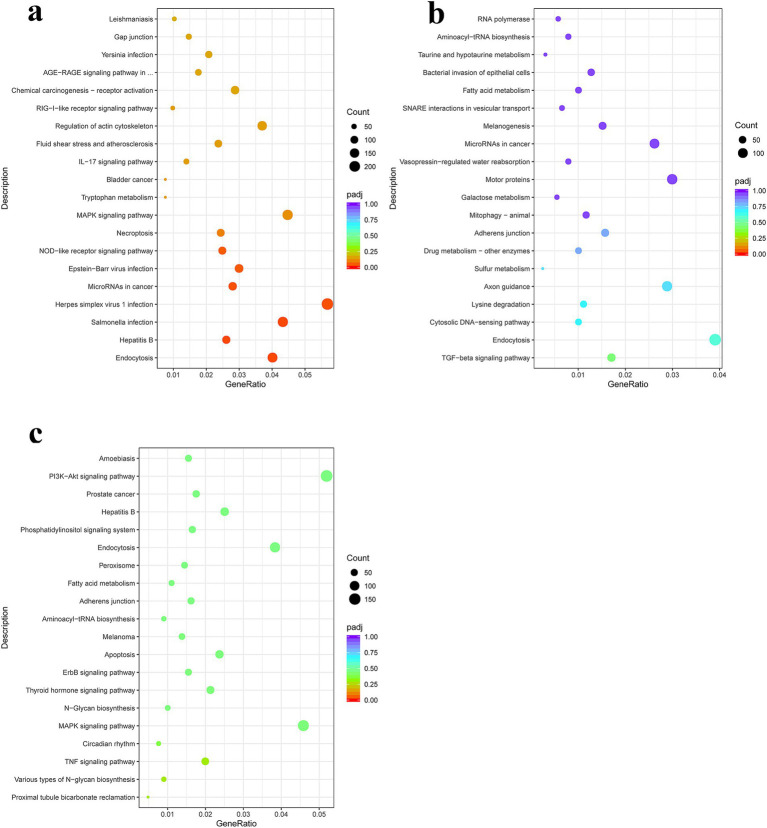
Methods: RNA sequencing (RNA-seq) was used to examine gene transcription patterns in CIECs following stimulation with PSCs for 12 and 24 h. The potential roles of differentially expressed (DE) genes were inferred through Gene Ontology (GO) enrichment and Kyoto Encyclopedia of Genes and Genomes (KEGG) analyses.
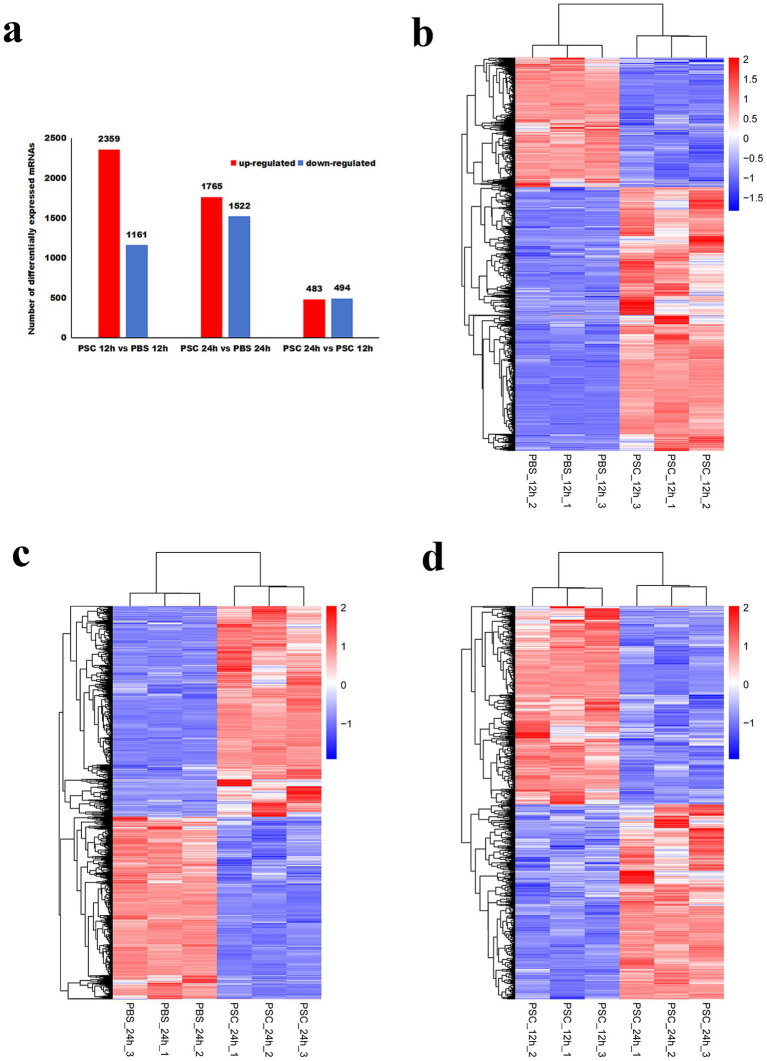
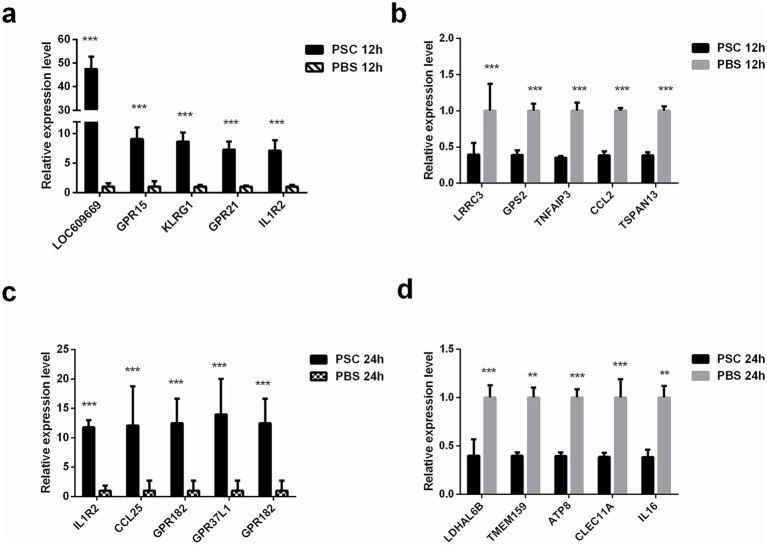
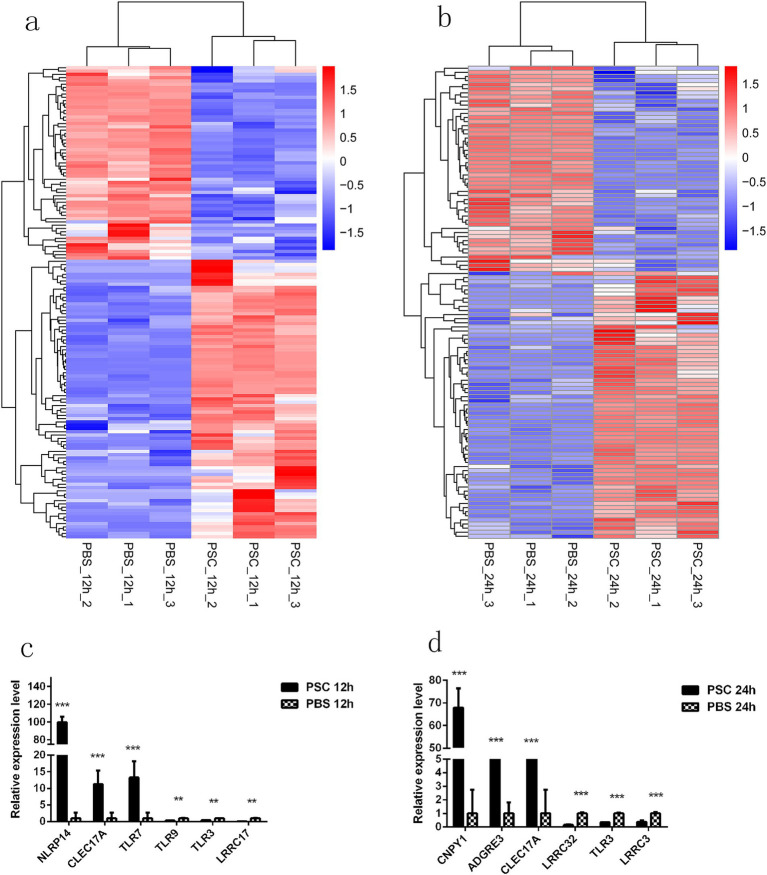
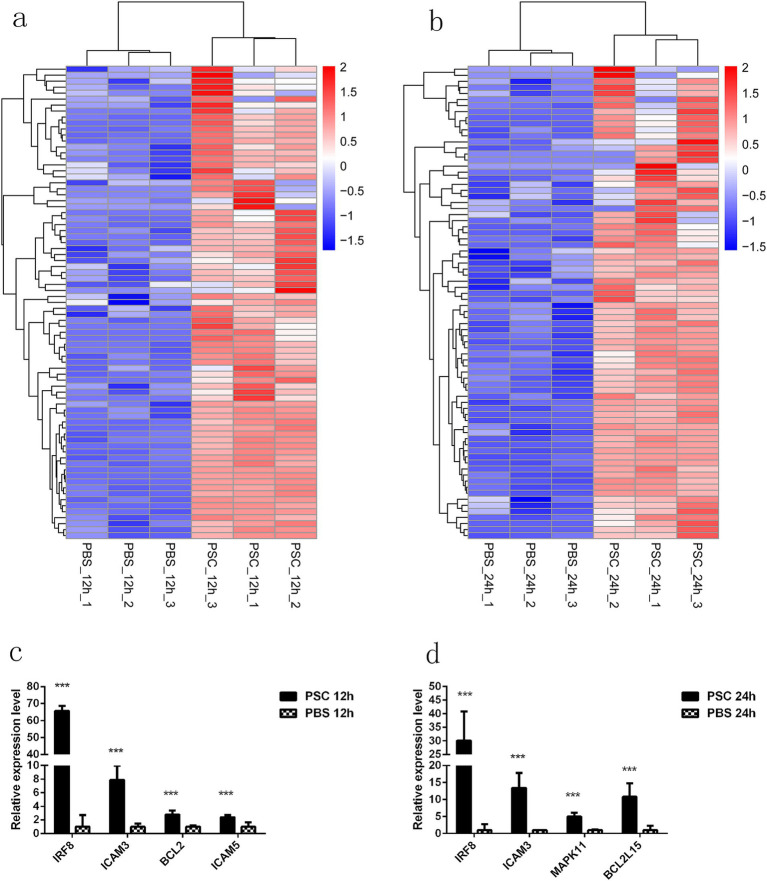
Results: RNA-seq analysis identified 78,206,492-90,548,214 clean reads in 12 RNA samples. This included six samples stimulated with PSCs for 12 h (PSC1_12h-PSC3_12h) and 24 h (PSC1_24h-PSC3_24h) and six corresponding control samples (PBS1_12h-PBS3_12h and PBS1_24h-PBS3_24h). In the PSC_12h vs. PBS_12h and PSC_24h vs. PBS_24h groups, 3,520 (2,359 upregulated and 1,161 downregulated) and 3,287 (1765 upregulated and 1,522 downregulated) DEgenes were identified, respectively. The expression of 45 PRRs genes was upregulated in the PSC_12h and PSC_24h groups compared to those in the control groups, including 4 Toll-like receptors (TLRs), 4C-type lectin receptors (CLRs), 3 NOD-like receptors (NLRs), 17 G protein-coupled receptors (GPCRs), 4 scavenger receptors (SRs), and 13 leucine-rich repeat-containing proteins (LRRCs). GO enrichment and KEGG analyses revealed that these DEgenes were mainly involved in the regulation of host immune response processes and molecules. These included antigen processing and presentation, Th17, PI3K-Akt, Th1, and Th2 cell differentiation, neutrophil extracellular trap formation, NOD- and Toll-like receptors, TNF, intestinal immune network for IgA production and IL-17 signaling pathway. Furthermore, the identified DEgenes were involved in the regulation of signaling molecules and interaction (e.g., cell adhesion molecules and ECM-receptor interaction).
Conclusion: These preliminary findings provide novel perspectives on the host innate immune response to E. granulosus PSC stimulation, with a focus on the involvement of E. granulosus-specific PRRs in host defense mechanisms against infection.
Keywords: Echinococcus granulosus; RNA sequencing; definitive host; innate immunity; pattern recognition receptors.
Copyright © 2024 Wang, Pu, Zhao, Chen, Zhang, Sun and Bo.
Conflict of interest statement
The authors declare that the research was conducted in the absence of any commercial or financial relationships that could be construed as a potential conflict of interest.
Figures
References
-
- Thompson RCA. Biology and systematics of echinococcus In: The biology of echinococcus and hydatid disease. Crows Nest, NSW: George Allen & Unwin; (1986). 5–43.
LinkOut - more resources
Full Text Sources
Miscellaneous