. 2025 Feb;12(6):e2412593.
doi: 10.1002/advs.202412593. Epub 2024 Dec 16.

Susceptibility of Mitophagy-Deficient Tumors to Ferroptosis Induction by Relieving the Suppression of Lipid Peroxidation

Affiliations

Susceptibility of Mitophagy-Deficient Tumors to Ferroptosis Induction by Relieving the Suppression of Lipid Peroxidation

Shan Liu et al. Adv Sci (Weinh). 2025 Feb.

Abstract

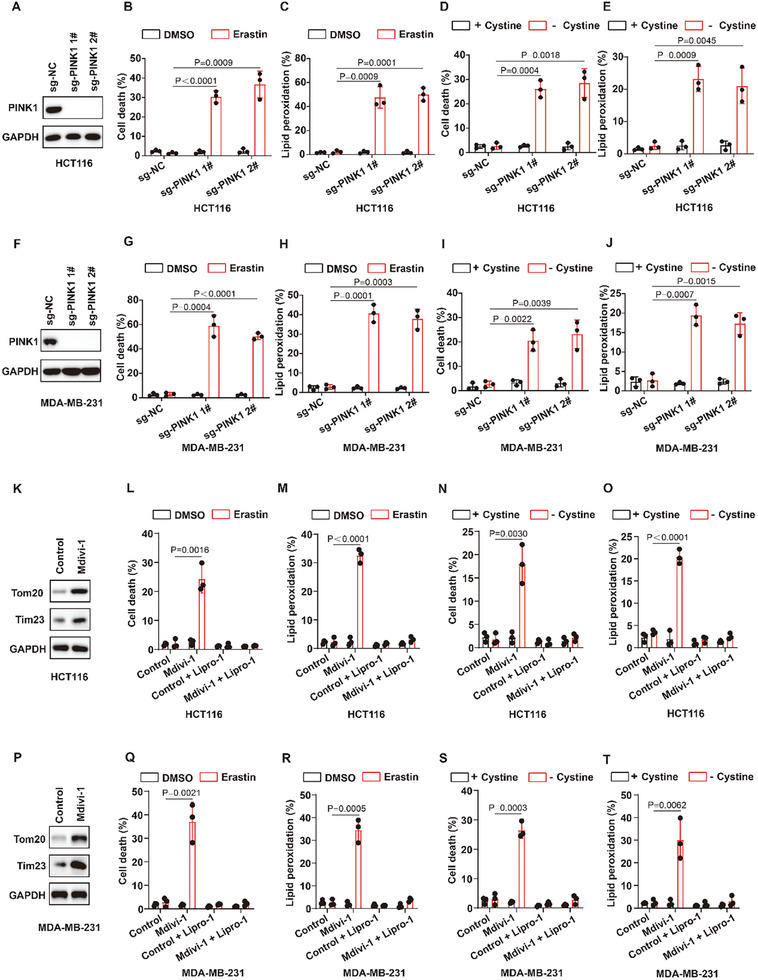
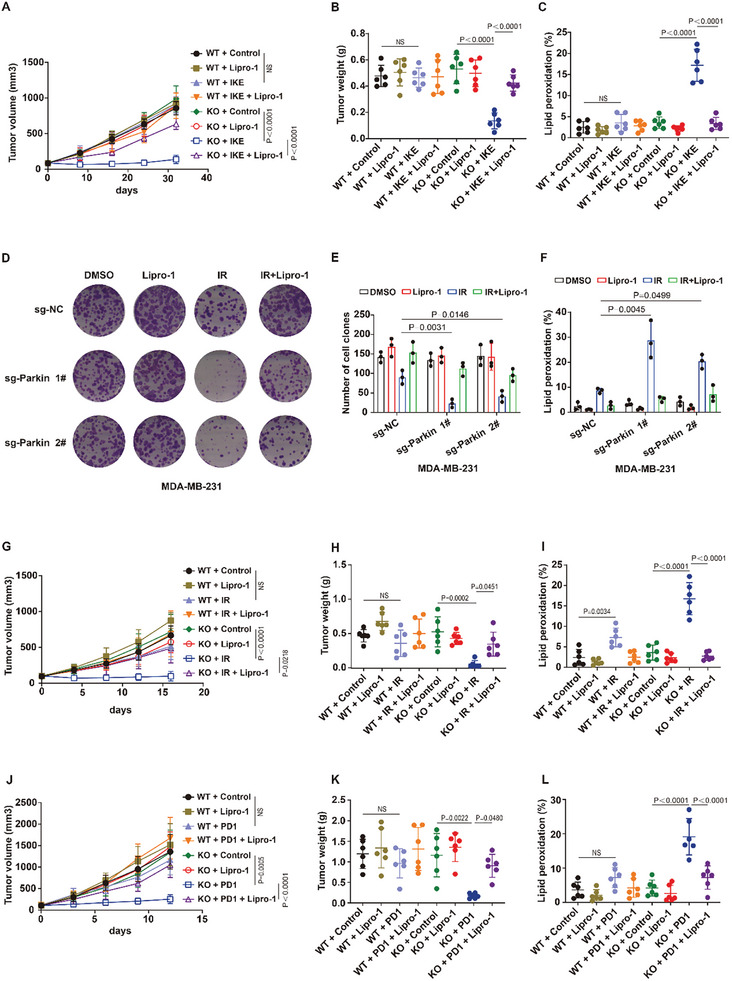
The identification of ferroptosis-sensitive cancers is critical for the application of ferroptosis-inducing therapies in cancer therapy. Here, patient-derived organoid screening models of colorectal cancer are established to identify tumors that are sensitive to ferroptosis-inducing therapy. This study discovers that patient-derived tumors characterized by mitophagy deficiency are hypersensitive to ferroptosis-inducing therapies. Mechanistically, a novel negative feedback regulatory pathway of lipid peroxidation is identified, which is one of the important intrinsic anti-ferroptosis mechanisms of cancer cells. Lipid peroxidation-mediated endoplasmic reticulum stress transcriptionally upregulates Parkin to promote mitophagy through ATF4. Mitophagy limits the generation of lipid peroxidation products and subsequently inhibits ferroptosis by inhibiting the accumulation of mitochondrial ROS. Mitophagy-deficient tumors lack this anti-ferroptotic mechanism, unleashing the generation of lipid peroxidation and potent ferroptotic cell death induced by erastin, RSL3, cysteine deprivation, radiotherapy, and immunotherapy. More importantly, ferroptosis-inducing therapy selectively inhibits the growth and distant metastasis of mitophagy-deficient tumors in vivo. In summary, patient-derived organoids of colorectal cancer patients for screening ferroptosis-sensitive tumors are established, providing a paradigm for identifying that patient-derived tumors are sensitive to ferroptosis-inducing therapies. This study concludes that mitophagy-deficient tumors are vulnerable to ferroptosis induction, which may lead to the development of new therapeutic strategies for tumors deficient in mitophagy.

Keywords: ferroptosis; lipid peroxidation; mitophagy‐deficient tumors; parkin.


Conflict of interest statement

The authors declare no conflict of interest.

Figures

Figure 1
Figure 1
Mitophagy‐deficient colorectal cancer patients derived organoids (CRC PDOs) are sensitive to ferroptosis inducers. A) Relative survival rate in the indicated PDOs treated with imidazole ketone erastin (IKE). B) The enrichment analysis of pathways downregulated in the ferroptosis‐susceptible group compared to the ferroptosis‐resistant group. The Benjamini–Hochberg (BH) procedure was used with one‐sided P values adjusted for multiple testing. C) GSEA (Reactome) of mitophagy pathway. The BH procedure was used with two‐sided P values adjusted for multiple testing. D) Heat map of mitophagy pathway genes in ferroptosis‐susceptible PDOs and the ferroptosis‐resistant PDOs. E,F) Relationship between Parkin (E) or PINK1 (F) expression and sensitivity to ferroptosis inducer erastin in 207 cancer cell lines of different cancer types. G,L) Immunoblot showing the expression of Parkin in the indicated HCT116 cells (G) or MDA‐MB‐231 cells (L). H–K) Cell death and lipid peroxidation measurement in the indicated HCT116 cells treated with 12 µm erastin for 26 h (H,I) or cystine deprivation for 19 h (J,K). M–P) Cell death and lipid peroxidation measurement in the indicated MDA‐MB‐231 cells treated with 2 µm erastin for 12 h (M,N) or cystine deprivation for 7 h (O,P). (A) Data are the mean ± s.d.; n =  3 biologically independent experiments., Statistical analysis was performed using a two‐way ANOVA with Tukey's multiple comparisons test. (G,L), Data are representative of n =  3 biologically independent experiments. (H–K,M–P, Data are the mean ± s.d.; n =  3 biologically independent experiments. Statistical analysis was performed using an unpaired two‐tailed Student's t‐test.
Figure 2
Figure 2
Mitophagy‐deficient cancer cells are sensitive to ferroptosis inducers. A,F) Immunoblot showing the expression of PINK1 in the indicated HCT116 cells (A) or MDA‐MB‐231 cells (F). B–E) Cell death and lipid peroxidation measurement in the indicated HCT116 cells treated with 12 µm erastin for 26 h (B,C) or cystine deprivation for 19 h (D,E). G–J) Cell death and lipid peroxidation measurement in the indicated MDA‐MB‐231 cells treated with 2 µm erastin for 12 h (G, H) or cystine deprivation for 7 h (I,J). K) Immunoblot showing the expression of Tom20 or Tim23 in HCT116 cells treated with control or mitophagy inbibitor 10 µm Mdivi‐1 for 18 h. (L‐O) Cell death and lipid peroxidation measurement in the indicated HCT116 cells treated with 12 µm erastin for 26 h (L,M) or cystine deprivation for 19 h (N,O) with or or without 10 µm Mdivi‐1 or 10 µm Lipro‐1. P) Immunoblot showing the expression of Tom20 or Tim23 in MDA‐MB‐231 cells treated with control or 10 µm Mdivi‐1 for 12 h. Q–T) Cell death and lipid peroxidation measurement in the indicated MDA‐MB‐231 cells treated with 2 µm erastin for 12 h (Q, R) or cystine deprivation for 7 h (S,T) with or or without 10 µm Mdivi‐1 or 10 µm Lipro‐1. (A,F,K,P) Data are representative of n =  3 biologically independent experiments. (B–E,G–J,L–O,Q–T, Data are the mean ± s.d.; n =  3 biologically independent experiments. Statistical analysis was performed using an unpaired two‐tailed Student's t‐test.
Figure 3
Figure 3
Mitophagy is enhanced during the ferroptotic process in cancer cells. A) Immunoblot showing the expression of Tom20 or Tim23 in HCT116 cells treated with erastin at the indicated concentrations and times. Left, time, 28h. Right, concentration, 16 µm. B) The relative mitochondrial DNA (mtDNA) measurement in HCT116 cells treated with erastin at the indicated concentrations and times. Left, time, 28h. Right, concentration, 16 µm. C) Immunoblot showing the expression of mitophagy‐related proteins in HCT116 cells treated with erastin at the indicated concentrations and times. Left, time, 28h. Right, concentration, 16 µm. D) QPCR showing the expression of Parkin mRNA in HCT116 cells treated with erastin at the indicated concentrations and times. Left, time, 28h. Right, concentration, 16 µm. E) Parkin mRNA measurement in the indicated HCT116 cells treated with 16 µm erastin for 22h. F) Parkin mRNA measurement in control HCT116 cells (sg‐NC) and ATF4 knockout HCT116 cells (sg‐ATF4 1# or sg‐ATF4 2#) treated with DMSO or 16 µm erastin for 22h. G) Immunoblot showing the expression of Parkin in control HCT116 cells (sg‐NC) and ATF4 knockout HCT116 cells (sg‐ATF4 1# or sg‐ATF4 2#) treated with DMSO or 16 µm erastin for 22h. H) Parkin mRNA was measured in control HCT116 cells (Vector) and ATF4‐overexpressing HCT116 cells (ATF4). I) Immunoblot showing the expression of Parkin in control HCT116 cells (Vector) and ATF4‐overexpressing HCT116 cells (ATF4). J,K) Control HCT116 cells (sg‐NC) and ATF4 knockout HCT116 cells (sg‐ATF4 1# or sg‐ATF4 2#) were transfected with Parkin‐promoter firefly luciferase reporter construct and a constitutive‐active Renilla luciferase reporter construct (pRL‐CMV), and then treated with 16 µm erastin for 22 h (J) or cystine deprivation for 16 h (K). Relative luciferase activity was measured using the Dual‐Luciferase Reporter Assay Kit (Promega E1980). L,M) Binding of ATF4 to a DNA fragment containing the CREB/ATF motif in the Parkin promoter. ChIP was performed on HCT116 (L) or MDA‐MB‐231 (M) cell lysate with antibodies against ATF4 and rabbit IgG as control. DNA fragments were amplified using the primers specific for CREB/ATF binding motif in the Parkin promoter region. The non‐coding region NC1 served as negative control. A, C, G, I, Data are representative of n =  3 biologically independent experiments. (B,D–F,H,J,K, Data are the mean ± s.d.; n =  3 biologically independent experiments. Statistical analysis was performed using an unpaired two‐tailed Student's t‐test.
Figure 4
Figure 4
Lipid peroxidation‐ATF4‐Parkin‐mitophagy negative feedback pathway limits lipid peroxidation to halt ferroptosis in cancer. A–D) Immunoblot showing the expression of Parkin, ATF4, p‐PERK, eIF2α in HCT116 or MDA‐MB‐231 cells treated with erastin with or without 10 µm ferroptosis inhibitor ferrostatin‐1 (Fer‐1) at the indicated concentrations and times. A, time, 30 h. (B) concentration, 16 µm. C, time, 14 h. (D) concentration, 5 µm. (E–H) Mitochondrial ROS (mitoROS), lipid peroxidation (lipidROS), cell death measurement in HCT116 cells treated with 20 µm erastin for the indicated times (E,G) or in MDA‐MB‐231 cells treated with 3 µm erastin for the indicated times (F,H). (A–D) Data are representative of n =  3 biologically independent experiments.
Figure 5
Figure 5
Mitophagy‐deficient tumor growth is vulnerable to ferroptosis. A,B) HCT116 cells were subcutaneously inoculated into BALB/c‐nu nude mice. Mice were randomly assigned to different treatment groups 10 days after tumor inoculation. Imidazole ketone erastin (IKE) was injected intraperitoneally into mice at a dose of 30 mg kg−1 every other day for 30 days. Lipro‐1 was administered three times before IKE followed by continued every other day administration at a dose of 15 mg kg−1 for 30 days. Tumor volumes (A) and tumor weights (B) of HCT116 xenograft tumors with the indicated treatments. C) Relative lipid peroxidation in tumor cells isolated from the indicated tumors. D–F) Cell clones (D,E) and lipid peroxidation (F) measurement in the indicated MDA‐MB‐231 cells treated with the indicated compounds or IR. Cell clones: IR, 2 Gy; lipro‐1, 5 µm. Lipid peroxidation: IR, 6 Gy; lipro‐1, 5 µm. G) MDA‐MB‐231 cells were subcutaneously inoculated into BALB/c‐nu nude mice. Mice were randomly assigned to different treatment groups 7 days after tumor inoculation. Tumors were irradiated with a JL Shepherd Mark I‐68A irradiator at a dose of 10 Gy. Lipro‐1 was administered three times before irradiation followed by continued once daily administration for 15 days. Volumes of MDA‐MB‐231 xenograft tumors with the indicated treatments at different time points (days). H) Tumor weights of MDA‐MB‐231 xenograft tumors with the indicated treatments after exposure to 10 Gy of IR. (I) Relative lipid peroxidation in tumor cells isolated from the indicated tumors. J) B16 cells were subcutaneously inoculated into C57 mice. On day 3, 100 µg anti‐PD1 (Bio X Cell), 15 mg kg−1 Lipro‐1 or both were administered intraperitoneally to each mouse. Antibodies were administered every 3 days and Lipro‐1 was administered three times before anti‐PD1 treatment followed by continued daily administration until the endpoint. Volumes of B16 tumors with the indicated treatments at different time points (days). K) Tumor weights of B16 tumors with the indicated treatments. (L) Relative lipid peroxidation in tumor cells isolated from the indicated tumors. A, G, J, Error bars are means ± SD, n = 6 independent repeats. P values were determined using 2‐way ANOVA. B‐F, H, I, K, L, Data are the mean ± s.d.; n =  6 biologically independent mice. Statistical analysis was performed using an unpaired two‐tailed Student's t‐test.
Figure 6
Figure 6
Mitophagy‐deficient tumor metastasis is vulnerable to ferroptosis. A,B) Mice were intracardiacally injected with wild‐type HCT116 or mitophagy‐deficient HCT116 cancer cells, then treated with control or IKE or Lipro‐1 or IKE and Lipro‐1. IKE was injected intraperitoneally into mice at a dose of 30 mg kg−1 once daily for 16 days starting from the day after cardiac injection of cancer cells. Lipro‐1 was administered three times before IKE treatment followed by continued daily administration at a dose of 15 mg kg−1 for 16 days starting from the day after cardiac injection of cancer cells. The relative bone metastasis burden of each group of mice was measured. C,D) Mice were tail‐vein injected with wild‐type HCT116 or mitophagy‐deficient HCT116 cancer cells, then treated with control or IKE or Lipro‐1 or IKE and Lipro‐1. IKE was injected intraperitoneally into mice at a dose of 30 mg kg−1 every other day for 36 days starting from the day after tail vein injection of cancer cells. Lipro‐1 was administered three times before IKE treatment followed by continued every other day administration at a dose of 15 mg kg−1 for 36 days starting from the day after tail vein injection of cancer cells. The relative lung metastasis burden of each group of mice was measured. E,F) Survival time of the indicated bone metastasis mice (E) or lung metastasis mice (F) treated with control or IKE or Lipro‐1 or IKE and Lipro‐1. G–J) Mice were injected intrasplenicly with wild‐type HCT116 or mitophagy‐deficient HCT116 cancer cells, then treated with control or IKE or Lipro‐1 or IKE and Lipro‐1. IKE was injected intraperitoneally into mice at a dose of 30 mg kg−1 every other day for 40 days starting from the day after the spleen injection of cancer cells. Lipro‐1 was administered three times before IKE treatment followed by continued every other day administration at a dose of 15 mg kg−1 for 40 days. The liver nodules (G,H), liver weight (I), liver/body weight ratio (J) in the indicated mice was measured. (A‐J) Data are the mean ± s.d.; n =  6 biologically independent mice. Statistical analysis was performed using an unpaired two‐tailed Student's t‐test.
Figure 7
Figure 7
Proposed model of the susceptibility of mitophagy‐deficient tumors to ferroptosis induction. (Left), During the ferroptotic process in cancer cells, lipid peroxidation‐mediated endoplasmic reticulum stress (ER stress) activates ATF4, and then ATF4 transcriptionally upregulates Parkin to promote mitophagy. Mitophagy reduces the production and accumulation of mitochondrial ROS (mitoROS), thereby limiting the generation of lipid peroxidation and the occurrence of ferroptosis. (Right), In cancer cells with defective mitophagy, the large amount of mitochondrial ROS (mitoROS) produced leads to the release of the restriction on the generation of lipid peroxidation, which makes the cancer cells or tumors susceptible to ferroptosis, and unleashes the generation of lipid peroxidation and potent ferroptotic cell death induced by erastin, IKE, cysteine deprivation (‐cys), radiotherapy (IR) and immunotherapy.

References

    1. Stockwell B. R., Cell 2022, 185, 2401. - PMC - PubMed
    1. Zhang H. L., Hu B. X., Li Z. L., Du T., Shan J. L., Ye Z. P., Peng X. D., Li X., Huang Y., Zhu X. Y., Chen Y. H., Feng G. K., Yang D., Deng R., Zhu X. F., Nat. Cell Biol. 2022, 24, 88. - PubMed
    1. Zhang H. L., Hu B. X., Ye Z. P., Li Z. L., Liu S., Zhong W. Q., Du T., Yang D., Mai J., Li L. C., Chen Y. H., Zhu X. Y., Li X., Feng G. K., Zhu X. F., Deng R., Sci. Transl. Med. 2024, 16, eadk0330. - PubMed
    1. Lei G., Zhuang L., Gan B., Nat. Rev. Cancer 2022, 22, 381. - PMC - PubMed
    1. Vlachogiannis G., Hedayat S., Vatsiou A., Jamin Y., Fernandez‐Mateos J., Khan K., Lampis A., Eason K., Huntingford I., Burke R., Rata M., Koh D. M., Tunariu N., Collins D., Hulkki‐Wilson S., Ragulan C., Spiteri I., Moorcraft S. Y., Chau I., Rao S., Watkins D., Fotiadis N., Bali M., Darvish‐Damavandi M., Lote H., Eltahir Z., Smyth E. C., Begum R., Clarke P. A., Hahne J. C., et al., Science 2018, 359, 920. - PMC - PubMed

Substances

LinkOut - more resources