[Preprint]. 2024 Dec 4:2024.12.04.626802.
doi: 10.1101/2024.12.04.626802.

Loss of Pigment Epithelium Derived Factor Sensitizes C57BL/6J Mice to Light-Induced Retinal Damage

Affiliations

Loss of Pigment Epithelium Derived Factor Sensitizes C57BL/6J Mice to Light-Induced Retinal Damage

Debresha A Shelton et al. bioRxiv. .

Abstract

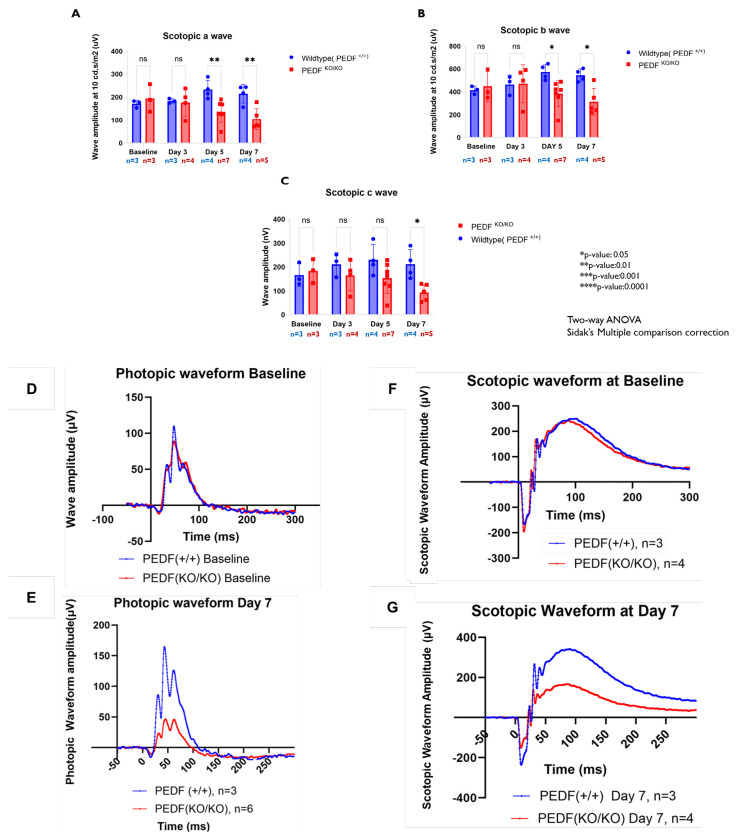
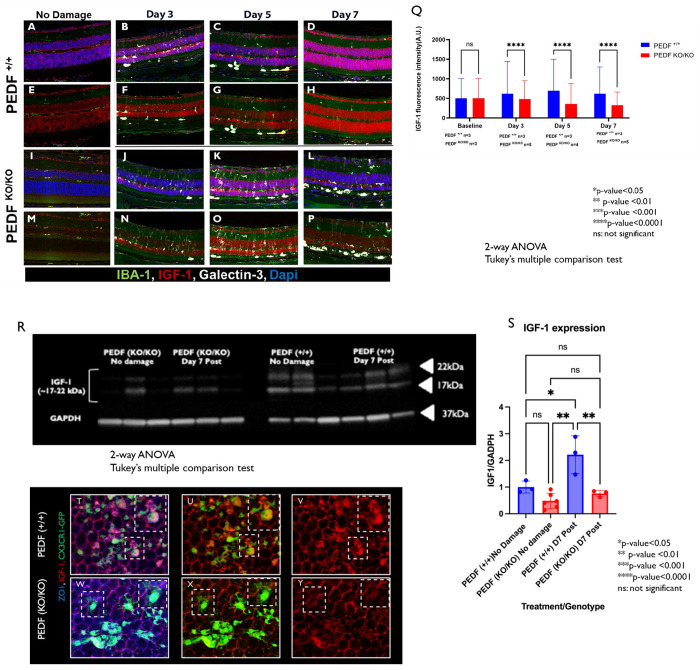
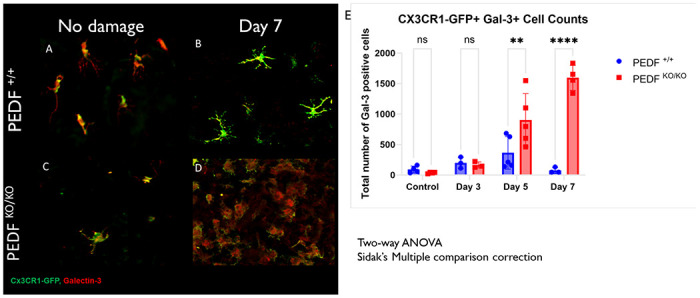
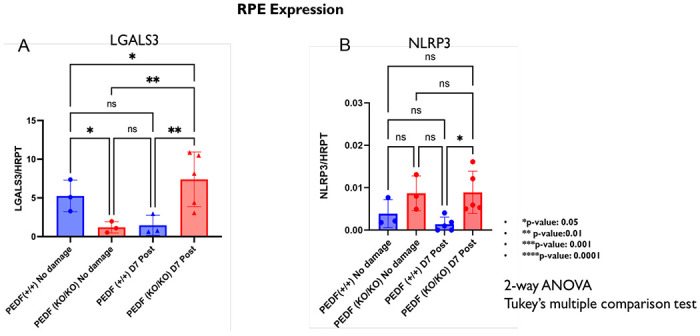
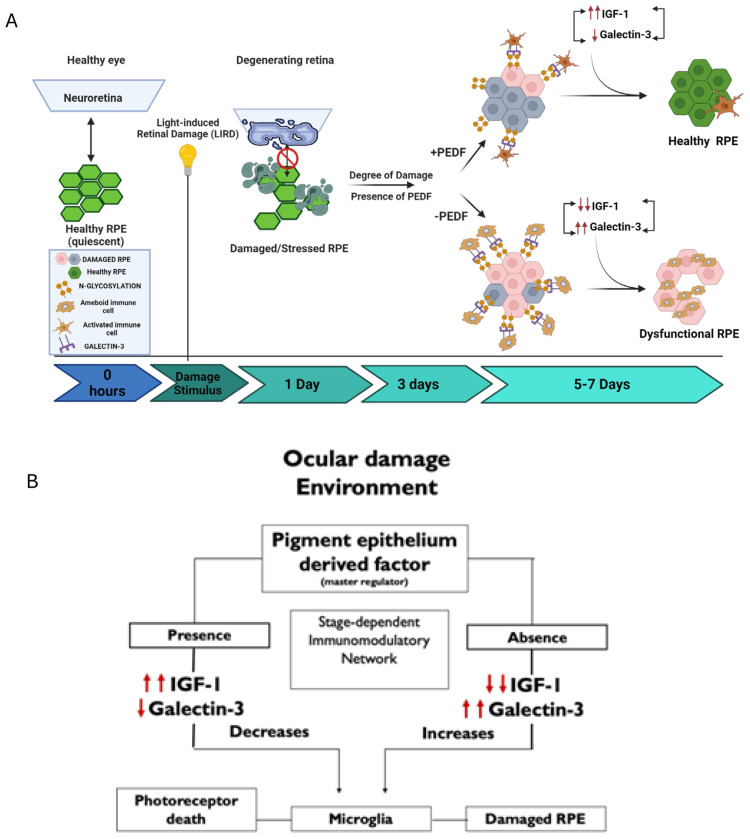
Purpose: Pigment epithelium-derived factor (PEDF) is a neurotrophic glycoprotein secreted by the retinal pigment epithelium (RPE) that supports retinal photoreceptor health. Deficits in PEDF are associated with increased inflammation and retinal degeneration in aging and diabetic retinopathy. We hypothesized that light-induced stress in C57BL/6J mice deficient in PEDF would lead to increased retinal neuronal and RPE defects, impaired expression of neurotrophic factor Insulin-like growth factor 1 (IGF-1), and overactivation of Galectin-3-mediated inflammatory signaling.

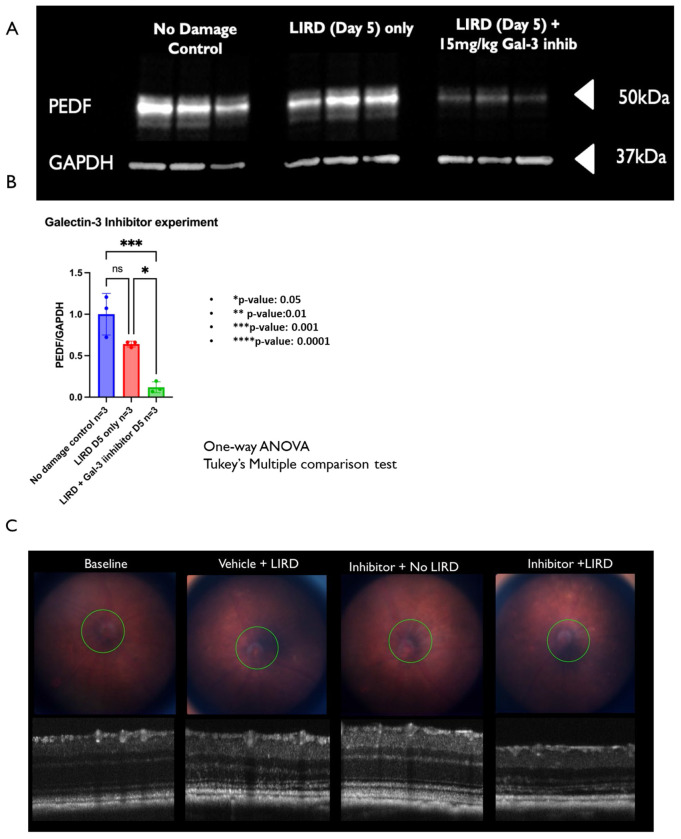
Methods: C57BL/6J mice expressing the RPE65 M450/M450 allele were crossed to PEDF KO/KO and wildtype (PEDF +/+) littermates. Mice were exposed to 50,000 lux light for 5 hours to initiate acute damage. Changes in visual function outcomes were tracked via electroretinogram (ERG), confocal scanning laser ophthalmoscopy(cSLO), and spectral domain optical coherence tomography (SD-OCT) on days 3, 5, and 7 post-light exposure. Gene and protein expression of Galectin-3 were measured by digital drop PCR (ddPCR) and western blot. To further investigate the role of galectin-3 on visual outcomes and PEDF expression after damage, we also used a small-molecule inhibitor to reduce its activity.

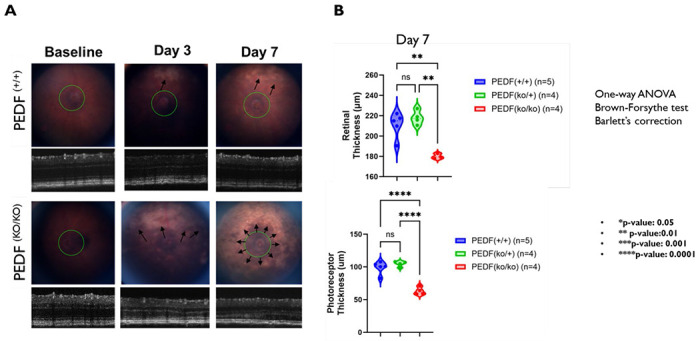
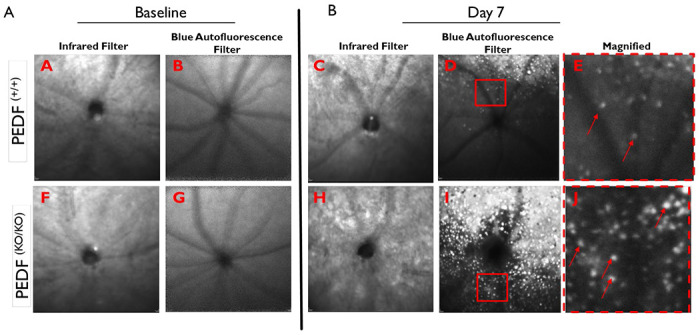
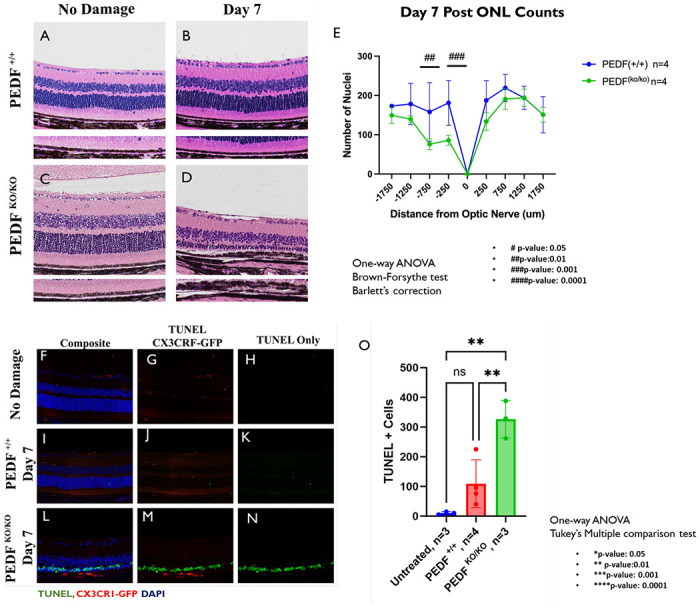
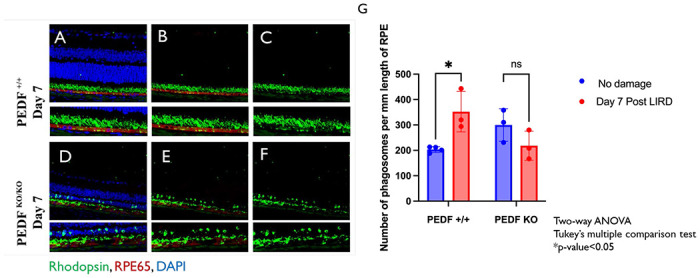
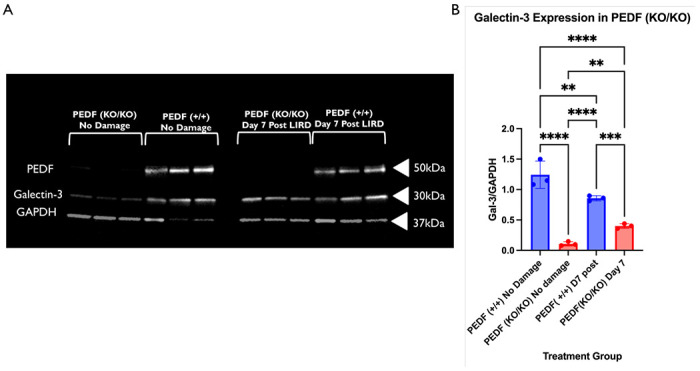
Results: Following light damage, PEDF KO/KO mice showed more severe retinal thinning, impaired visual function (reduced a-, b-, and c-wave amplitudes), and increased Galectin-3 expressing immune cell infiltration compared to PEDF +/+. PEDF KO/KO mice had suppressed damage-associated increases in IGF-1 expression. Additionally, baseline Galectin-3 mRNA and protein expression were reduced in PEDF KO/KO mice compared to PEDF +/+. However, after light damage, Galectin-3 expression decreases in PEDF +/+ mice but increases in PEDF KO/KO mice without reaching PEDF +/+ levels. Galectin-3 inhibition worsens retinal degeneration, reduces PEDF expression in PEDF +/+ mice, and mimics the effects seen in PEDF knockouts.

Conclusions: Loss of PEDF alone does not elicit functional defects in C57BL/6J mice. However, under light stress, PEDF deficiency significantly increases severe retinal degeneration, visual deficits, Galectin-3 expression, and suppression of IGF-1 than PEDF +/+. PEDF deficiency reduced baseline expression of Galectin-3, and pharmacological inhibition of Galectin-3 worsens outcomes and suppresses PEDF expression in PEDF +/+, suggesting a novel co-regulatory relationship between the two proteins in mitigating light-induced retinal damage.


Figures

Figure 1:
Figure 1:. Loss of Pigment Epithelium Derived Factor Modifies Sensitivity to Phototoxic Damage in C57BL/6J Animals
Fundus and retinal C57BL/6J animals that express wild-type PEDF (PEDF +/+) or PEDF knockout (PEDF KO/KO) animals are shown. Figure 1A shows Spectral Domain Optical Coherence Tomography (SD-OCT) images of the Fundus and circular B-scans of the retinal architecture around the optic nerve. Top row: PEDF +/+ animals are shown in the top row at both baselines and on day seven post-LIRD. Bottom row: PEDF KO/KO animals at baseline and Day 7 Post LIRD. White arrows denote regions of damage-associated mottling of the fundus. Figure 1B shows the quantification of total retinal thickness and the thickness of the photoreceptor layer of PEDF +/+ n=5, PEDF KO/+ n=4, PEDF KO/KO= n=4 at Day 7 Post LIRD. One-way ANOVA Brown-Forsythe test with Barlett’s correction. * p-value< 0.05, ** p-value<0.01, *** p-value<0.001, **** p-value<0.0001.
Figure 2:
Figure 2:. Loss of PEDF Increases Damaged-Associated Autofluorescent Dots at the Level of the RPE
Heidelberg Spectralis cSLO (confocal scanning laser ophthalmoscope) images show an increased accumulation of autofluorescent dots/granules at the level of the photoreceptor-RPE interface after phototoxic damage that is not present at baseline. Images were taken at −12 diopters at the level of the interdigitations of RPE and photoreceptors using both the infrared (to detect vascular architecture) and the blue autofluorescence filter (to detect fluorescent dots). Representative Images at baseline for PEDF +/+(2A-B) and PEDF KO/KO (2F-G) and at Day 7 Post LIRD (PEDF +/+: 2C-E; PEDF KO/KO: 2H-J). A Zoom (red box) of each representative image with red arrows highlighting individual dots.
Figure 3:
Figure 3:. Loss of PEDF Results in Regional Damage and Increases Apoptosis of Photoreceptor Cells.
The morphology of the postmortem tissue shows significant regional alterations in retinal architecture. Figure 3A–B shows a representative image of PEDF +/+ with no damage and day seven post-LIRD. Representative images of PEDF KO/KO animals with no damage(Figure 2C) and day seven post-damage (Figure 2D) are shown. Figure 2D shows severe loss of the outer nuclear layer (ONL), disruption of the photoreceptor inner and outer segment layer, and aberrations in the RPE monolayer in PEDF KO/KO compared to PEDF +/+ controls at day five post-light damage. Figure 3E quantifies ONL counts from −1750 microns(superior) to 1750 microns (inferior) on either side of the optic nerve. The damage is regionally isolated to the superior portion of the retina and is significantly between PEDF KO/KO n=4 and PEDF +/+ n=4. One-way ANOVA with Brown-Forsythe test and Barlett’s correction. # p-value<0.05, ## p-value<0.01, ### p-value<0.001, #### p-value <0.0001. The loss trend was the same on day seven post-LIRD (data not shown). Figure 3F–N shows representative images of retinal sections stained for TUNEL (green), immune cells via CX3CR1-GFP (red), and cell nuclei (DAPI) of no damage control (3F-H), Day 7 PEDF +/+(3I-K) and, Day 7 PEDF KO/KO (3L-N). These data are quantified in Figure 3O and show that PEDF KO/KO have significantly more TUNEL-positive cells than either the untreated (** p-value<0.01) or the PEDF +/+ (** p-value<0.01) group.
Figure 4:
Figure 4:. PEDF KO/KO RPE Fail to Increase Rhodopsin Metabolism after Light Damage
Loss of PEDF results in a suboptimal production of phagosomes by the RPE after light-induced retinal damage. Figure 4A–F shows representative retinal immunofluorescence images of a PEDF +/+ and PEDF KO/KO at day 7 Post-light damage. The sections were stained with Rhodopsin(green) to visualize shed rod outer segments and phagosomes, Best1(red) was used to visualize the RPE monolayer, and cell nuclei were stained with DAPI (blue). Figure 4G, notably, the PEDF +/+ animals significantly increase production to redress clearance demands at day seven post-LIRD compared to untreated PEDF+/+(Two-way ANOVA, Tukey’s multiple comparison test, *p-value<0.05). However, while PEDF KO/KO animals had a more significant accumulation of phagosomes at baseline, they failed to increase phagosome production after light damage.
Figure 5
Figure 5. The Loss of PEDF leads to significant deficits in visual function after light damage exposure.
The figure shows the maximal visual output of a-wave, b-wave, and c-wave at a flash intensity of 10 candelas/second/meters2 (cd.s/m2). These data show no statistically significant difference in the visual function of the PEDF KO/KO compared to PEDF +/+ at baseline or on day three after light damage. However, after day three there is a notable decrease in visual function of PEDF KO/KO animals in both a- and b-wave amplitudes at 10Hz that persists to day 7(a-wave: day 5: ** p-value<0.01; day 7: ** p-value<0.01 and b-wave: day 5: *p-value <0.05; day 7: *p-value<0.05. n=3-7/time point/group) see Figure 5A and 5B; Two-way ANOVA with Sidak’s multiple comparison correction). Significant loss of the c-wave amplitudes is delayed to day seven post-light damage (See Fig. 2C: Two-way ANOVA with Sidak’s multiple comparison corrections, day 7: * p-value<0.01). The scotopic waveforms of PEDF KO/KO mice also reveal a slight depression in the waveform amplitude at baseline compared to PEDF +/+ (n=3-4/genotype). This reduction in waveform amplitude is more pronounced at day seven post-LIRD (n=5/genotype; See Figures 5D and 5E). Photopic waveforms show a similar trend as scotopic waveforms with significantly reduced amplitudes in PEDF KO/KO at day 7 compared to PEDF +/+ littermates (See Fig. 5F–G).
Figure 6:
Figure 6:. Loss of PEDF Suppresses the Damage-Associated Increase in IGF-1 after Light Damage
Retinal sections were collected at days 3, 5, and 7 post light damage and stained for the neurotrophic factor, IGF-1(red), the immune cell marker, IBA1(green), immune cell activation marker, Galectin-3(white), and dapi(blue). Staining showed that at baseline, there was no significant difference between PEDF +/+ and PEDF KO/KO animals without damage. Figure 6A–P is a representative image showing the degree of expression of IGF-1 and Galectin-3 and the infiltration of immune cells from the retina to the subretinal space. After light damage, there is an increase in Galectin-3 positive cell expression in both genotypes at day 3, with the earliest deposition at the photoreceptor-RPE interface occurring at day 3. By day 7, only the PEDF KO/KO animals still have Galectin-3 positive cells at the interface of the photoreceptors-RPE. Additionally, when quantifying the immunofluorescent signal of IGF-1, there are statically significant differences between the PEDF +/+ and PEDF KO/KO as early as day 3. The levels of IGF-1 continue to decrease until day seven post LIRD (see Fig. 6Q). Analysis: Two-way ANOVA with Tukey’s multiple comparison test, n=3-5/ group/time point. * p-value< 0.05, ** p-value<0.01, *** p-value<0.001, **** p-value<0.0001. In Figure 6R, we confirm this finding via total eye cup expression of IGF-1 normalized to GAPDH in no damage controls versus at day seven post-LIRD via western blot. Figure 6R quantifies the total expression of IGF-1 between PEDF +/+ and PEDF KO/KO before and after LIRD. Analysis: Two-way ANOVA with Tukey’s multiple comparison test, n=3-6/group/timepoint. Subretinal immune cells recruited to RPE in PEDF KO/KO have lower expression of IGF-1 than PEDF +/+ animals. Figure 6T–Y shows a representative image of PEDF +/+( 6T-V) and PEDF KO/KO (6W-Y) stained for ZO1(blue), IGF-1(red), and CX3CR1-GFP (green) to look for heterogeneity in the immune cell population.
Figure 7:
Figure 7:. Loss of PEDF increases infiltration of galectin-3+ immune cells compared to PEDF +/+
We collected RPE flat mounts to assess if PEDF KO/KO animals showed an increased inflammatory profile and stained them for Galectin-3 (red) and CX3CR1-GFP(Green). We found that PEDF KO/KO animals were like PEDF +/+ animals at baseline and up to day three post-LIRD damage. However, by day 5, there was the inflammation phenotype significantly increased in PEDF KO/KO animals compared to littermate controls * p-value< 0.05, ** p-value<0.01, *** p-value<0.001, **** p-value<0.0001 (Analysis: Two-way ANOVA with sidak’s multiple comparison correction. N=3-5 animals group/ time point. p-value: Day 5: ** vs Day 7 **). Figure 7A–D shows a representative image of the subretinal immune cell morphology in PEDF +/+ and PEDF KO/KO animals at baseline and Day 7. Figure 7E shows the total number of Gal-3 positive cells counted from baseline to day seven post-LIRD between PEDF +/+ and PEDF KO/KO
Figure 8:
Figure 8:. Loss of PEDF Increases Galectin-3 Gene Expression at Day 7 Post LIRD Compared to Wildtype Littermates
Retinal and RPE tissues were collected separately, and RNA was extracted from each tissue sample type. Figure 9A quantifies Lgals3 and Nlrp3 gene expression normalized to HRPT in the retina between PEDF +/+ and PEDF KO/KO at baseline and Day 7 Post LIRD. Figure 9A–B shows the gene expression of Lgals3 and Nlrp3 at the same time points in the RPE. The Lgals3 expression in the RPE Two-way ANOVA; PEDF KO/KO baseline vs. PEDF KO/KO Day 7: *p-value<0.05; PEDF +/+ Day 7 vs. PEDF KO/KO Day 7: *p-value<0.05. However, only at day 7 in the RPE is Nlrp3 expression significantly different in the PEDF KO/KO compared to littermate controls(*p-value<0.05).
Figure 9:
Figure 9:. Loss of PEDF Reduces Total Galectin-3 Expression Before and After LIRD
PEDF KO/KO animals have significantly lower expression of Galectin-3 at baseline compared to littermate controls. Additionally, after damage, there is a suboptimal increase in Galectin-3 protein expression on day seven post-LIRD. PEDF +/+ animals dampen galectin-3 expression in response to LIRD damage at day 7, suggesting differential temporal regulation of the protein when PEDF is present compared to when it is not. Figure 9A shows a western blot that was probed for PEDF (50kDa), Galectin-3(~30kDa), and GAPDH (~37kDa) loading control. The results from Figure 9A are quantified in Figure 9B and show that there are significant differences in Galectin-3 expression at both baselines (Two-way ANOVA with Tukey’s multiple comparison correction. **** p-value<0.0001. sample sizes: 3 animals/group/time point) and at Day 7 (****p-value<0.0001) between PEDF KO/KO and PEDF +/+ animals. While Galectin-3 expression increases in the PEDF KO/KO animals at day seven compared to baseline, it is still dampened compared to the Gal-3 expression of PEDF +/+ at the same time point.
Figure 10:
Figure 10:. Treatment with Galectin-3 inhibitor, TD139, significantly decreases PEDF expression in PEDF +/+ animals after LIRD.
Figure 10A shows a western blot exhibiting that PEDF+/+ with no damage controls have high levels of PEDF, and exposing PEDF+/+ animals to LIRD shows a decrease in PEDF levels. Still, it is not significantly different from no-damage controls. However, by adding the galectin-3 inhibitor to LIRD, there is a significant loss of PEDF compared to LIRD, and there is no damage control. 10B is a quantification of 10A. (One-way ANOVA with Tukey’s multiple comparison test. No damage vs. LIRD only (Day 5 post) ns; not significant. No damage vs. LIRD (day 5) + Gal-3 inhibitor ***p-value<0.001. LIRD only (Day 5) vs. LIRD (Day 5) + Gal-3 inhibitor (*p-value<0.0.5). 10C shows representative fundus and retinal images taken using SD-OCT, displaying the effects of TD139 treatment with and without LIRD. Treatment with an inhibitor in conjunction with LIRD significantly increased retinal thinning compared to the control of LIRD only. Note: TD139 treatment alone does not affect visual function Galectin-3 expression levels (Supplemental Figure 1).
Figure 11:
Figure 11:. Schematic of Model Summary
A: Schematic summary illustrating significant differences between PEDF +/+ and PEDF KO/KO animals and the impacts on IGF-1 and Galectin-3 expression. B: Shows the proposed immunomodulatory network influencing photoreceptor death, immune cells, and RPE cells. Images made using Biorender.

Similar articles

References

    1. Jablonski MM, Tombran-Tink J, Mrazek DA, Iannaccone A. Pigment Epithelium-Derived Factor Supports Normal Development of Photoreceptor Neurons and Opsin Expression after Retinal Pigment Epithelium Removal. The Journal of Neuroscience 2000;20:7149. 10.1523/JNEUROSCI.20-19-07149.2000. - DOI - PMC - PubMed
    1. He Y, Leung KW ah, Ren Y, Pei J, Ge J, Tombran-Tink J. PEDF Improves Mitochondrial Function in RPE Cells During Oxidative Stress. Invest Ophthalmol Vis Sci 2014;55:6742– 55. 10.1167/IOVS.14-14696. - DOI - PubMed
    1. Dixit S, Polato F, Samardzija M, Abu-Asab M, Grimm C, Crawford SE, et al. PEDF deficiency increases the susceptibility of rd10 mice to retinal degeneration. Exp Eye Res 2020;198:108121. 10.1016/J.EXER.2020.108121. - DOI - PMC - PubMed
    1. Tombran-Tink J, Mazuruk K, Rodriguez IR, Chung D, Linker T, Englander E, et al. Organization, Evolutionary Conservation, Expression and Unusual Alu Density of the Human Gene for Pigment Epithelium-Derived Factor, a Unique Neurotrophic Serpin. Molecular Vision. 1996. URL: http://www.molvis.org/molvis/v2/a11/ (Accessed 22 July 2024). - PubMed
    1. Raymond SM, Jackson IJ. The retinal pigmented epithelium is required for development and maintenance of the mouse neural retina. Current Biology 1995;5:1286–95. 10.1016/S0960-9822(95)00255-7. - DOI - PubMed

Publication types