. 2024 Dec 16:12:RP90046.
doi: 10.7554/eLife.90046.

A spatial threshold for astrocyte calcium surge

Affiliations

A spatial threshold for astrocyte calcium surge

Justin Lines et al. Elife. .

Abstract

Astrocytes are active cells involved in brain function through the bidirectional communication with neurons, in which astrocyte calcium plays a crucial role. Synaptically evoked calcium increases can be localized to independent subcellular domains or expand to the entire cell, i.e., calcium surge. Because a single astrocyte may contact ~100,000 synapses, the control of the intracellular calcium signal propagation may have relevant consequences on brain function. Yet, the properties governing the spatial dynamics of astrocyte calcium remains poorly defined. Imaging subcellular responses of cortical astrocytes to sensory stimulation in mice, we show that sensory-evoked astrocyte calcium responses originated and remained localized in domains of the astrocytic arborization, but eventually propagated to the entire cell if a spatial threshold of >23% of the arborization being activated was surpassed. Using Itpr2-/- mice, we found that type-2 IP3 receptors were necessary for the generation of astrocyte calcium surge. We finally show using in situ electrophysiological recordings that the spatial threshold of the astrocyte calcium signal consequently determined the gliotransmitter release. Present results reveal a fundamental property of astrocyte physiology, i.e., a spatial threshold for astrocyte calcium propagation, which depends on astrocyte intrinsic properties and governs astrocyte integration of local synaptic activity and subsequent neuromodulation.

Keywords: astrocyte; calcium; cell biology; integration; mouse; neuroscience; synaptic integration.


Conflict of interest statement

JL, AB, CN, EM, JA, PK, MN, AA No competing interests declared

Figures

Figure 1.
Figure 1.. Imaging astrocyte structure and function simultaneously in vivo.
(A) Scheme of in vivo preparation to image astrocyte Ca2+ and structure. (B) Sulforhodamine 101 (SR101)-stained astrocyte structure, GCaMP6 to monitor astrocyte Ca2+ signal, and merge. Scale bar = 50 µm. (C) Regions of interest (ROIs) from SR101-stained structure of somas (blue) and arborizations (red). (D) Ca2+ traces from B from somas (blue) and arborizations (red). Scale = F/Fo, 10 s. (E) SR101-stained astrocyte (left), ROIs outlining soma and arborization (center) and ROIs defining the soma and domains (right). Scale bar = 10 µm. (F) Pseudocolor Ca2+ image during basal (left) and hindpaw electrical stimulation (right). (G) Ca2+ traces from F from domains (salmon), arborization (red), and soma (blue). Scale = F/Fo, 10 s.
Figure 1—figure supplement 1.
Figure 1—figure supplement 1.. Semi-automatic method for the segmentation of astrocyte morphology.
(A) Sulforhodamine 101 (SR101)-stained astrocyte population with an outlined cell. Scale bar = 50 µm. (B) Selected astrocyte placed in polar coordinates with rings overlaid to assess structural fluorescence. Scale bar = 10 µm. (C) Average fluorescence of rings centered on astrocyte soma as radius is extended outward. Note, overlay of values from rings in B. (D) Fluorescence of rings in panel B as a function of angle. (E) Regions of interest (ROIs) from algorithm. (F) Calcium pseudocolor image during basal and stimulation. (G) Calcium traces from F during stimulation. Scale = F/Fo, 10 s.
Figure 2.
Figure 2.. Population arborization calcium is correlated to population soma activity.
(A) Sulforhodamine 101 (SR101) staining. Scale bar = 50 µm. (B) Pseudocolor Ca2+ images at basal and stimulation. (C) Regions of interest (ROIs) of soma and arborizations/domains along with activity during stimulation. (D) Proportion of subcellular responses to stimulation. (E) Percentage of active arborizations vs percent of somas active. (F) Percentage of domains active vs percent of somas active. Mean ± SEM. Pearson correlation.
Figure 3.
Figure 3.. Astrocyte calcium responses originate in the arborization before the soma.
(A) Astrocyte with regions of interest (ROIs). Scale bar = 10 µm. (B) Pseudocolor Ca2+ image. (C) Ca2+ traces in B from domains (pink), arborization (red), and the soma (blue). Scale = F/Fo, 5 s. (D) Raster plot of astrocyte somas (blue) and arbors (red) in response to stimulation (gray). (E) Average calcium traces from somas (blue) and arborizations (red) aligned to their respective soma onset. (F) Soma and arbor latency to response (left), event rise time (center), and event decay time (right). n = 995 astrocyte reponses. Mean ± SEM. ‘**’ ≡ p<0.01 and ‘***’ ≡ p<0.001 using paired Student’s t-test.
Figure 3—figure supplement 1.
Figure 3—figure supplement 1.. Distinct dynamics of domains before and after soma onset.
(A) Average calcium traces from somas (blue) and domains activating before the soma (pre-soma; green) and after the soma (post-soma; pink) aligned to their respective soma onset. (B) Pre-soma and post-soma latency to response relative to their respective soma onset. (C) Event rise time. (D) Event decay time. n = 995 astrocyte reponses. Mean ± SEM. ‘***’ ≡ p<0.001 using paired Student’s t-test.
Figure 4.
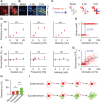
Figure 4.. A spatial threshold for astrocyte calcium in the soma to reach astrocyte calcium surge.
(A) Astrocyte and regions of interest (ROIs). Scale bar = 10 µm. (B) Pseudocolor Ca2+ images during basal and different frequency of stimulations. (C) Scheme of domains (red) and soma (blue) Ca2+ activity from B. (D) Percentage of active domains vs stimulus duration, intensity, and frequency. n = 11 populations. (E) Active state of soma for individual astrocytes vs percentage of active domains (red). Data were fit to a Heaviside step function (blue dotted line). (F) Percentage of active domains necessary to elicit soma activation vs stimulus duration, intensity, and frequency. Blue dotted lines denote 22.6% spatial threshold. n = 11 populations. (G) Soma fluorescence vs percentage of active domains (red). Data were fit to a sigmoidal function (blue) and a blue dotted line denotes 22.6% spatial threshold. (H) Percentage of active domains in the absence of soma activation vs active domains before and after soma activation. Blue line denotes 22.6% spatial threshold. (I) Schematic showing subthreshold and suprathreshold astrocyte calcium activity. Mean ± SEM. ‘***’ ≡ p<0.001 and ‘ns’ ≡ p>0.05 using one-way ANOVA or Student’s t-test.
Figure 5.
Figure 5.. The spatiotemporal properties of astrocyte calcium surge.
(A) The time course of calcium surge following sensory stimulation. The average of 10 sequential frames (2 s) ending on the time from stimulation onset in seconds. Scale bar = 10 µm. (B) Temporal map of domain temporal order relative to soma activation from A. (C) Average distance between pairs of active domains in the absence of soma activation vs before and after soma activation. n = 286 cells without soma activation, and 326 cells with soma activation. (D) Average time between pairs of active domains in the absence of soma activation vs before and after soma activation. Mean ± SEM. (E) Comparison between activated domain onset relative to soma activation vs radius from the center of the soma. ‘***’ ≡ p<0.001 using paired and unpaired Student’s t-test. Pearson correlation.
Figure 6.
Figure 6.. The spatial activation of domain Ca2+ remains below the spatial threshold in mice lacking the IP3 receptor type-2.
(A) Sulforhodamine 101 (SR101) staining. Scale bar = 50 µm. (B) Pseudocolor Ca2+ images at basal and stimulation. (C) Traces from astrocytes in B. Scale = F/Fo, 10 s. (D) Percentage of domains (left), arborizations (center), and somas (left) active at basal (open) and stimulation (hashed) in Itpr2-/- mice. (E) Percentage of domains active in wildtype (filled) and Itpr2-/- mice (hashed). Blue line denotes 22.6% spatial threshold. (F) Probability of soma activation in wildtype (filled) and Itpr2-/- mice (hashed). n = 30 populations in WT and 5 populations in knockout mice. Mean ± SEM. ‘***’ ≡ p<0.001 using paired and unpaired Student’s t-test.
Figure 7.
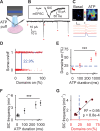
Figure 7.. Increases in slow inward currents (SICs) occur with astrocyte calcium surge.
(A) Scheme of cortical brain slice experiments to image astrocyte Ca2+ and record SICs with adenosine triphosphate (ATP) application. (B) Example traces of a miniature excitatory post synaptic current (mEPCS) and an SIC (upper) and SICs following ATP puff (black bar) (lower). (C) Pseudocolor Ca2+ images at basal and ATP with traces of responses to puff (black bar) in the soma (blue), arbor (red), and domains (salmon). Scale bar = 10 µm. Scale = F/Fo, 10 s. (D) Active state of soma for individual astrocytes vs percentage of active domains (red), with fit to a Heaviside step function (blue line). (E) Percentage of domains active in response to ATP puff. Blue dotted line denotes spatial threshold from D. n = 11 populations. (F) SIC frequency in response to ATP puff. n = 9 neurons. (G) Pearson correlation between percent active domains vs SIC frequency. Blue dotted line denotes spatial threshold from D. Mean ± SEM. ‘***’ ≡ p<0.001 using one-way ANOVA and t-test of Pearson correlation.

Update of

References

    1. Adamsky A, Kol A, Kreisel T, Doron A, Ozeri-Engelhard N, Melcer T, Refaeli R, Horn H, Regev L, Groysman M. Astrocytic activation generates de novo neuronal potentiation and memory enhancement. Cell. 2018;174:59–71. doi: 10.1016/j.cell.2018.05.002. - DOI - PubMed
    1. Agarwal A, Wu PH, Hughes EG, Fukaya M, Tischfield MA, Langseth AJ, Wirtz D, Bergles DE. Transient opening of the mitochondrial permeability transition pore induces microdomain calcium transients in astrocyte processes. Neuron. 2017;93:587–605. doi: 10.1016/j.neuron.2016.12.034. - DOI - PMC - PubMed
    1. Agulhon C, Petravicz J, McMullen AB, Sweger EJ, Minton SK, Taves SR, Casper KB, Fiacco TA, McCarthy KD. What is the role of astrocyte calcium in neurophysiology? Neuron. 2008;59:932–946. doi: 10.1016/j.neuron.2008.09.004. - DOI - PMC - PubMed
    1. Ahmadpour N, Kantroo M, Stobart MJ, Meza-Resillas J, Shabanipour S, Parra-Nuñez J, Salamovska T, Muzaleva A, O’Hara F, Erickson D, Di Gaetano B, Carrion-Falgarona S, Weber B, Lamont A, Lavine NE, Kauppinen TM, Jackson MF, Stobart JL. Cortical astrocyte N-methyl-D-aspartate receptors influence whisker barrel activity and sensory discrimination in mice. Nature Communications. 2024;15:1571. doi: 10.1038/s41467-024-45989-3. - DOI - PMC - PubMed
    1. Ahrens MB, Khakh BS, Poskanzer KE. Astrocyte Calcium Signaling. Cold Spring Harb Perspect Biol. 2024;16:a041353. doi: 10.1101/cshperspect.a041353. - DOI - PMC - PubMed

LinkOut - more resources