. 2025 Feb 3;222(2):e20241413.
doi: 10.1084/jem.20241413. Epub 2024 Dec 16.

A common form of dominant human IFNAR1 deficiency impairs IFN-α and -ω but not IFN-β-dependent immunity

Collaborators, Affiliations

A common form of dominant human IFNAR1 deficiency impairs IFN-α and -ω but not IFN-β-dependent immunity

Fahd Al Qureshah et al. J Exp Med. .

Abstract

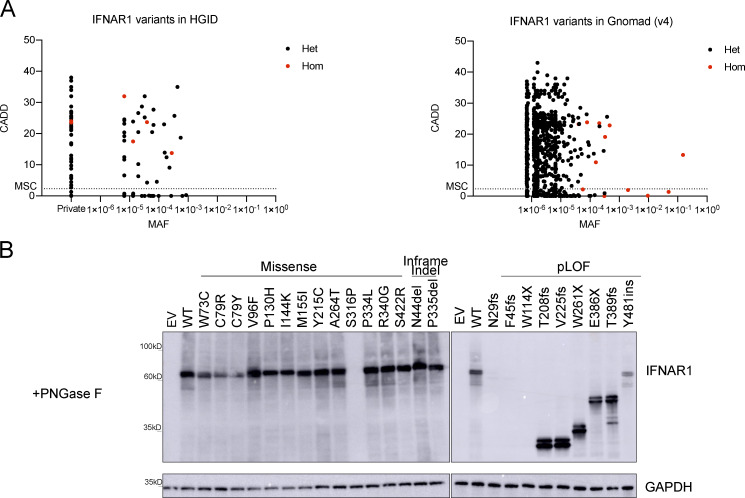
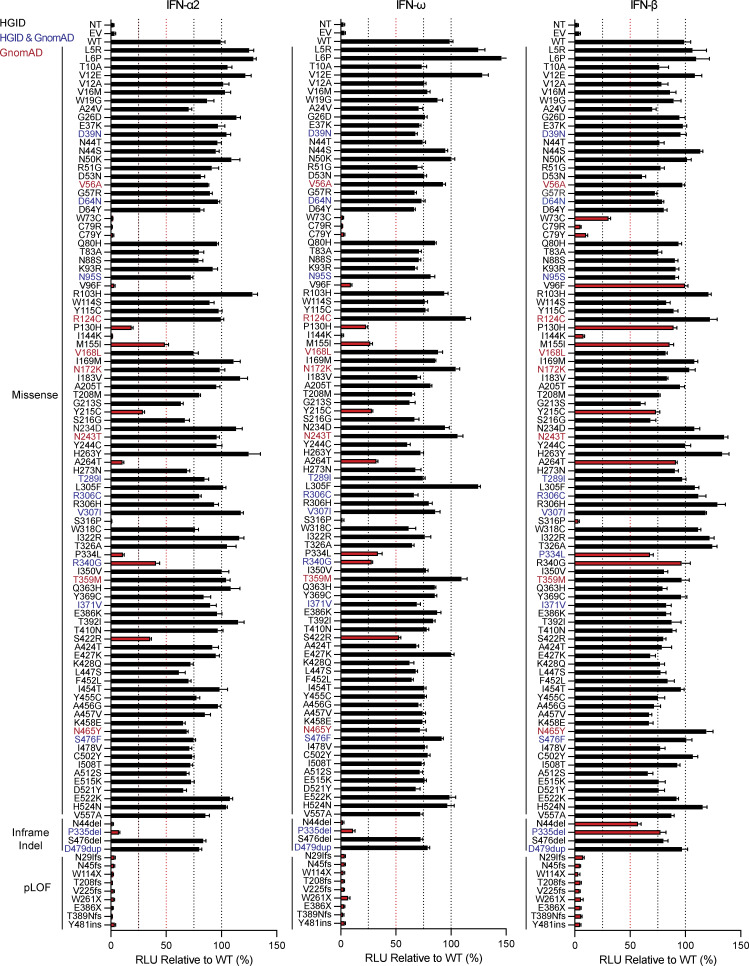
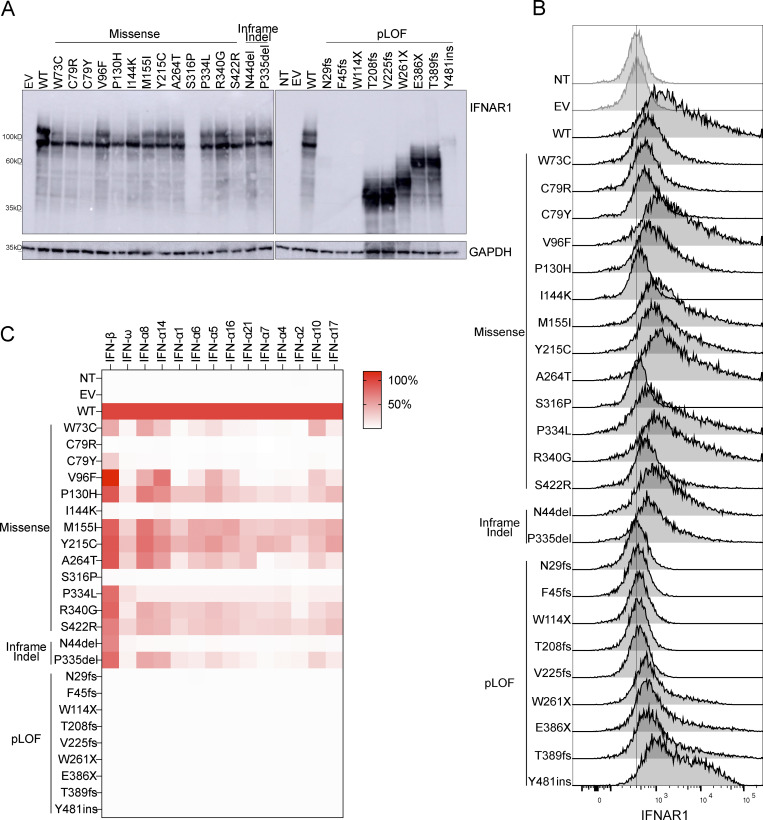
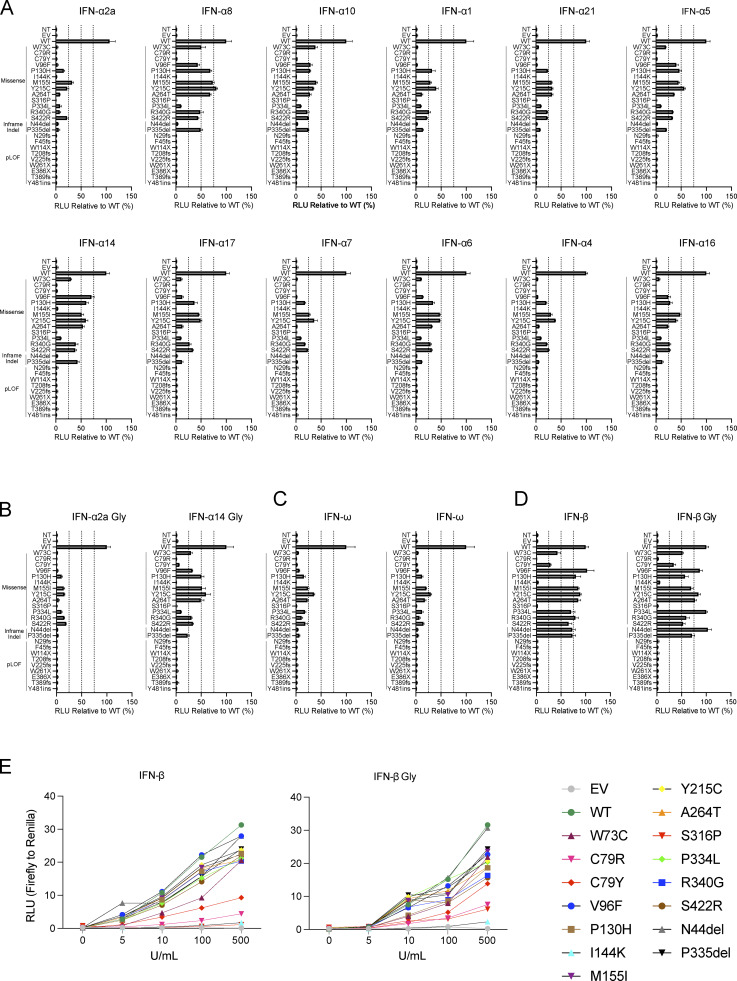
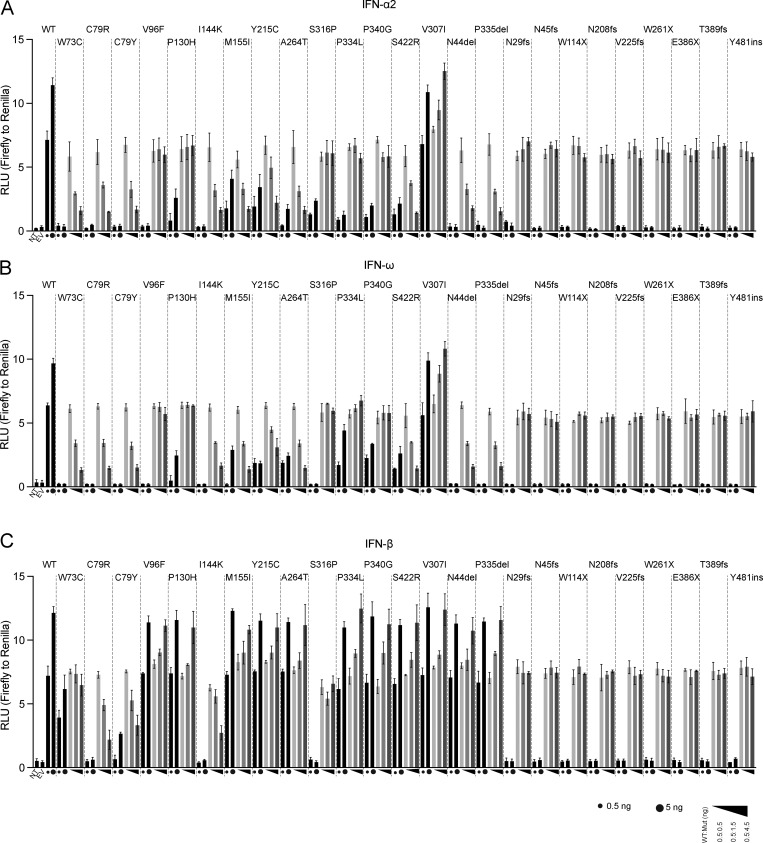
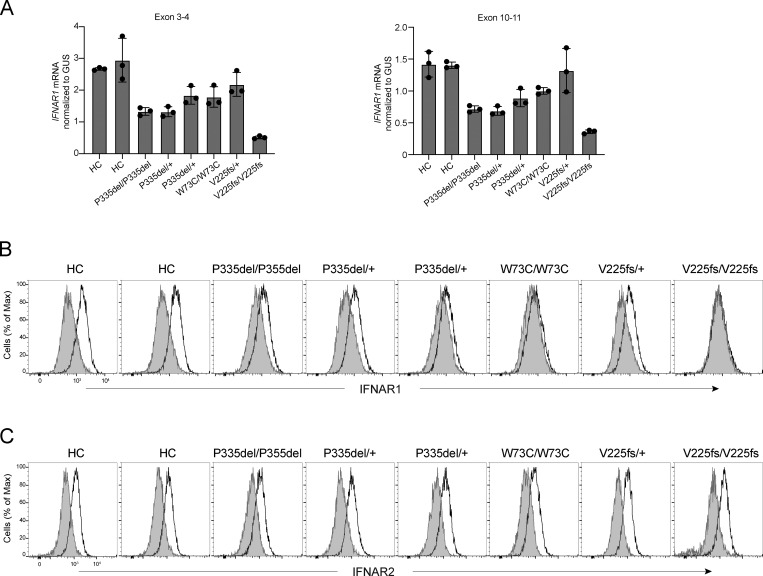
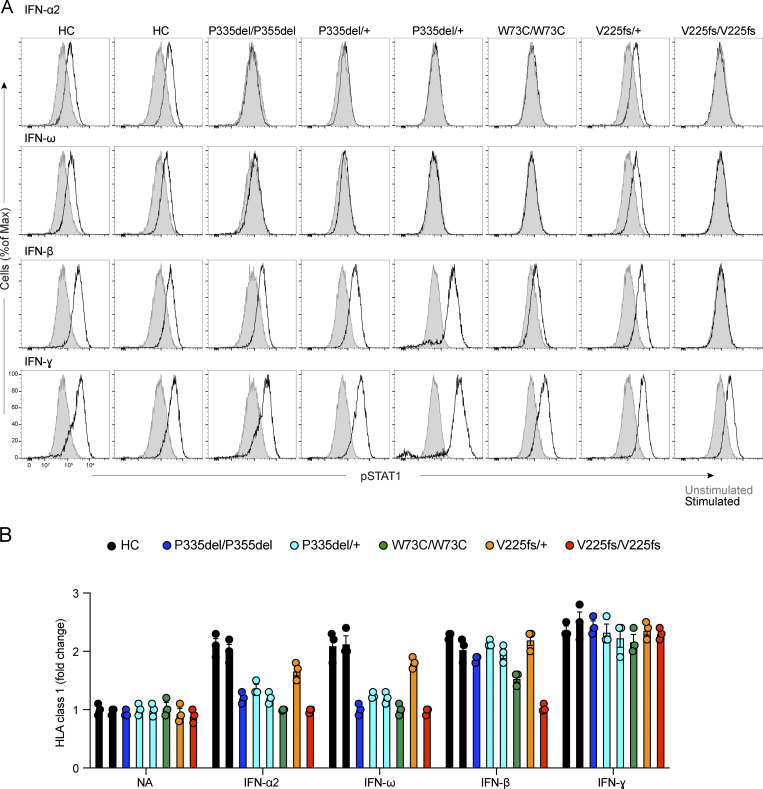
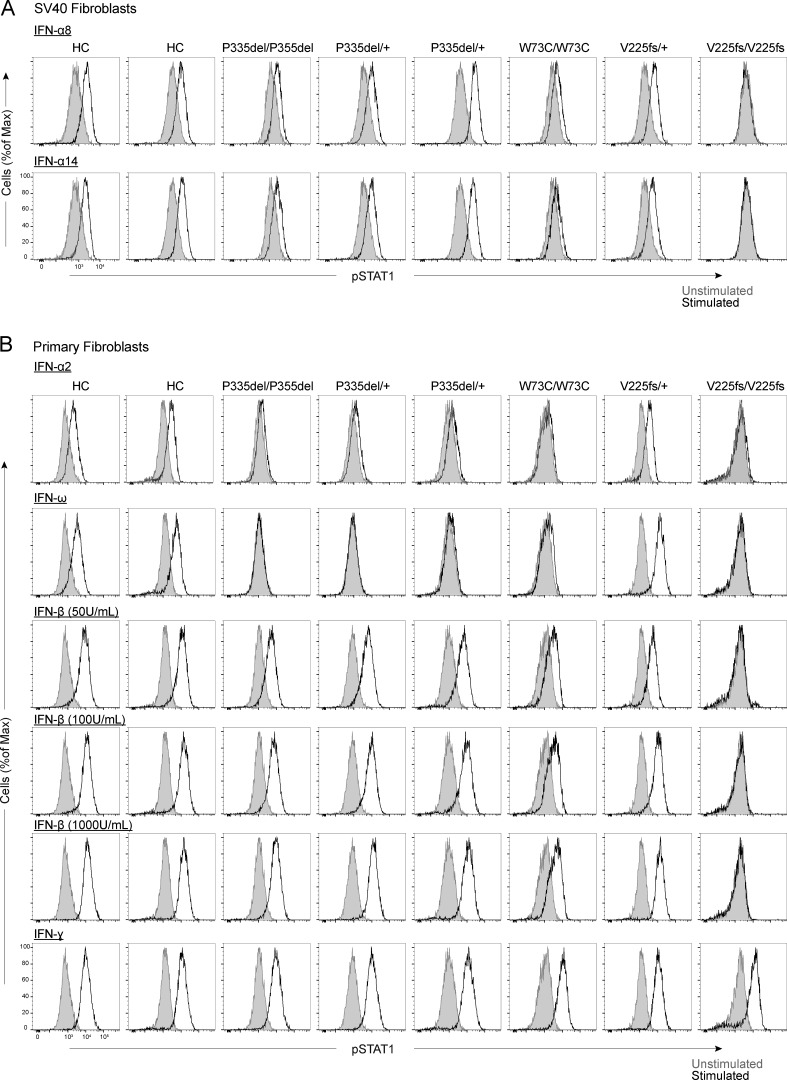
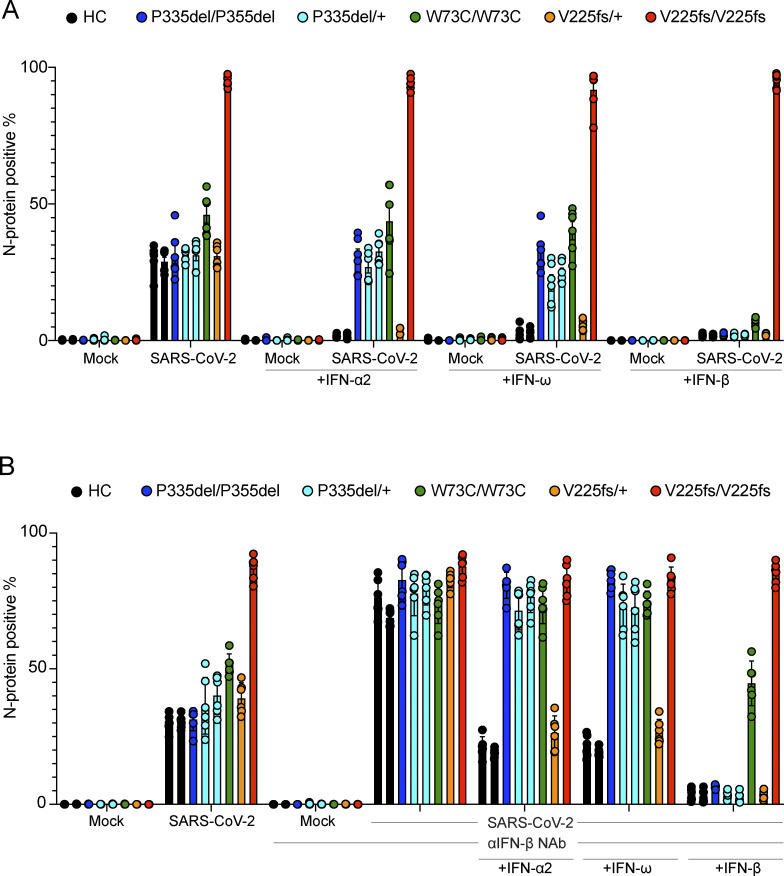
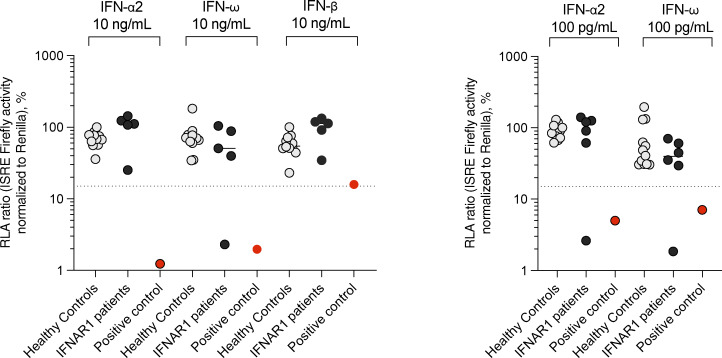
Autosomal recessive deficiency of the IFNAR1 or IFNAR2 chain of the human type I IFN receptor abolishes cellular responses to IFN-α, -β, and -ω, underlies severe viral diseases, and is globally very rare, except for IFNAR1 and IFNAR2 deficiency in Western Polynesia and the Arctic, respectively. We report 11 human IFNAR1 alleles, the products of which impair but do not abolish responses to IFN-α and -ω without affecting responses to IFN-β. Ten of these alleles are rare in all populations studied, but the remaining allele (P335del) is common in Southern China (minor allele frequency ≈2%). Cells heterozygous for these variants display a dominant phenotype in vitro with impaired responses to IFN-α and -ω, but not -β, and viral susceptibility. Negative dominance, rather than haploinsufficiency, accounts for this dominance. Patients heterozygous for these variants are prone to viral diseases, attesting to both the dominance of these variants clinically and the importance of IFN-α and -ω for protective immunity against some viruses.


Conflict of interest statement

Disclosures: N. de Prost reported personal fees from AstraZeneca and personal fees from Moderna outside the submitted work. J.-L. Casanova reported a patent to PCT/US2021/042741 pending. No other disclosures were reported.

Figures

Figure S1.
Figure S1.
Population genetics of the IFNAR1 variants present in the HGID and gnomAD v4.0.0 databases. (A) The biallelic variants are shown in red, whereas the monoallelic variants are shown in black. The dotted line represents the gene damage index. MSC, mutation significance cutoff; CADD, combined annotation-dependent depletion; MAF, minor allele frequency. (B) Western blot for IFNAR1 in IFNAR1-deficient HEK293T cells transiently transfected with WT or mutant IFNAR1 cDNA constructs and treated with PNGase to remove oligosaccharides from glycoproteins. An antibody recognizing the N-terminus (SD2) of the IFNAR1 protein was used. GAPDH was used as a loading control. A representative blot from at least two experiments is shown. EV, empty vector; WT, wild type. Source data are available for this figure: SourceData FS1.
Figure 1.
Figure 1.
Functional characterization of IFNAR1 variants. Luciferase activity in IFNAR1−/− HEK293T cells transiently transfected with WT or mutant IFNAR1 cDNA constructs, together with an ISRE firefly luciferase reporter and a constitutively expressed Renilla luciferase reporter, stimulated with IFN-α2 (1,000 U/ml), IFN-ω (1 ng/ml), or IFN-β (100 U/ml) for 24 h. The specific response to IFN stimulation was calculated by determining the ratio of firefly luciferase activity to Renilla luciferase activity (RLU, relative luciferase ratio). Variants found only in the HGID cohort are indicated in black, variants unique to gnomAD are indicated in red, and variants common to both are indicated in blue. Hypomorphic or LOF variants are indicated by a red bar. The red line shows the 50% cutoff. NT, non-transfected; EV, empty vector. Graphs depict the mean ± SEM of two independent experiments.
Figure 2.
Figure 2.
Location of variants on human IFNAR1. (A) Schematic representation of full-length IFNAR1 protein, including the four fibronectin type III subdomains (SD1–4), the signal peptide (SP), and the transmembrane domain (TM). The mutations investigated in this study are depicted on the diagram. The hitherto unknown mutations are indicated in red, and the previously reported mutations are indicated in black. (B) Ribbon representation of the overall structure of the IFNα2–YNS–IFNAR1–IFNAR2 ternary complex (PDB 3SE3 [Thomas et al., 2011], visualized with PyMOL [version 2.5.5]) showing IFNAR1 with SD1 colored in green, SD2 in blue, and SD3 in violet. IFNα2–YNS is depicted in cyan and IFNAR2 in beige. The amino-acid variants of IFNAR1 described here are highlighted by the depiction of their side chains as spheres across IFNAR1 SD1-3. Variants resulting from a missense mutation are depicted with side chains in yellow. Variants resulting in a complete LOF for IFN-α2, IFN-ω, and IFN-β signaling or hypomorphic for such signaling are depicted with side chains in magenta. In-frame indel variants are depicted with side chains in orange. Variants resulting from a frameshift mutation or an early stop codon (F45fs, W114X, T208fs, V225fs, and W261X) are not shown. (C) Close-up view of IFNAR1 SD1 (green) showing the location of variants N44 (orange), W73, and C79 (both magenta), along with V96 and the adjacent M128 from IFNAR1 SD2 (yellow). The locations of SD1 in relation to IFNAR1 SD2 (blue) and IFNα2-YNS (cyan) are shown. (D) Close-up view of IFNAR1 SD2 (blue), showing the location of P103, M128, and Y215 variants and the adjacent V96 from IFNAR1 SD1 (yellow), together with I144 (magenta). The locations of IFNAR1 SD2 (slate blue) in relation to IFNAR1 SD1 (green), IFNAR1 SD3 (violet), and IFNα2-YNS (cyan) are shown. (E) Close-up view of IFNAR1 SD3 (violet) showing the locations of the variants A264 (yellow) and S316 (magenta). The approximate locations of P334 (yellow circle) and P335 (orange circle), which were not resolved in the IFNα2–YNS–IFNAR1–IFNAR2 crystal structure, are predicted. The locations of IFNAR1 SD3 (violet) in relation to IFNAR1 SD2 (blue) and IFNα2-YNS (cyan) are shown.
Figure 3.
Figure 3.
Expression of IFNAR1 variants and their impact on the response to type I IFNs. (A) Western blotting for IFNAR1 in IFNAR1-deficient HEK293T cells transiently transfected with WT or mutant IFNAR1 cDNA constructs. An antibody recognizing the N-terminus of the IFNAR1 protein was used. GAPDH was used as a loading control. A representative blot from at least two experiments is shown. NT, non-transfected; EV, empty vector. (B) Flow cytometry histogram of cell-surface IFNAR1 levels in IFNAR1-deficient HEK293T cells transiently transfected with WT or mutant IFNAR1 cDNA constructs and then subjected to extracellular staining with a specific antibody recognizing the N-terminal part (SD2) of the IFNAR1 protein. All histogram plots are representative of at least two independent experiments. (C) IFNAR1-deficient HEK293T cells were transiently transfected with WT or mutant IFNAR1 cDNA constructs and were then stimulated with the indicated IFNs for 24 h, and luciferase activity was measured. The IFN-α subtypes are arranged in order of affinity for IFNAR1 binding, from the highest (left, IFN-α8) to the lowest (right, IFN-α17) affinity (Table S1). The heatmap shows the mean luciferase activity relative to the WT from two independent experiments. Source data are available for this figure: SourceData F3.
Figure S2.
Figure S2.
Functional characterization of IFNAR1 variants in terms of the response to type I IFNs. (A–D) IFNAR1-deficient HEK293T cells transiently transfected with WT or mutant IFNAR1 cDNA constructs were stimulated with IFN-α subtypes (1,000 U/ml, A), glycosylated IFN-α2a or IFN-α14 (1,000 U/ml, B), non-glycosylated or glycosylated IFN-ω (1 ng/ml, C), or non-glycosylated or glycosylated IFN-β (100 U/ml) for 24 h, and luciferase activity was measured relative to WT. (E) Luciferase signal readings across a range of titrated concentrations of non-glycosylated or glycosylated IFN-β. The graphs show the mean ± SEM of two independent experiments.
Figure 4.
Figure 4.
Negative dominance assay for IFNAR1 variants. (A–C) IFNAR1-deficient HEK293T cells cotransfected with luciferase reporter plasmids plus EV (up to 15 ng) and various amounts of plasmids encoding WT and/or variant IFNAR1 (0.5, 1.5, 4.5, and 5 ng). The amount of plasmid used for transfection (ng) is indicated in the figure. Cells were stimulated with IFN-α2 (A, 1,000 U/ml), IFN-ω (B, 1 ng/ml), or IFN-β (C, 100 U/ml) for 24 h, and luciferase activity was measured. Graphs depict the mean ± SEM of two independent experiments.
Figure 5.
Figure 5.
Expression of IFNAR1 by the patients’ fibroblasts. (A) IFNAR1 mRNA levels in SV40-fibroblasts from two healthy controls (C1, C2), and patients with IFNAR1 variants: P335del/P335del, P335del/+, W73C/W73C, V225fs/+, and V225fs/V225fs. GUS was used as an expression control. Graphs depict the mean ± SEM of two independent experiments, each with three technical duplicates. (B and C) Flow cytometry histograms of cell-surface expression for IFNAR1 (B) and IFNAR2 (C), with extracellular staining of SV40-fibroblasts from healthy controls and patients. Antibodies recognize the extracellular parts of IFNAR1 or IFNAR2. Each histogram plot is representative of two independent experiments.
Figure 6.
Figure 6.
Function of IFNAR1 variants in the patients’ fibroblasts. (A) Intracellular FACS staining of phosphorylated STAT1 in SV40-fibroblasts stimulated with IFN-α2a (1,000 U/ml), IFN-ω (1 ng/ml), IFN-β (100 U/ml), or IFN-γ (1,000 U/ml) for 15 min, for two healthy controls and patients with IFNAR1 variants. (B) Fold-change in HLA class I levels analyzed by flow cytometry with extracellular staining in SV40-fibroblasts stimulated with IFN-α2a, IFN-ω, IFN-β, or IFN-γ for 48 h. Graphs depict the mean ± SEM of two independent experiments.
Figure S3.
Figure S3.
Function of IFNAR1 variants in the patients’ fibroblasts. (A) Intracellular FACS staining of phosphorylated STAT1 in SV40 fibroblasts stimulated with IFN-α8 (1,000 U/ml) or IFN-α8 (1,000 U/ml) for 15 min for two healthy controls and patients. (B) Intracellular FACS staining of phosphorylated STAT1 in primary fibroblasts stimulated with IFN-α2a (1,000 U/ml), IFN-ω (1 ng/ml), IFN-β (50, 100, and 100 U/ml), or IFN-γ (1,000 U/ml) for 15 min, for two healthy controls and patients. The graphs show representative data from two independent experiments.
Figure 7.
Figure 7.
SARS-CoV-2 infection in the cells of an IFNAR1-deficient patient in vitro. (A) Immunofluorescence (IF) analysis for the SARS-CoV-2 N protein in SV40-fibroblasts from healthy controls (C1 and C2) and patients with IFNAR1 variants including P335del/P335del, P335del/+ (two patients), W73C/W73C, V225fs/+, and V225fs/V225fs. Cells were treated with IFN-α2a (100 U/ml), IFN-ω (1 ng/ml), or IFN-β (10 U/ml) overnight before infection with SARS-CoV-2 (MOI = 0.5). Cells were fixed and stained 48 h after infection. (B) IF analysis for the SARS-CoV-2 N protein in SV40-fibroblasts treated with neutralizing anti-IFN-β antibodies. Cells were treated with anti-IFN-β neutralizing antibodies and then with IFN-α2a (100 U/ml), IFN-ω (1 ng/ml), or IFN-β (100 U/ml) overnight. They were then infected with SARS-CoV-2 infection (MOI = 0.5). Cells were fixed and stained 48 h after infection. Graphs depict the mean ± SEM of two or three independent experiments.
Figure S4.
Figure S4.
SARS-CoV-2 infection of IFNAR1-deficient patient cells in vitro. (A–C) IF analysis for the SARS-CoV-2 N protein in SV40-fibroblasts from healthy controls (C1 and C2) and patients with IFNAR1 variants including P335del/P335del, P335del/+ (two patients), W73C/W73C, V225fs/+, and V225fs/V225fs. Cells were treated with IFN-α2a (100 or 10 U/ml, A), IFN-ω (1 or 0.1 ng/ml, B), or IFN-β (10, 5, or 1 U/ml, C) overnight and then infected with SARS-CoV-2 at MOI = 0.1, 0.5, or 1.5. Cells were fixed and stained 24 or 48 h after infection. (D) IF analysis for the SARS-CoV-2 N protein in SV40-fibroblasts treated with neutralizing antibodies against IFN-β then stimulated with IFN-α2a (100 U/ml), IFN-ω (1 ng/ml), or IFN-β (100 U/ml). Cells were then infected with SARS-CoV-2 at MOI = 0.5. Cells were fixed and stained 24 h after infection. The graphs depict the mean ± SEM of two or three independent experiments.
Figure S5.
Figure S5.
Auto-Abs neutralizing type I IFNs in the patients with IFNAR1 variants. Luciferase-based neutralization assays for detecting auto-Abs neutralizing 10 ng/ml IFN-α2, IFN-ω, or IFN-β (left panel) and 100 pg/ml IFN-α2 or IFN-ω (right panel). Plasma samples from healthy controls (gray), patients with IFNAR1 variants (black; P1, 3, 6, 9, 17, and 27), and an APS-1 patient (red, positive control) were diluted 1:10. HEK293T cells were cotransfected with a plasmid containing the firefly luciferase gene under the control of an IFN-sensitive response element (ISRE)-containing promotor and a plasmid containing the Renilla luciferase gene. The cells were then treated with type I IFNs, and relative luciferase activity (RLA) was calculated by normalizing firefly luciferase activity against Renilla luciferase activity. An RLA <15% of the value for the mock treatment was considered to correspond to neutralizing activity (dotted line; Bastard et al., 2021a).

References

    1. Abolhassani, H., Landegren N., Bastard P., Materna M., Modaresi M., Du L., Aranda-Guillén M., Sardh F., Zuo F., Zhang P., et al. . 2022. Inherited IFNAR1 deficiency in a child with both critical COVID-19 pneumonia and multisystem inflammatory syndrome. J. Clin. Immunol. 42:471–483. 10.1007/s10875-022-01215-7 - DOI - PMC - PubMed
    1. Alotaibi, F., Alharbi N.K., Rosen L.B., Asiri A.Y., Assiri A.M., Balkhy H.H., Al Jeraisy M., Mandourah Y., AlJohani S., Al Harbi S., et al. . 2023. Type I interferon autoantibodies in hospitalized patients with Middle East respiratory syndrome and association with outcomes and treatment effect of interferon beta-1b in MIRACLE clinical trial. Influenza Other Respir. Viruses. 17:e13116. 10.1111/irv.13116 - DOI - PMC - PubMed
    1. Armangué, T., Olivé-Cirera G., Martínez-Hernandez E., Rodes M., Peris-Sempere V., Guasp M., Ruiz R., Palou E., González A., Marcos M.Á., et al. . 2023. Neurologic complications in herpes simplex encephalitis: Clinical, immunological and genetic studies. Brain. 146:4306–4319. 10.1093/brain/awad238 - DOI - PubMed
    1. Asano, T., Boisson B., Onodi F., Matuozzo D., Moncada-Velez M., Maglorius Renkilaraj M.R.L., Zhang P., Meertens L., Bolze A., Materna M., et al. . 2021. X-linked recessive TLR7 deficiency in ∼1% of men under 60 years old with life-threatening COVID-19. Sci. Immunol. 6:eabl4348. 10.1126/sciimmunol.abl4348 - DOI - PMC - PubMed
    1. Bastard, P., Gervais A., Le Voyer T., Philippot Q., Cobat A., Rosain J., Jouanguy E., Abel L., Zhang S.Y., Zhang Q., et al. . 2024. Human autoantibodies neutralizing type I IFNs: From 1981 to 2023. Immunol. Rev. 322:98–112. 10.1111/imr.13304 - DOI - PMC - PubMed

LinkOut - more resources