. 2025 Jan 15;152(2):dev202703.
doi: 10.1242/dev.202703. Epub 2025 Jan 16.

Examining the NEUROG2 lineage and associated gene expression in human cortical organoids

Affiliations

Examining the NEUROG2 lineage and associated gene expression in human cortical organoids

Lakshmy Vasan et al. Development. .

Abstract

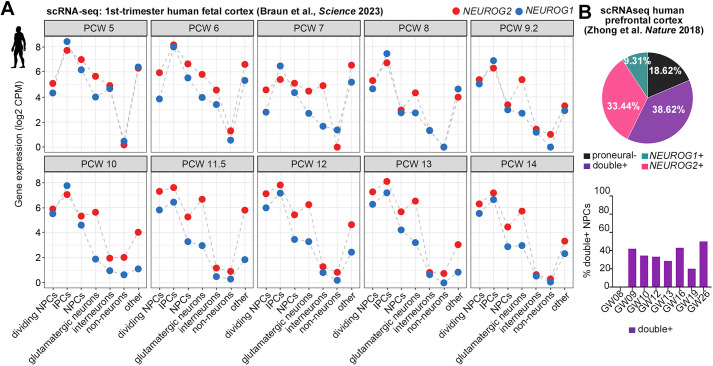
Proneural genes are conserved drivers of neurogenesis across the animal kingdom. How their functions have adapted to guide human-specific neurodevelopmental features is poorly understood. Here, we mined transcriptomic data from human fetal cortices and generated from human embryonic stem cell-derived cortical organoids (COs) to show that NEUROG1 and NEUROG2 are most highly expressed in basal neural progenitor cells, with pseudotime trajectory analyses indicating that NEUROG1-derived lineages predominate early and NEUROG2 lineages later. Using ChIP-qPCR, gene silencing and overexpression studies in COs, we show that NEUROG2 is necessary and sufficient to directly transactivate known target genes (NEUROD1, EOMES, RND2). To identify new targets, we engineered NEUROG2-mCherry knock-in human embryonic stem cells for CO generation. The mCherry-high CO cell transcriptome is enriched in extracellular matrix-associated genes, and two genes associated with human-accelerated regions: PPP1R17 and FZD8. We show that NEUROG2 binds COL1A1, COL3A1 and PPP1R17 regulatory elements, and induces their ectopic expression in COs, although NEUROG2 is not required for this expression. Neurog2 similarly induces Col3a1 and Ppp1r17 in murine P19 cells. These data are consistent with a conservation of NEUROG2 function across mammalian species.

Keywords: NEUROG2; CRISPR gene editing; Cortical organoid; Extracellular matrix; Human-specific features; Lineage tracing; Proneural transcription factor.


Conflict of interest statement

Competing interests The authors declare no competing or financial interests.

Figures

Fig. 1.
Fig. 1.
NEUROG1 and NEUROG2 expression in human fetal cortices. (A) Pseudo-bulk analysis of NEUROG1 and NEUROG2 transcript counts in scRNA-seq data collected from post-conception weeks (PCW) 5-14 human cortices (Braun et al., 2023), showing log2 counts per million (CPM). (B) Distribution of NEUROG1/NEUROG2 single and double-positive cells in scRNA-seq datasets from human fetal cortices between gestational week (GW) 8 and 26 (Zhong et al., 2018).
Fig. 2.
Fig. 2.
Generation of COs and snRNA-seq analysis. (A) Immunolabeling of day 35 and day 30 COs with SOX2 and TUJ1 or NES and TUJ1 (left), and 3D rendering of a tissue-cleared, day 42 CO immunolabeled with SOX2 and TUJ1 imaged with light sheet microscopy (right). (B) Overlay of uniform manifold approximation and projections (UMAPs) of snRNA-seq data collected from four independent sets of pooled day 30 COs. Numbers represent identified clusters. (C) Average transcript read counts per cell in each cluster. (D) UMAP showing the cluster distribution and manually annotated cluster identities. (E,F) Feature plots showing FOXG1, PAX6, NEUROG1 and PPP1R17 transcript distributions (E) and corresponding immunolabeling in day 30 COs (F). (G,H) Feature plots showing TBR1 and BCL11B transcript distributions (G) and corresponding immunolabeling in day 30 COs (H). (I) Proportions of day 30 CO cell types expressing NEUROG1 and/or NEUROG2. (J) Monocle3 lineage trajectory analysis of NEUROG2+, NEUROG1+ and double-positive cells in 30-day COs. aRG, apical radial glia; bRG, basal radial glia; IPC, intermediate progenitor cell. Scale bars: 400 mm (top left), 100 mm (bottom left), 200 mm (right) (A); 100 µm (F,H).
Fig. 3.
Fig. 3.
NEUROG2 is necessary and sufficient to turn on neurogenic genes in COs. (A) NEUROG2 immunolabeling of day 18 and day 48 COs. Scale bars: 100 µm. (B) qPCR of NEUROG2 and NEUROG1 in day 30 and day 90 COs. (C) NEUROG2 ChIP-qPCR (n=5), or mock control ChIP-qPCR (n=3), using day 45 COs, and qPCR amplified DLL3 and NEUROD4 promoter region binding sites in the eluted chromatin (n=5). An ORF amplified sequence was used as a negative control. (D) NEUROG2 silencing in day 60 COs using lentiviral shRNA with a scrambled control sequence (shScr) and two shRNAs targeting NEUROG2 (-A and -C) (n=7 each). COs were harvested after 72 h and the expression of NEUROG2, NEUROD1, EOMES, RND2, DLL1 and DLL3 was analyzed by qPCR. (E) Neurog2 gain-of-function assay, using AAV5-GFAP-iCre (control) and AAV5-GFAP-Neurog2-iCre to transduce day 90 COs (n=3 each). COs were harvested after 14 days and the expression of NEUROG2, NEUROD1, EOMES, RND2, DLL1 and DLL3 was analyzed by qPCR. Graphs show mean±s.e.m. Unpaired Student's t-tests were used for pairwise comparisons. Significance was defined as P<0.05.
Fig. 4.
Fig. 4.
Generation of NEUROG2-mCherry KI hESC-derived COs. (A) CRISPR/Cas9-strategy to generate NEUROG2-mCherry KI hESCs by homology-directed repair (HDR). (B) ddPCR analysis of genomic DNA from sorted hESC-targeted cells. Raw droplet data of ddPCR measured for a negative control and two different positive clones indicating the increase in positive droplet count (blue dots) for the HDR sequence. (C) PCR genotyping of NEUROG2 wild-type and mCherry KI alleles in line 117 and line 105, showing that both lines are heterozygous. Expected amplicon sizes were observed in line 117, but the two amplicons were smaller than expected in line 105, indicative of 3′ truncations. (D) Sanger sequencing of NEUROG2-mCherry KI targeted hESC clone 117 near the Cas9 target site. (E,F) Co-immunolabeling of day 18 COs with mCherry and NEUROG2, SOX2 or DCX (E), and associated quantification (n=3) (F). (G,H) Co-immunolabeling of day 45 COs with mCherry and NEUROG2, SOX2 or DCX (G), and associated quantification (n=3) (H). Graphs in F,H show mean±s.e.m. Scale bars: 400 µm (low-magnification images); 100 µm (high-magnification images).
Fig. 5.
Fig. 5.
Targeted transcriptomic analysis of NEUROG2-mCherry KI hESC-derived COs. (A) qPCR to validate FACS-enrichment of mCherry and NEUROG2 transcripts in mCherry-high versus mCherry-low cells (n=3 each). Data are mean±s.e.m. Unpaired Student's t-tests were used for pairwise comparisons. Significance was defined as P<0.05. (B) Principal component analysis of targeted transcriptomic data collected from two sets of day 45 COs generated from NEUROG2-mCherry KI hESC cell lines 105 and 117 (N1, N2), for a total of four replicate data sets. (C) Volcano plot showing enriched genes in mCherry-high versus mCherry-low day 45 CO cells. (D,E) Biological Process-Gene Ontology (GOBP) terms enriched in DEGs that were upregulated (D) or downregulated (E) in mCherry-high CO cells. (F) Bar graph showing log2FC values of DEGs encoding ECM proteins and remodelers. (G) Enrichment of NEUROG2 and ECM gene transcripts in NPC compartments from microdissected human fetal cortical zones (Fietz et al., 2012). (H,I) Pseudo-bulk analysis of NEUROG2 and COL1A1 (H) and NEUROG2 and COL3A1 (I) transcript counts in scRNA-seq data collected from PCW 5-14 human cortices (Braun et al., 2023), showing log2CPM. (J,K) Pseudo-bulk analysis of Neurog2 and Col1a1 (J) and Neurog2 and Col3a1 (K) transcript counts in scRNA-seq data collected from E10.5 to E17.5 mouse cortices (Di Bella et al., 2021), showing log2CPM. BP, biological process; CO, cortical organoid; CP, cortical plate; DEGs, differentially expressed genes; ECM, extracellular matrix; GO, gene ontology; IPCs, intermediate progenitor cells; ISVZ, inner subventricular zone; mCh, mCherry; NPCs, neural progenitor cells; OSVZ, outer subventricular zone; VZ, ventricular zone.
Fig. 6.
Fig. 6.
Transcriptional relationship between NEUROG2 and COL1A1, COL1A2 and COL3A1. (A,B) Co-immunolabeling of day 18 (A) and day 45 (B) NEUROG2-mCherry KI hESC-derived COs with mCherry and the ECM markers collagen IV (COL4) or laminin (LAM). Scale bars: 400 µm (low-magnification images); 100 µm (high-magnification images). (C) NEUROG2 ChIP-qPCR (n=3), or mock control ChIP-qPCR (n=3), using day 45 COs. qPCR to quantify COL1A1 and COL3A1 promoter region binding sites and an ORF control sequence in the eluted chromatin. (D) Neurog2 overexpression, using AAV5-GFAP-iCre (control) and AAV5-GFAP-Neurog2-iCre to transduce day 90 COs (n=3 each). COs were harvested after 14 days and the expression of COL1A1, COL1A2 and COL3A1 was analyzed by qPCR. (E) NEUROG2 silencing in day 60 COs using lentiviral shRNA constructs, with a scrambled control sequence (shScr) or targeting NEUROG2 (-A and -C) (n=7 each). COs were harvested after 72 h and the expression of COL1A1, COL1A2 and COL3A1 was analyzed by qPCR. Graphs show mean±s.e.m. Unpaired Student's t-tests were used for pairwise comparisons. Significance was defined as P<0.05.
Fig. 7.
Fig. 7.
NEUROG2 engages with PPP1R17-regulatory elements and is sufficient to induce PPP1R17 transcription. (A) Bar graph showing log2FC values of DEGs involved in neurogenesis in mCherry-high and in mCherry-low CO cells. (B) Pseudo-bulk analysis of NEUROG2 and PPP1R17 transcript counts in scRNA-seq data collected from PCW 5-14 human cortices (Braun et al., 2023), showing log2CPM. (C) Single-cell ATAC-seq profiling of the PPP1R17 locus, showing accessible chromatin in regions and cell types in the developing human brain. Conserved accessible chromatin regions were identified in an upstream enhancer (yellow box) and surrounding the TSS (green box). A primate-specific HAR (red box) is mainly accessible in glutamatergic cortical lineages. A phyloP score was derived from multiple mammalian species, with negative scores indicative of accelerated evolution for the PPP1R17-HAR element in chimps and rhesus monkeys. (D) qPCR to validate FACS-enrichment of PPP1R17 transcripts in mCherry-high versus mCherry-low cells (n=3 each). (E) NEUROG2 ChIP-qPCR (n=3), or mock control ChIP-qPCR (n=3), using day 45 COs. qPCR was used to quantify PPP1R17-HAR and -TSS binding sites in the eluted chromatin. (F) Transcriptional reporter assay in SHSY-5Y human neuroblastoma cells using pCIG2-Neurog2 or pCIG2-GFP (negative control) expression vectors and luciferase (LUC) constructs with a minimal promoter carrying the PPP1R17-HAR or -TSS elements. (G) Neurog2 gain-of-function assay, using AAV5-GFAP-iCre (control) and AAV5-GFAP-Neurog2-iCre to transduce day 90 COs (n=3 each). COs were harvested after 14 days and the expression of PPP1R17 was analyzed by qPCR. (H) NEUROG2 silencing in day 60 COs using lentiviral shRNA constructs, with a scrambled control sequence (shScr) or targeting NEUROG2 (-A and -C) (n=7 each). COs were harvested after 72 h and PPP1R17 expression was analyzed by qPCR. Graphs show mean±s.e.m. Unpaired Student's t-tests were used for pairwise comparisons. Significance was defined as P<0.05.

References

    1. Amin, S. and Borrell, V. (2020). The extracellular matrix in the evolution of cortical development and folding. Front. Cell Dev. Biol. 8, 604448. 10.3389/fcell.2020.604448 - DOI - PMC - PubMed
    1. Arai, Y., Pulvers, J. N., Haffner, C., Schilling, B., Nusslein, I., Calegari, F. and Huttner, W. B. (2011). Neural stem and progenitor cells shorten S-phase on commitment to neuron production. Nat. Commun. 2, 154. 10.1038/ncomms1155 - DOI - PMC - PubMed
    1. Aydin, B., Kakumanu, A., Rossillo, M., Moreno-Estelles, M., Garipler, G., Ringstad, N., Flames, N., Mahony, S. and Mazzoni, E. O. (2019). Proneural factors Ascl1 and Neurog2 contribute to neuronal subtype identities by establishing distinct chromatin landscapes. Nat. Neurosci. 22, 897-908. 10.1038/s41593-019-0399-y - DOI - PMC - PubMed
    1. Bertrand, N., Castro, D. S. and Guillemot, F. (2002). Proneural genes and the specification of neural cell types. Nat. Rev. Neurosci. 3, 517-530. 10.1038/nrn874 - DOI - PubMed
    1. Birey, F., Andersen, J., Makinson, C. D., Islam, S., Wei, W., Huber, N., Fan, H. C., Metzler, K. R. C., Panagiotakos, G., Thom, N.et al. (2017). Assembly of functionally integrated human forebrain spheroids. Nature 545, 54-59. 10.1038/nature22330 - DOI - PMC - PubMed

MeSH terms

Substances

LinkOut - more resources