

Urban Heat and Burden of Hyponatremia
- PMID: 39680412
- PMCID: PMC11650395
- DOI: 10.1001/jamanetworkopen.2024.50280
Urban Heat and Burden of Hyponatremia
Abstract
Importance: Hyponatremia (sodium level <135 mEq/L), the most prevalent electrolyte disorder in clinical practice, is associated with considerable clinical and economic burdens. Despite its recognized effect and indication of seasonal patterns, there is a research gap regarding heat-related hyponatremia. Addressing this issue is crucial, especially regarding projected increases in environmental temperature, particularly in urban areas.
Objective: To comprehensively analyze the association of heat in an urban setting with hyponatremia prevalence.
Design, setting, and participants: This cross-sectional study using retrospective time series analysis was conducted among all adult patients (age ≥18 years) presenting to the Charité-Universitätsmedizin Berlin between March 1, 2000, and August 31, 2023, with a blood sodium measurement.
Exposure: The daily heat index, which accounts for both outdoor air temperature and relative humidity.
Main outcomes and measures: The primary outcome measure was the daily number of hyponatremia cases, further categorized by severity. Differences in prevalence across age groups (adult patients, aged 18-65 years; and older patients, aged >65 years) and sexes were also examined.
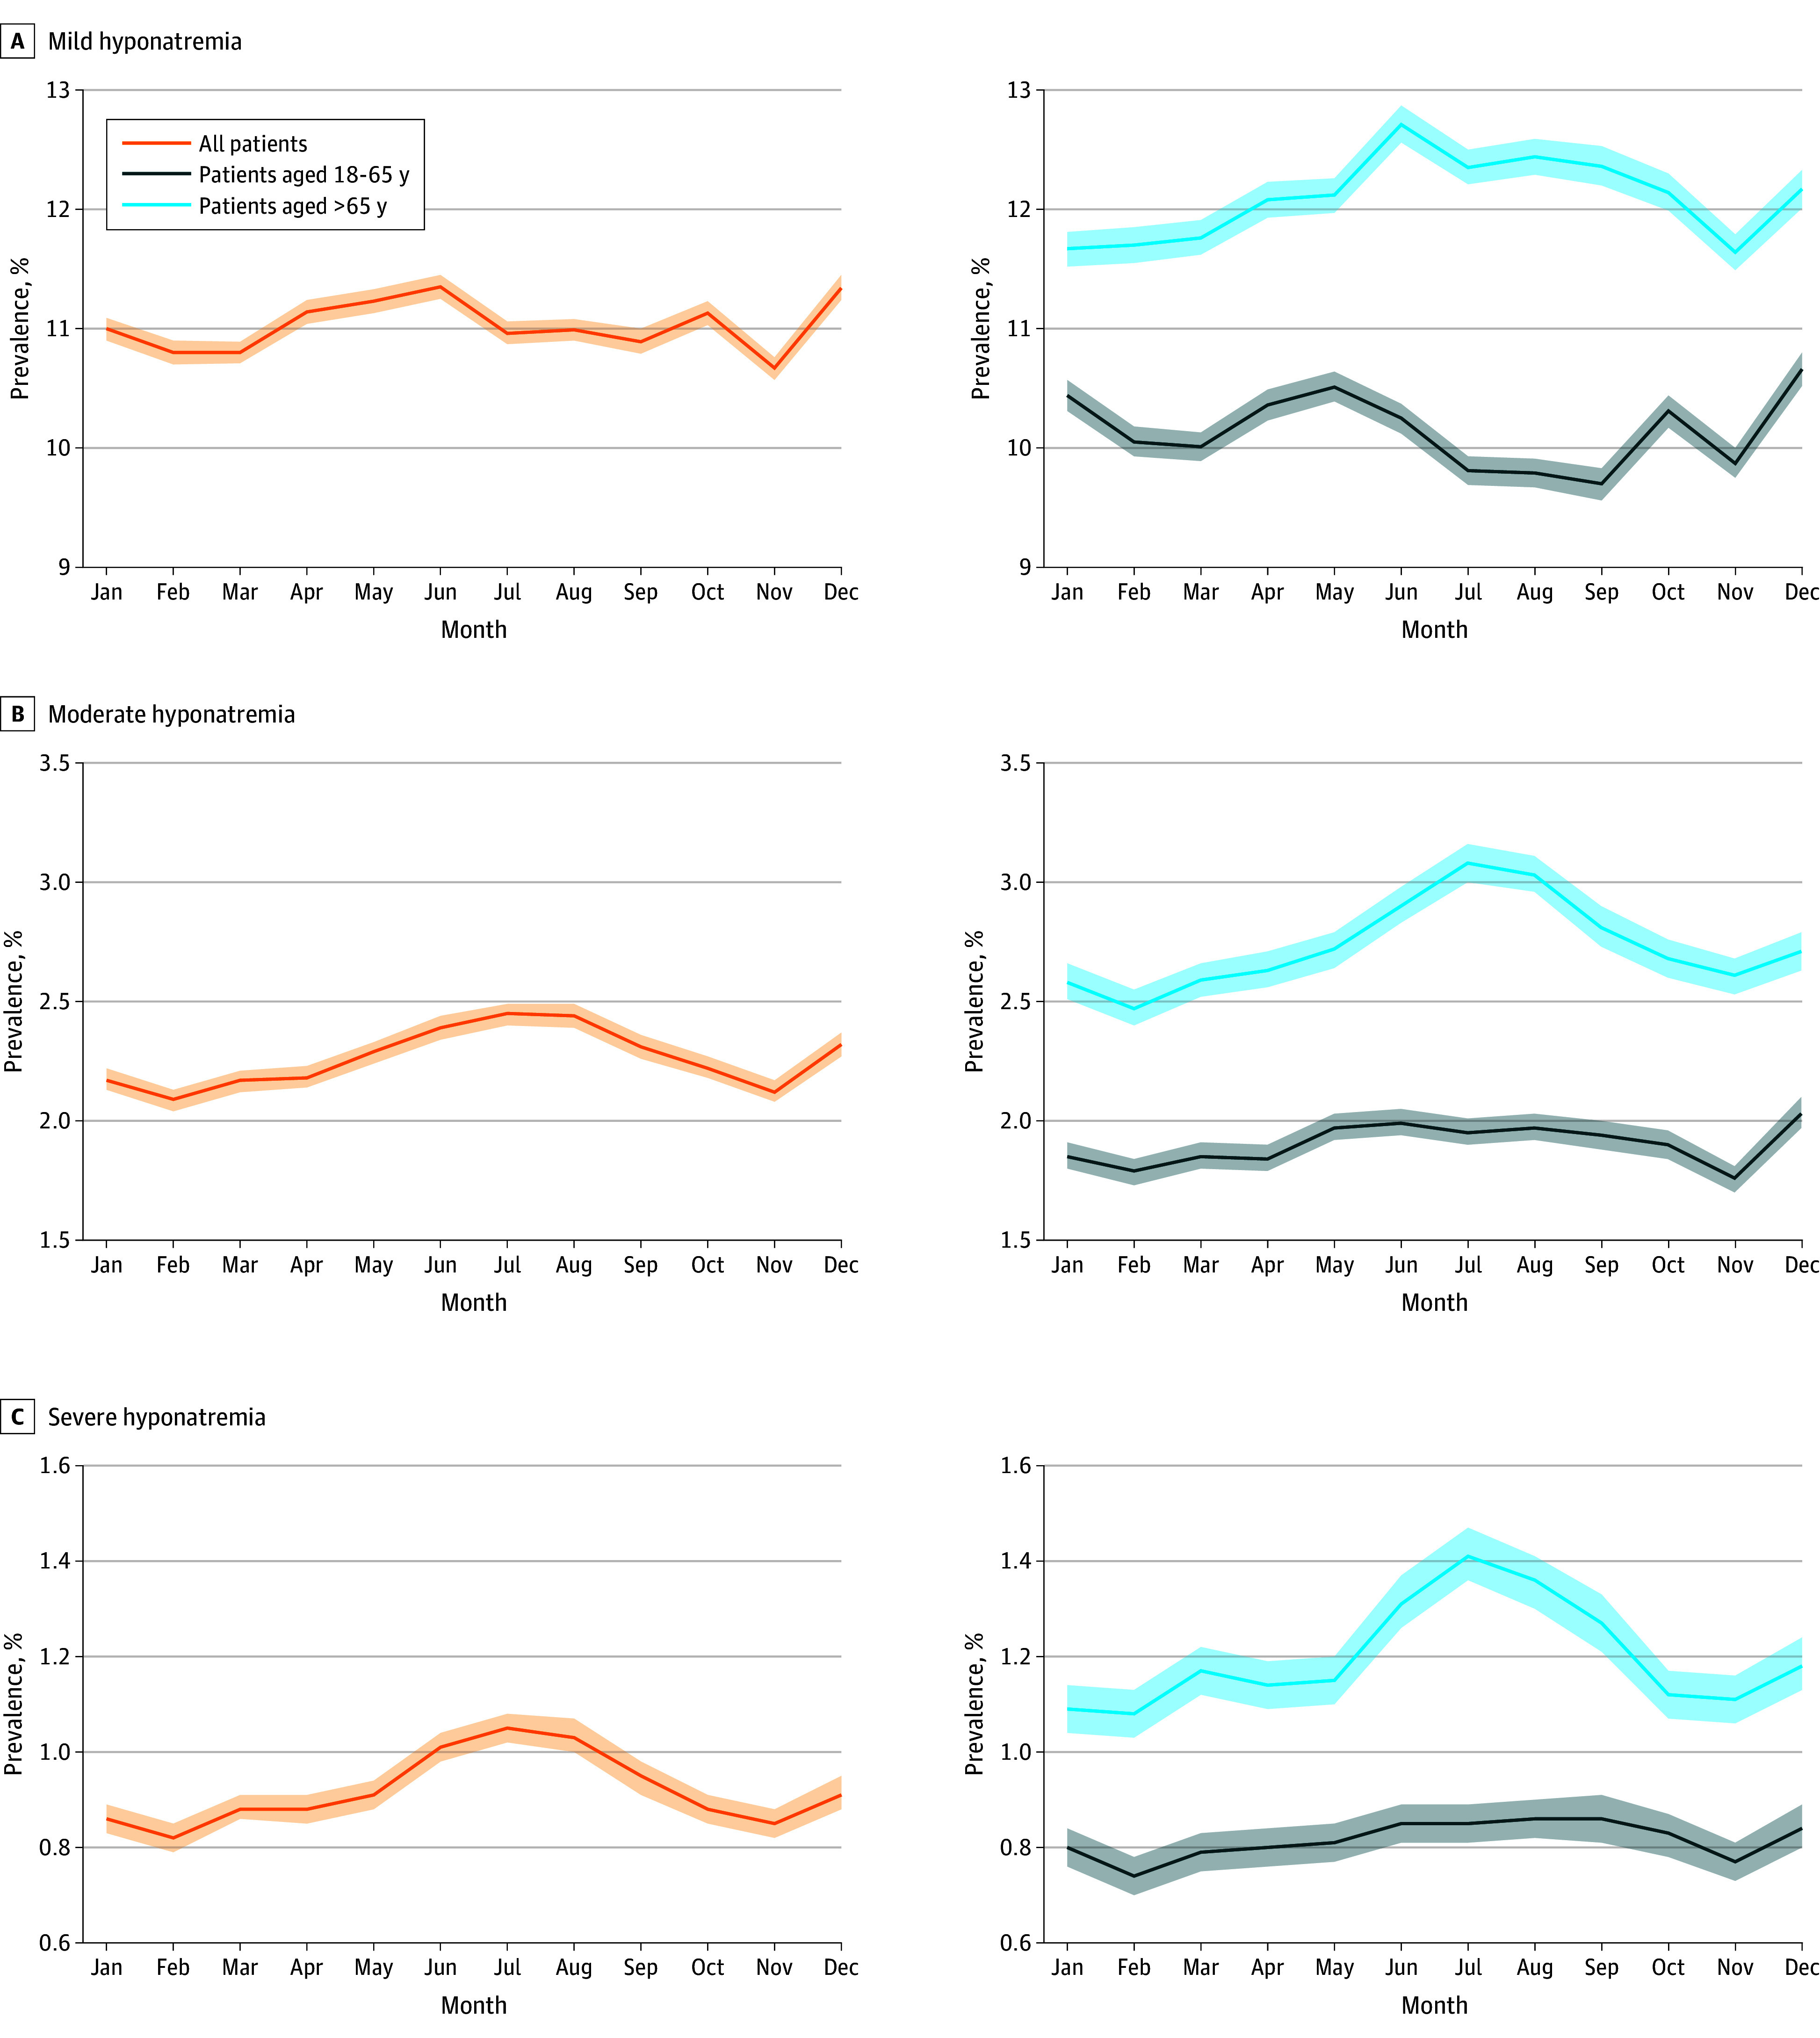
Results: A total of 7 135 688 sodium measurements from 2 028 537 hospital visits were analyzed. The mean (SD) age at admission was 57.8 (17.8) years, and 51.7% of patients were male. A clear seasonal pattern of heat-related hyponatremia was evident among older patients, especially for moderate (sodium level, 125-129 mEq/L) and severe hyponatremia (sodium level, <125 mEq/L), where the cumulative risk over a lag period of 5 days reached a maximum relative risk (RR) of 1.26 (95% CI, 1.07-1.48) when the heat index reached 30 °C, compared with the temperature at which hyponatremia occurred least frequently. Older women were disproportionately more likely to experience hyponatremia compared with older men, with a cumulative RR of 1.10 (95% CI, 1.03-1.18) at a heat index of 26 °C. The highest RR was on lag day 0 for all subgroups (older patients: RR, 1.04 [95% CI, 1.00-1.08]; moderate and severe hyponatremia in older patients: RR, 1.05 [1.01-1.10]; and older women: RR, 1.07 [95% CI, 1.01-1.12]) and significantly increased when the heat index exceeded 15 °C (RR, 1.01 [95% CI, 1.00-1.02]).
Conclusions and relevance: This cross-sectional study of patients with sodium measurements suggests that older people, especially women, were vulnerable to heat-related hyponatremia. Environmental heat was associated with an immediate exacerbation of hyponatremia. This finding highlights the importance of implementing prevention strategies to mitigate heat-related hyponatremia, as an increased burden in the future due to climate change is likely.
Conflict of interest statement
Figures


References
-
- Intergovernmental Panel on Climate Change . Climate Change 2021—The Physical Science Basis: Working Group I Contribution to the Sixth Assessment Report of the Intergovernmental Panel on Climate Change. Cambridge University Press; 2023.
MeSH terms
LinkOut - more resources
Full Text Sources
Miscellaneous
