. 2024 Dec 16;134(24):e180347.
doi: 10.1172/JCI180347.

Disrupted uromodulin trafficking is rescued by targeting TMED cargo receptors

Affiliations

Disrupted uromodulin trafficking is rescued by targeting TMED cargo receptors

Silvana Bazua-Valenti et al. J Clin Invest. .

Abstract

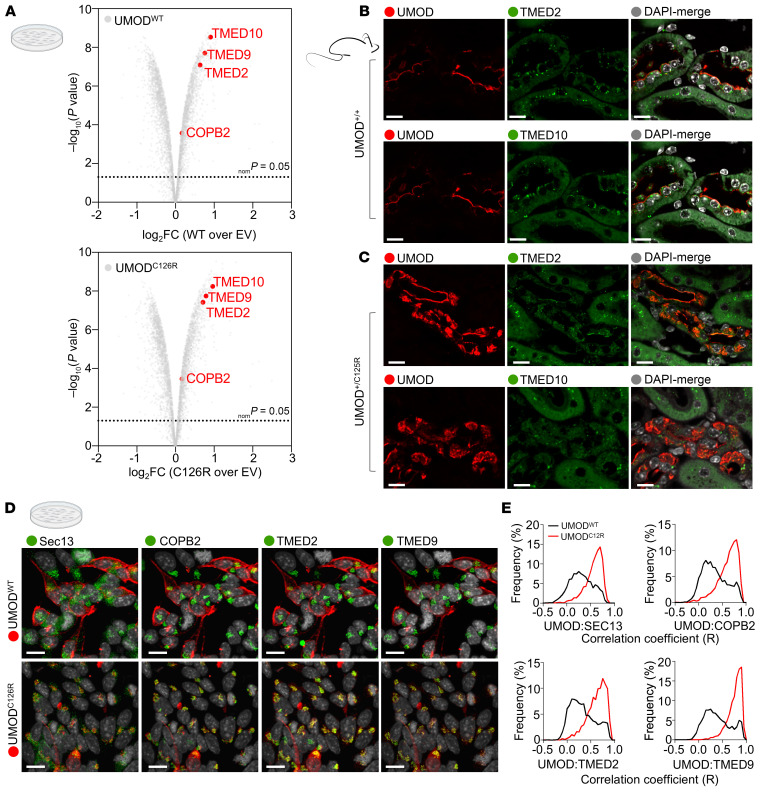
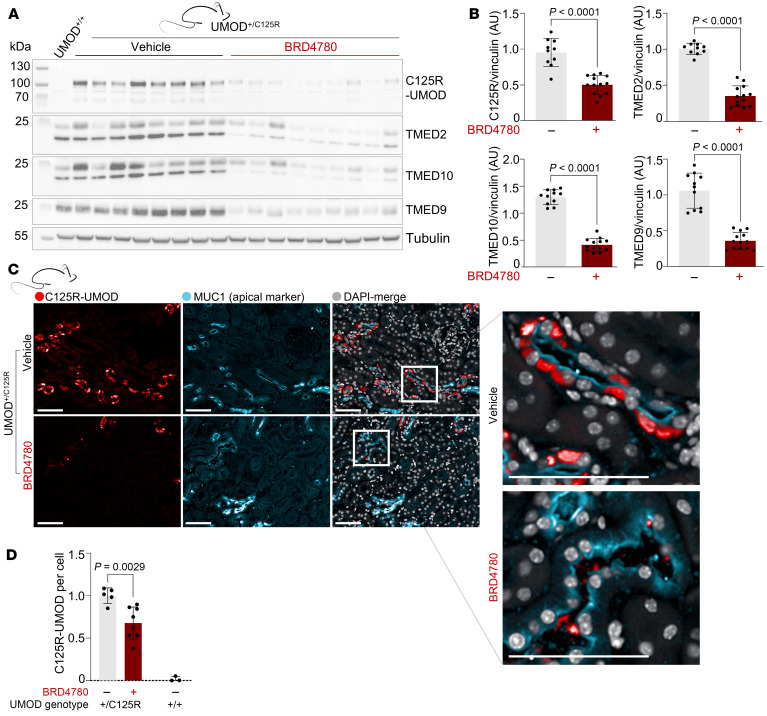
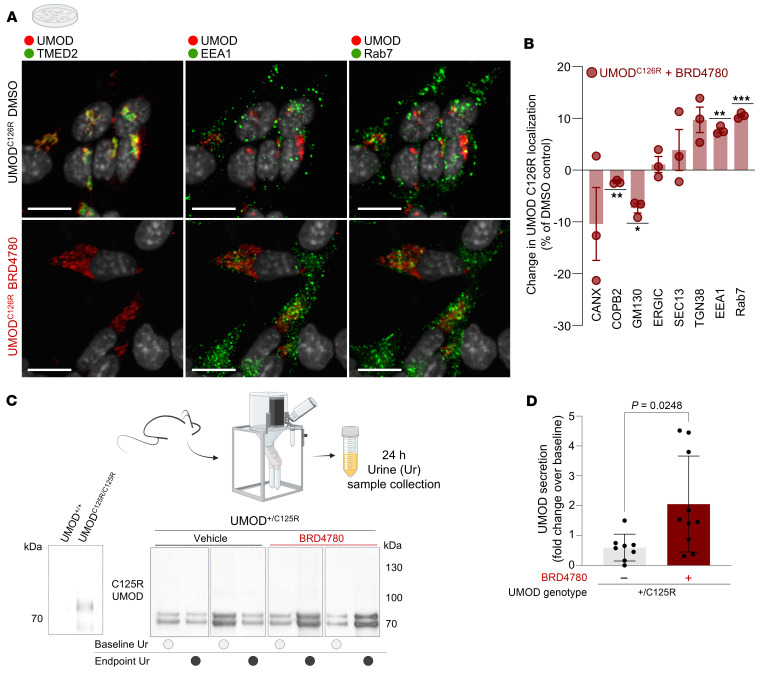
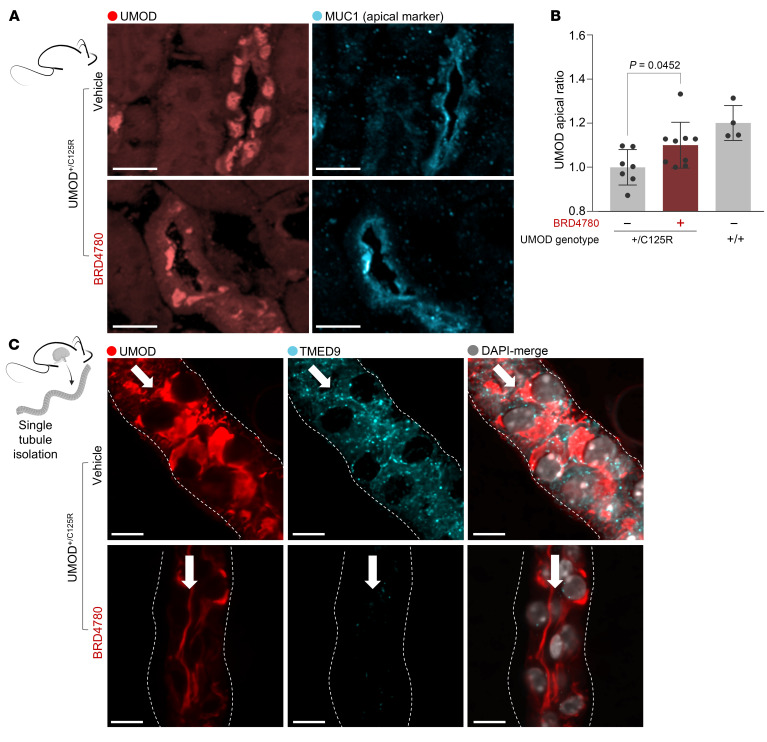
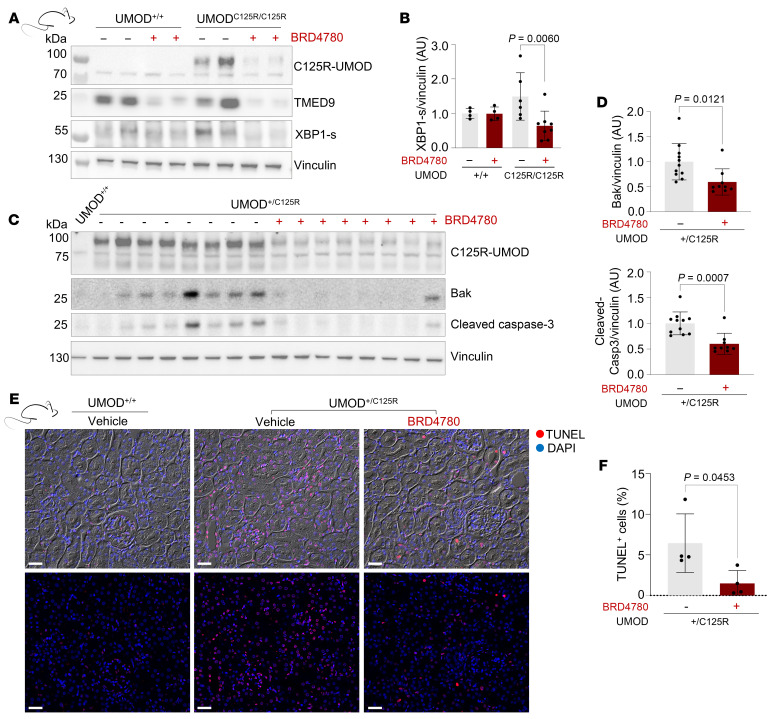
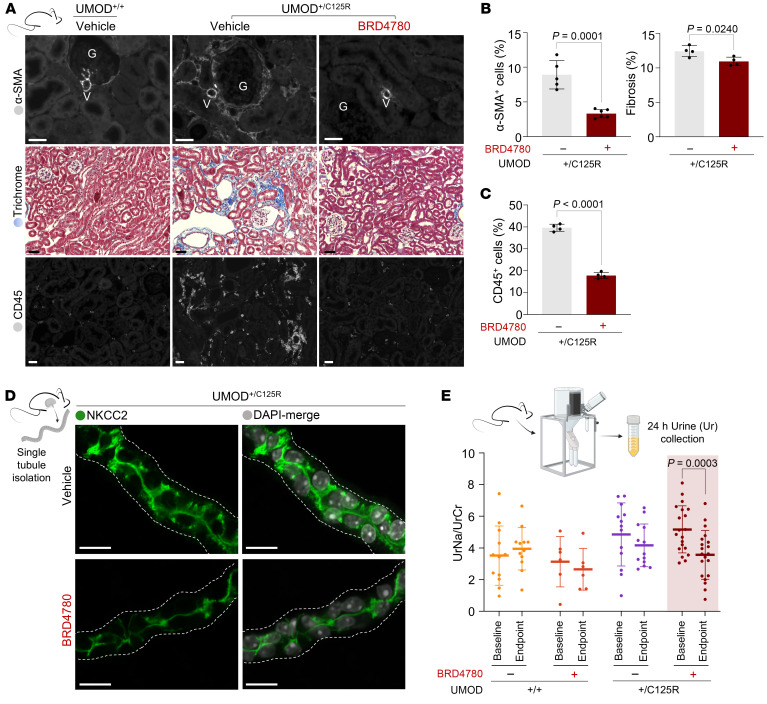
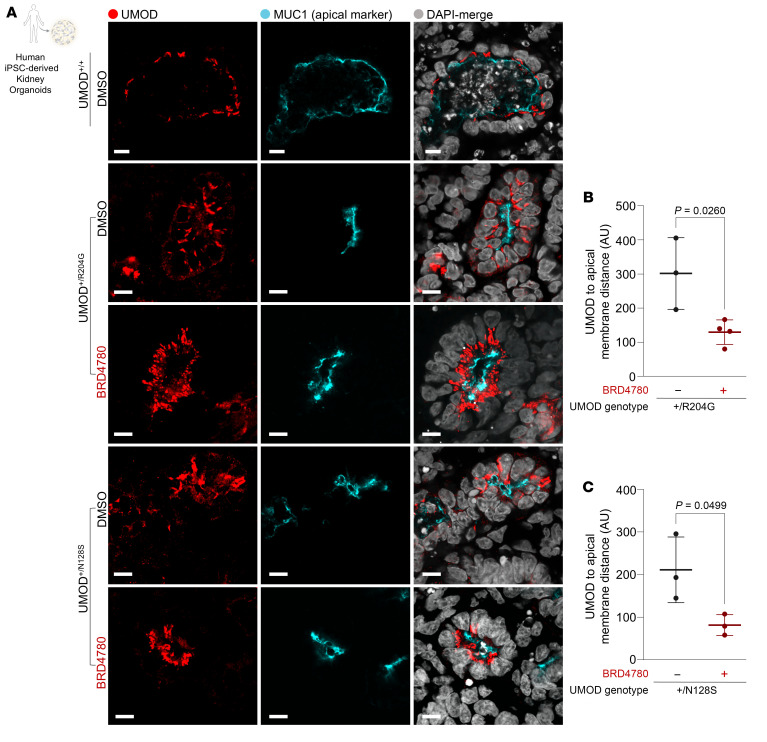
The trafficking dynamics of uromodulin (UMOD), the most abundant protein in human urine, play a critical role in the pathogenesis of kidney disease. Monoallelic mutations in the UMOD gene cause autosomal dominant tubulointerstitial kidney disease (ADTKD-UMOD), an incurable genetic disorder that leads to kidney failure. The disease is caused by the intracellular entrapment of mutant UMOD in kidney epithelial cells, but the precise mechanisms mediating disrupted UMOD trafficking remain elusive. Here, we report that transmembrane Emp24 protein transport domain-containing (TMED) cargo receptors TMED2, TMED9, and TMED10 bind UMOD and regulate its trafficking along the secretory pathway. Pharmacological targeting of TMEDs in cells, in human kidney organoids derived from patients with ADTKD-UMOD, and in mutant-UMOD-knockin mice reduced intracellular accumulation of mutant UMOD and restored trafficking and localization of UMOD to the apical plasma membrane. In vivo, the TMED-targeted small molecule also mitigated ER stress and markers of kidney damage and fibrosis. Our work reveals TMED-targeting small molecules as a promising therapeutic strategy for kidney proteinopathies.

Keywords: Genetic diseases; Nephrology; Protein misfolding; Protein traffic.


Conflict of interest statement

Conflict of interest: AG serves as a founding advisor to a NewCo launched by Atlas Venture, an agreement reviewed and managed by Brigham and Women’s Hospital, Mass General Brigham, and the Broad Institute of MIT and Harvard in accordance with their conflict of interest policies.

Figures

Figure 1
Figure 1. UMOD localizes and interacts with the TMED family of cargo receptors.
(A) Volcano plots depicting proteomes of FLAG-tagged WT UMOD (UMODWT) or mutant misfolded UMOD (UMODC126R) in HEK293T cells. Significant interactions with TMED2, TMED9, TMED10, and COPB2 (COPI protein) are indicated (red dots). Two-sample moderate t test (2 tailed). n = 3 technical replicates. EV, empty vector; FC, fold change. (B and C) Immunofluorescence images of kidney sections from 10-month-old WT (UMOD+/+) or heterozygous knockin (UMOD+/C125R) mice stained for UMOD (red), for TMED2 or TMED10 (green), and with DAPI (gray). Scale bars: 10 μm. TMED2 and TMED10 images were obtained from consecutive sections to facilitate comparison. (D) Representative immunofluorescence of AtT-20 cells stably transfected with UMODWT or UMODC126R, following fixation and the 4i protocol. Scale bars: 10 μm. (E) Histograms representing single-cell correlation coefficients between UMOD and selected secretory pathway markers.
Figure 2
Figure 2. Targeting TMEDs reduces mutant UMOD accumulation in vivo.
(A) Western blot of whole-kidney lysates from 10-month-old WT (UMOD+/+) and heterozygous knockin (UMOD+/C125R) mice treated with vehicle or BRD4780 (30 mg/kg) for 28 days. Blots were probed with a mutant-specific antibody (C125R-UMOD), or antibodies for TMED2, TMED10, and TMED9. (B) Densitometric analysis of the results in A. Statistical analysis was by unpaired 2-tailed t tests; data shown as mean ± SD, with each data point representing 1 mouse. (C) Immunofluorescence images of kidney sections from UMOD+/C125R mice treated as above and stained for C125R-UMOD (red), the apical membrane marker MUC1 (cyan), and with DAPI (gray). All scale bars: 50 μm. Insets highlight tubular mutant UMOD clearance. (D) Quantitation of C125R signal in mouse cortex, outer and inner medulla, in MUC1+ cells, analyzed via 2-way ANOVA with Bonferroni’s post hoc test. Data shown as mean ± SD, with each data point representing 1 mouse.
Figure 3
Figure 3. Targeting TMEDs promotes forward trafficking of mutant UMOD in vitro and urinary secretion in vivo.
(A) Immunofluorescence images of AtT-20 cells stably transfected with mutant UMOD (UMODC126R), treated with 5 μM BRD4780 or DMSO for 24 hours, and then processed using the 4i protocol. Scale bars: 10 μm. (B) Quantification of A. Colocalization is represented as change induced by BRD4780 compared with DMSO. Data shown as mean ± SEM from n = 3 technical replicates, analyzed by 1-sample t test against a theoretical mean of 0 (COPB2, P = 0.0069; GM130, P = 0.0147; EEA1, P = 0.0032; RAB7, P = 0.0009). Values per well represent averages from all the cells in a well (well 1: 461 cells; well 2: 911 cells; well 3: 973 cells). (C) Western blots of precipitated protein from urine of heterozygous knockin 10-month-old mice (UMOD+/C125R mice) treated with vehicle or BRD4780 (30 mg/kg) for 28 days, detecting mutant-specific C125R-UMOD. The Western blot at the far left shows specificity of the C125R-specific antibody in whole-kidney lysates from WT (UMOD+/+) and homozygous knockin (UMODC125R/C125R) mice. (D) Densitometric analysis of C. All urine samples were normalized to their baseline secretion to calculate secretion ratios. Statistical analysis by unpaired 2-tailed t test; data shown as mean ± SD, with each data point representing 1 mouse. *P < 0.05, **P < 0.01, ***P < 0.001.
Figure 4
Figure 4. Targeting TMEDs restores WT UMOD localization to the apical epithelial plasma membrane.
(A) Immunofluorescence images of kidney sections from heterozygous knockin (UMOD+/C125R) mice treated with vehicle or BRD4780 (30 mg/kg) for 28 days, stained for UMOD (red) and the apical membrane marker MUC1 (cyan). Scale bars: 25 μm. (B) Quantitation of UMOD distribution in MUC1+ cells within the cortex, expressed as the UMOD apical ratio (UMOD in MUC1 area/UMOD in intracellular area); analyzed via 2-way ANOVA with Bonferroni’s post hoc test. Data shown as mean ± SD, with each data point representing 1 mouse. (C) Immunofluorescence of single isolated TAL tubules from UMOD+/C125R mice treated as above, stained for UMOD (red), TMED9 (cyan), and with DAPI (gray). Scale bars: 10 μm. White arrows indicate the tubular lumen, and the dotted lines represent the basolateral membrane.
Figure 5
Figure 5. Therapeutic targeting of TMEDs protects tubular epithelial cells from ER stress and apoptosis.
(A) Western blots of whole-kidney lysates from WT (UMOD+/+) and homozygous knockin (UMODC125R/C125R) mice treated with vehicle or BRD4780 (30 mg/kg) for 28 days. (B) Densitometric analysis of A. Data were normalized to the mean values of the vehicle-treated UMODC125R/C125R mice and analyzed via 2-way ANOVA with Bonferroni’s post hoc test. Data shown as mean ± SD, with each data point representing 1 mouse. (C) Western blots of whole-kidney lysates from 1 UMOD+/+ mouse and heterozygous knockin (UMOD+/C125R) mice treated as above. (D) Densitometric analysis of C. Data were normalized to the mean values of the vehicle-treated UMOD+/C125R mice and analyzed by Mann-Whitney test. Data shown as mean ± SD, with each data point representing 1 mouse. (E) Immunofluorescence images of TUNEL-stained kidney cortex from 10-month-old UMOD+/+ and UMOD+/C125R mice treated as above. Top panel: Brightfield is shown as the background, TUNEL+ cells are shown in red, and DAPI is shown in blue. Bottom panel: Same image as above without brightfield. Scale bars: 20 μm. (F) Quantification of TUNEL+ cells from at least 3 cortical fields per mouse analyzed by unpaired 2-tailed t test; data shown as mean ± SD, with each data point representing 1 mouse.
Figure 6
Figure 6. Therapeutic modulation of TMEDs mitigates inflammatory infiltrates and tissue fibrosis, restoring functional sodium reabsorption in the kidney.
(A) Histological and immunofluorescence analysis of kidney sections from WT (UMOD+/+) and heterozygous knockin (UMOD+/C125R) mice treated with vehicle or BRD4780 (30 mg/kg) for 28 days. Sections were subjected to the following analyses: Top: α-Smooth muscle actin (α-SMA) immunofluorescent staining shown in gray. Scale bars: 20 μm. Middle: Masson’s trichrome staining showing collagen deposition (blue) indicative of fibrotic pathology within the renal interstitium. Scale bars: 40 μm. Bottom: CD45 immunofluorescent staining revealing leukocyte infiltration. CD45+ cells are shown in gray. Scale bars: 20 μm. (B) Quantitative analysis of fibrosis from at least 3 fields per mouse and analyzed by unpaired 2-tailed t test; data shown as mean ± SD, with each data point representing 1 mouse. Left: Quantitative assessment of α-SMA signal in the renal cortex. Right: Quantification of fibrotic areas via Masson’s trichrome staining, expressed as percentage (blue area/red area). (C) Quantification of CD45+ cells expressed as a percentage of total cells per field, from at least 3 fields per mouse and analyzed by unpaired 2-tailed t test; data shown as mean ± SD, with each data point representing 1 mouse. (D) Immunofluorescence imaging of isolated TAL tubules from UMOD+/C125R mice treated as above: NKCC2 (green) and nuclei with DAPI (gray). Scale bars: 20 μm. The white dotted line indicates the basolateral membrane. (E) Assessment of urinary electrolyte handling and 24-hour urinary sodium excretion after treatment with BRD4780. Each data point represents an individual mouse, with paired samples between baseline and endpoint indicated; linking lines were omitted for clarity. Statistical analysis was conducted using 2-way ANOVA followed by Tukey’s multiple-comparison test.
Figure 7
Figure 7. TMED-targeting compound removes intracellularly accumulated UMOD and restores apical localization of UMOD in human kidney organoids.
(A) Immunofluorescence images of kidney organoids derived from 2 ADTKD-UMOD patients and 1 healthy donor (UMOD+/+). Patient 1 harbors the p.R204G mutation (UMOD+/R204G), and Patient 2 the p.N128S mutation (UMOD+/N128S). Organoids were treated with either DMSO (control) or 10 μM BRD4780 for 72 hours. Scale bar: 10 μm. (B and C) Quantitative analysis of the spatial localization between UMOD and the apical membrane marker MUC1, assessing the distance between these signals. Each data point represents the mean of analyses from 3–4 organoid tubules. Data were analyzed by unpaired 2-tailed t test and are presented as mean ± SD.

References

    1. Bachmann S. A novel role for Tamm-Horsfall protein (uromodulin) in the renal tubule. Kidney Int. 2018;94(4):652–655. doi: 10.1016/j.kint.2018.06.023. - DOI - PubMed
    1. Devuyst O, et al. Uromodulin: from physiology to rare and complex kidney disorders. Nat Rev Nephrol. 2017;13(9):525–544. doi: 10.1038/nrneph.2017.101. - DOI - PubMed
    1. LaFavers KA, et al. Evolving concepts in uromodulin biology, physiology, and its role in disease: a tale of two forms. Hypertension. 2022;79(11):2409–2418. doi: 10.1161/HYPERTENSIONAHA.122.18567. - DOI - PMC - PubMed
    1. Bachmann S, et al. Renal effects of Tamm-Horsfall protein (uromodulin) deficiency in mice. Am J Physiol Renal Physiol. 2005;288(3):F559–F567. doi: 10.1152/ajprenal.00143.2004. - DOI - PubMed
    1. Schaeffer C, et al. Analysis of uromodulin polymerization provides new insights into the mechanisms regulating ZP domain-mediated protein assembly. Mol Biol Cell. 2009;20(2):589–599. doi: 10.1091/mbc.e08-08-0876. - DOI - PMC - PubMed