. 2024 Dec 16;18(12):e0011866.
doi: 10.1371/journal.pntd.0011866. eCollection 2024 Dec.

Transcriptome immune-regulatory differences between leprosy patients and type 1 reaction patients, before onset of symptoms

Affiliations

Transcriptome immune-regulatory differences between leprosy patients and type 1 reaction patients, before onset of symptoms

Wilian Correa-Macedo et al. PLoS Negl Trop Dis. .

Abstract

Leprosy is a chronic disease of the skin and peripheral nerves caused by Mycobacterium leprae. A major public health and clinical problem are leprosy reactions, which are inflammatory episodes that often contribute to nerve damage and disability. Type I reversal reactions (T1R) can occur after microbiological cure of leprosy and affect up to 50% of leprosy patients. Early intervention to prevent T1R and, hence, nerve damage, is a major focus of current leprosy control efforts. In a prospective study, we enrolled and collected samples from 32 leprosy patients before the onset of T1R. Whole blood aliquots were challenged with M. leprae sonicate or media and total RNA was extracted. After a three-year follow-up, the transcriptomic response was compared between cells from 22 patients who remained T1R-free and 10 patients who developed T1R during that period. Our analysis focused on differential transcript (i.e. isoform) expression and usage. Results showed that, at baseline, cells from T1R-destined and T1R-free subjects had no main difference in their transcripts expression and usage. However, the cells of T1R patients displayed a transcriptomic immune response to M. leprae antigens that was significantly different from the one of cells from leprosy patients who remained T1R-free. Transcripts with significantly higher upregulation in the T1R-destined group, compared to the cells from T1R-free patients, were enriched for pathways and GO terms involved in response to intracellular pathogens, apoptosis regulation and inflammatory processes. Similarly, transcript usage analysis pinpointed different transcript proportions in response to the in-vitro challenge of cells from T1R-destined patients. Hence, transcript usage in concert with transcript expression suggested a dysregulated inflammatory response including increased apoptosis regulation in the peripheral blood cells of T1R-destined patients before the onset of T1R symptoms. Combined, these results provided detailed insight into the pathogenesis of T1R.


Conflict of interest statement

The authors have declared that no competing interests exist.

Figures
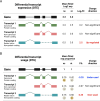
Fig 1
Fig 1. Schematic representations of differential transcript expression and differential transcript usage analyses.
(A-B) On the left side of the figures, a schematic exon-intron structure of a gene is presented (black illustrations), and three possible transcripts resulting from alternative splicing are shown as colored illustrations. Boxes indicate exons while solid straight lines indicate intronic sequences that are expected to be spliced out. Chevrons indicate introns that must be spliced out to generate alternative mature RNAs and dashed lines indicate intron retention. The right half of the figures provides hypothetical examples for the two types of testing we employed. (A) Differential expression analysis was carried out for each transcript as independent genomic read-out. Expression differences between i) T1R vs LEP baseline (non-stimulated), ii) stimulated vs non-stimulated by group (e.g. LEPst vs LEPns) or iii) differential group responses ((T1Rst vs T1Rns) vs (LEPst vs LEPns)) were tested as Log2(CPM), yielding Log2FC as effect size for expression differences. In the example, libraries presented suggestive mean gene-level expression difference in response to stimulation. At transcript-level, however, only the non-protein coding (transcript 3) showed significant up-regulation. (B) For differential transcript usage analysis, normalized transcript expression was converted to proportion usage by dividing transcript expression by its parental gene expression. Differential transcript usage effect sizes are represented as the difference of mean fitted proportion usage (PΔ) between libraries. In the example from this figure, differential transcript usage shows that despite the overall expression increase after stimulation (panel A), the canonical transcript 1 had lower usage compared to baseline favoring the usage of the non-coding transcript. The numbers inside the circles show the ranking of the transcript proportions at baseline and in the stimulated samples. In this example, there is a switch of main transcripts between the two conditions, with transcript 1 ranked as the most common in the baseline and transcript 3 in the stimulated samples. Exp: expression; ns: non-stimulated samples; st: M. leprae sonicate stimulated samples.
Fig 2
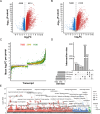
Fig 2. Transcript expression changes upon stimulation with M. leprae sonicate in whole-blood from leprosy T1R-free (LEP) and leprosy T1R-destined (T1R) individuals.
(A-B) Volcano plots of transcriptional response to stimulation for (A) the LEP and (B) the T1R groups. Transcript responses are displayed as function of Log2 fold-change (Log2FC, x-axis) and negative log10 unadjusted P-value (y-axis). Each dot corresponds to a single transcript (i.e. isoform) and vertical dashed lines show the effect size threshold for absolute Log2FC ≥ 0.5. Differentially expressed transcripts are shown as red or blue dots that indicate up- or down-regulated transcripts significant at StageR FDR ≤ 5%, respectively. Grey dots are transcripts that did not reach significance (C) Strip plot presenting the effect size differences of significant transcript changes, expressed as Log2FC, presented in panels A and B. Transcripts are ordered along the x-axis according to their Log2FC for the LEP group. Colored dots indicate three levels of transcript response differences between LEP and the T1R group (|Log2FC T1R - Log2FC LEP|) of ≤ 0.2 (red), 0.21 to 0.49 (yellow) and ≥ 0.5 (green). Their total numbers are shown on top. Light-gray dots represent non-significant transcripts and the horizontal lines mark the |Log2FC| ≥ 0.5 thresholds applied for group responses. (D) UpSet plot displaying the intersection of DET profiles in the M. leprae response by group. The bar chart at the bottom left indicates the total number of up-regulated or down-regulated transcripts for the two groups (four sets), while the bottom central panel identifies how sets intersect. The vertical upper bars indicate the corresponding intersection size (transcript counts) shown at the lower part of the graph. Connected dots indicate transcripts overlap between the T1R and LEP groups. Unconnected dots highlight group specific transcripts. (E) Manhattan plot for the results of pathway and GO term enrichment tests on 2919 genes implicated by 5639 up-regulated DET for both the T1R and LEP groups (panel D). The y-axis indicates the negative Log10 for BH adjusted P-values while the tested terms are arranged along the x-axis. The horizontal dashed line represents the 10% FDR cut-off for significant pathways/GO terms. Dots are sized as a function of the number of DET-derived genes in a term and colors represent the database from which the terms were obtained.
Fig 3
Fig 3. Following stimulation with M. leprae sonicate, cells from T1R-destined leprosy patients show increased transcriptional inflammatory responses relative to T1R-free leprosy patients.
(A) Volcano plot of significant differential transcriptional response to M. leprae sonicate between the T1R and LEP groups detected via interaction analysis. Contrasting the Log2FC from T1R against LEP, for 23,560 tested transcripts, we identified 381 transcripts with significant differential response between the two groups. Light gray dots represent transcripts with non-significant response differences between groups, purple dots indicate significant responses with negative value for the contrast (Log2FCT1R - Log2FCLEP), while green dots indicate a significant positive value. (B) Strip plot categorizing significantly different responses to M. leprae of the T1R and LEP groups for the 381 significant transcripts from panel A. Dark grey dots at the center represent 381 transcripts for the LEP group response sorted by increasing Log2FCLEP values. They serve as reference for the significantly different response by T1R. Green or purple dots represent the Log2FCT1R responses that underlie the positive or negative Log2FC for the contrast Log2FCT1R - Log2FCLEP observed in panel A, respectively. (C) Break-out focus of transcripts that were up-regulated by both the T1R and LEP groups with stronger up-regulation by T1R. Labeled dots are examples for increased T1R response by transcripts belonging to genes with immune/inflammatory functions. (D) Manhattan plot for the results of pathway and GO term enrichment tests on genes implicated by the 145 DET from panel C. The y-axis indicates the negative Log10 for BH-adjusted P-values while the tested terms are arranged along the x-axis. The horizontal dashed line represents the 10% FDR cut-off for significant pathways/GO terms. Dots are sized as a function of the gene number in a term and colors represent the database from which the terms were obtained. Immune response and inflammation terms are identified. Terms highlighted in red were selected to be further characterized in panel E. (E) Heatmap for 29 transcripts with significant differential transcript upregulation in response to M. leprae sonicate between T1R and LEP patients. The genes are enriched in the terms I) inflammatory response, II) response to IFN-γ, and III) NOD-like receptor signaling pathway. Rows represent the same transcript across the three main terms. Each term column is composed of two sub-columns representing the stimulation responses for the T1R or LEP groups. Colors represent the response intensity of transcripts as captured by Log2FCT1R and Log2FCLEP values, with stronger responses being depicted by scales of red. Transcripts were arranged along the y-axis by increasing Log2FC observed for the T1R group. For each row, transcripts that were not DET for a group or are not part of the term were assigned zero as Log2FC. The right most column identifies the transcript class.
Fig 4
Fig 4. Significant differences in transcript usage in response to M. leprae sonicate between the cells from the T1R and LEP groups.
(A) Strip plot for 326 transcripts with significant usage differences for |PΔ T1R –PΔ LEP| ≥ 0.07. This plot presents the distribution of the mean fitted proportion difference (PΔ) in transcript usage by contrasting M. leprae sonicate stimulated against non-stimulated samples, for each group, and highlights the extent of differences between groups. Transcripts are represented by dots and ordered along the x-axis according to increasing PΔ values for the LEP group. Light gray dots represent transcripts with non-significant PΔ for both groups and horizontal lines mark the | PΔ | ≥ 0.07 thresholds. Differentially used transcripts (DUT) for LEP are depicted as dark-grey dots and appear as a continuous curve in the center part of the graph while green dots display the PΔ for the T1R group response. Transcripts identified by black gene symbols are involved in immune/inflammatory/apoptotic processes, while red symbols display examples selected to show details of transcript usage in panels B to D. (B-D) Boxplots presenting the fitted proportion usage for transcripts from three genes that encode regulators of the NF-κB signaling pathway: (B) COMMD6, (C) NKIRAS1 and (D) NLRP2. Fitted proportions are shown as dots representing values for each subject. Open boxes represent distribution for non-stimulated samples, while closed boxes refer to M. leprae sonicate stimulation (LEPst and T1Rst). Transcript IDs are displayed to the right of each plot and symbols shown below the transcript IDs identify transcripts that were DUT for the baseline (light blue circle), the response to the M. leprae sonicate challenge by group (black and orange squares) and/or the interaction analysis (blue triangle). PΔ = difference of transcript proportion between the stimulated vs non-stimulated cells by group. PΔ T1R –PΔ LEP = comparison of the PΔ from T1R vs LEP (interaction).
Fig 5
Fig 5. Transcripts displaying both differential expression and usage after M. leprae sonicate stimulation highlight the altered transcriptome of T1R-destined patients.
(A) Barplot summarizing the number of transcripts that were differentially expressed (DE), differentially used (DU) or both for the contrasts indicated on the x-axis. (B) Heatmap for the mean Log2FC (DE) and mean PΔ (DU) for transcripts that were detected with differential expression and usage responses between groups. Shades of red and blue represent, respectively, positive and negative Log2FC values for individual group differential expression. Shades of yellow and magenta map the spectrum of positive to negative PΔ values for differential usage. Rows were sorted by Log2FC T1R displayed in the first column. All 17 overlapping significant transcripts are labeled by ENSEMBL transcript ID and their parental gene symbol. The left-most column contains annotations for coding potential of each transcript or the type of non-coding transcript.

Similar articles

References

    1. Scollard DM, Adams LB, Gillis TP, Krahenbuhl JL, Truman RW, Williams DL. The continuing challenges of leprosy. Clin Microbiol Rev. 2006;19(2):338–81. doi: 10.1128/CMR.19.2.338-381.2006 ; PubMed Central PMCID: PMC1471987. - DOI - PMC - PubMed
    1. World Health Organization = Organisation mondiale de la S. Global leprosy (Hansen disease) update, 2020: impact of COVID-19 on global leprosy control–Situation de la lèpre (maladie de Hansen) dans le monde, 2020: impact de la COVID-19 sur les activités mondiales de lutte contre la lèpre. Weekly Epidemiological Record = Relevé épidémiologique hebdomadaire. 2021;96(36):421–44.
    1. Fava V, Orlova M, Cobat A, Alcaïs A, Mira M, Schurr E. Genetics of leprosy reactions: an overview. Mem Inst Oswaldo Cruz. 2012;107 Suppl 1:132–42. Epub 2013/01/11. doi: 10.1590/s0074-02762012000900020 . - DOI - PubMed
    1. Geluk A. Correlates of immune exacerbations in leprosy. Semin Immunol. 2018;39:111–8. Epub 20180624. doi: 10.1016/j.smim.2018.06.003 . - DOI - PubMed
    1. Teles RMB, Lu J, Tió-Coma M, Goulart IMB, Banu S, Hagge D, et al.. Identification of a systemic interferon-γ inducible antimicrobial gene signature in leprosy patients undergoing reversal reaction. PLoS Negl Trop Dis. 2019;13(10):e0007764. Epub 2019/10/11. doi: 10.1371/journal.pntd.0007764 ; PubMed Central PMCID: PMC6805014. - DOI - PMC - PubMed