Review
. 2024 Dec 16;20(12):e1012767.
doi: 10.1371/journal.ppat.1012767. eCollection 2024 Dec.

Climate change and Vibrio vulnificus dynamics: A blueprint for infectious diseases

Affiliations
Review

Climate change and Vibrio vulnificus dynamics: A blueprint for infectious diseases

Jane M Jayakumar et al. PLoS Pathog. .

Abstract

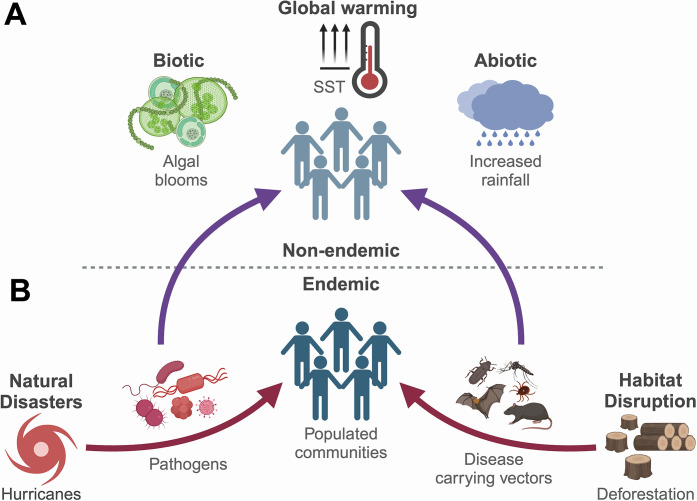
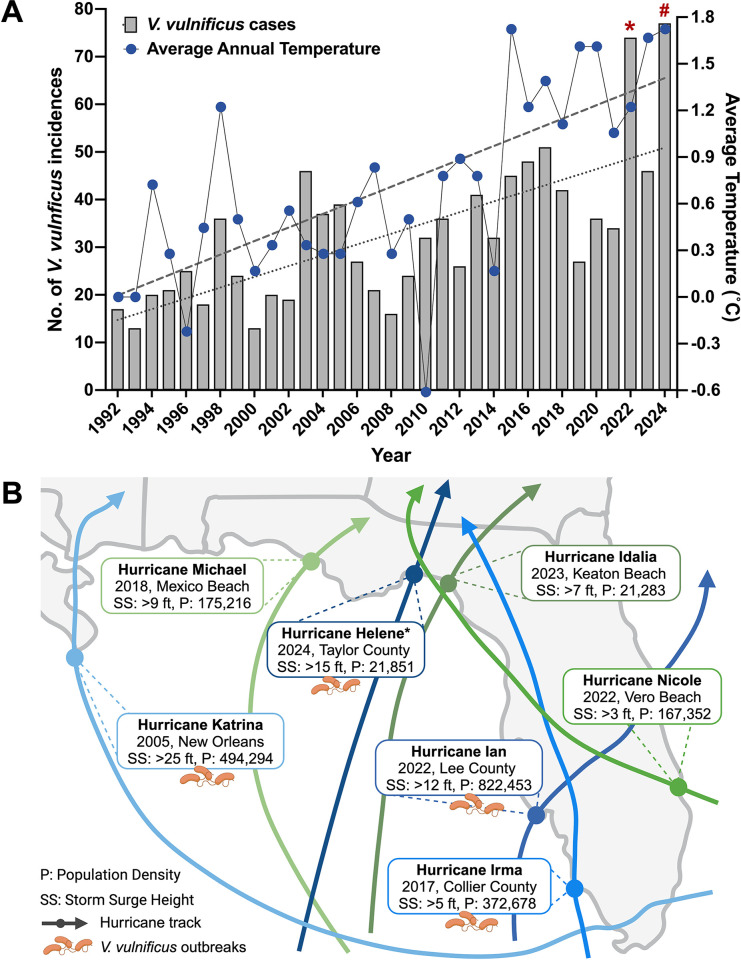
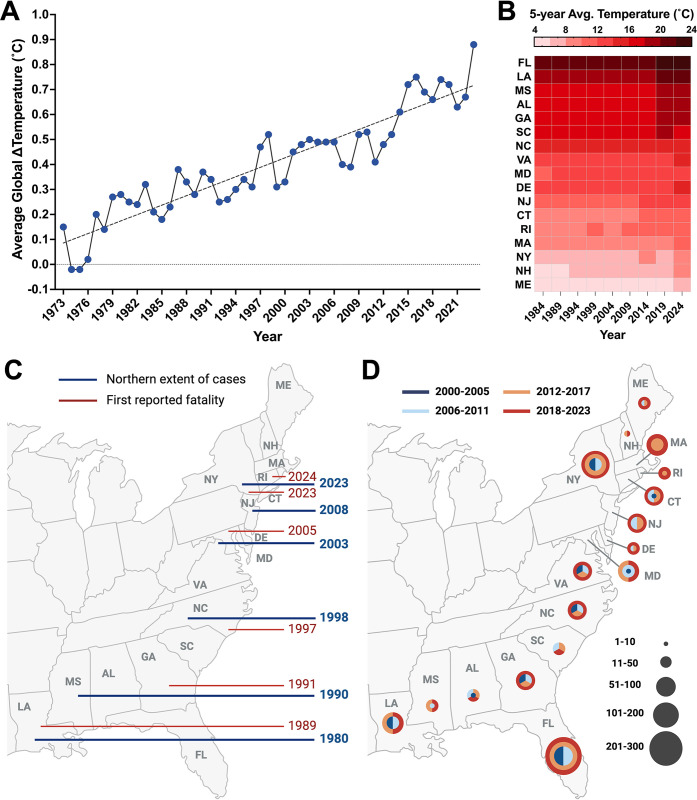
Climate change is having increasingly profound effects on human health, notably those associated with the occurrence, distribution, and transmission of infectious diseases. The number of disparate ecological parameters and pathogens affected by climate change are vast and expansive. Disentangling the complex relationship between these variables is critical for the development of effective countermeasures against its effects. The pathogen Vibrio vulnificus, a naturally occurring aquatic bacterium that causes fulminant septicemia, represents a quintessential climate-sensitive organism. In this review, we use V. vulnificus as a model organism to elucidate the intricate network of interactions between climatic factors and pathogens, with the objective of identifying common patterns by which climate change is affecting their disease burden. Recent findings indicate that in regions native to V. vulnificus or related pathogens, climate-driven natural disasters are the chief contributors to their disease outbreaks. Concurrently, climate change is increasing the environmental suitability of areas non-endemic to their diseases, promoting a surge in their natural populations and transmission dynamics, thus elevating the risk of new outbreaks. We highlight potential risk factors and climatic drivers aggravating the threat of V. vulnificus transmission under both scenarios and propose potential measures for mitigating its impact. By defining the mechanisms by which climate change influences V. vulnificus disease burden, we aim to shed light on the transmission dynamics of related disease-causing agents, thereby laying the groundwork for early warning systems and broadly applicable control measures.


Conflict of interest statement

The authors have declared that no competing interests exist.

Figures

Fig 1
Fig 1. Influence of climate change on infectious disease burden.
(A) Non-endemic. Climate change driven alterations in biotic, abiotic, or weather patterns improves the ecological suitability of non-endemic areas resulting in increased proliferation of pathogens or their vectors and the spatiotemporal expansion of their diseases. (B) Endemic. In regions native to pathogens or their vectors, natural disasters or habitat disruptions force their increased interaction with hosts, particularly in densely populated areas, resulting in severe disease outbreaks. Arrows indicate direction of disease transmission. Created in BioRender. Almagro-Moreno, S. (2024) https://BioRender.com/j65b451.
Fig 2
Fig 2. V. vulnificus disease burden in Florida.
(A) Relationship between V. vulnificus cases (gray bars; left y-axis) and average annual temperatures (blue circles; right y-axis) in Florida. Annual V. vulnificus case counts up to October 2024 were retrieved from the Florida DoH Reportable Disease Frequency Report. Average annual temperatures (°C) were retrieved from the Climate at a Glance, Statewide Time Series database up to August 2024, and temperatures relative to the 1992 mean were plotted. Trendlines for V. vulnificus cases (dotted line) and average temperatures (dashed line) were generated using simple linear regression. Significant increase in V. vulnificus cases (+1.130 cases/year; p < 0.0001) and average temperatures (+0.0437°C/year; p < 0.0001) were observed. Correlation between the 2 variables, measured using Pearson R Correlation analysis, was found to be positive and significant (r = 0.59; p < 0.001). *Indicates abnormal increase in cases due to Hurricane Ian. #Indicates abnormal increase in cases due to Hurricane Helene. (B) Storm paths of hurricanes that recently impacted Florida and the Gulf of Mexico. Those that resulted in V. vulnificus outbreaks are colored in blue. Year and region of impact, storm surge height (SS), and population density (P) are indicated. Hurricane tracks were obtained from National Weather Service database and demographic information from the US Census Bureau. *Indicates cases observed outside the region of landfall. Created in BioRender. Almagro-Moreno, S. (2024) https://BioRender.com/w21e424.
Fig 3
Fig 3. Spatiotemporal distribution of pathogenic Vibrio spp.
(A) Annual average global temperatures relative to the 19th century (1901–2000) average. Trendline (dashed line) was generated using simple linear regression and indicates a significant increase in the temperature (+0.013°C/year; p < 0.0001) over 50 years. Temperature data were retrieved from Climate at a Glance, Global Time Series in the National Center for Environmental Information database. (B) Temporal trends in average annual temperature along the Gulf and Atlantic Coasts of the US Heat map represents five-year averages of annual temperatures (°C) per state for the following time periods: 1981–1984, 1985–1989, 1990–1994, 1995–1999, 2000–2004, 2005–2009, 2010–2014, 2015–2019, 2020–2024. X-axis indicates the fifth year for each time period. Annual temperatures per state were retrieved from the Climate at a Glance, Statewide Time Series database up to August 2024. (C) Geographical distribution of V. vulnificus cases across Eastern USA. The northern extent of V. vulnificus infections from non-foodborne sources has expanded from latitude 32°N in 1990 to >41°N by 2023. Blue lines indicate year of the northernmost V. vulnificus cases and red lines first reported fatalities. Northern extent of cases were adapted and modified from Archer and colleagues [17] and case fatalities were retrieved from data reported to the CDC and regional health departments. Created in BioRender. Almagro-Moreno, S. (2024) https://BioRender.com/u42n067. (D) Geographical distribution of Vibriosis cases (caused by any species of the Vibrionaceae family, other than toxigenic V. cholerae O1 or O139) in Eastern USA. Annual number of Vibriosis cases per state was retrieved from the CDC Vibrio Surveillance System (2000–2018), Cholera and Other Vibrio Illness Surveillance (COVIS) database (2009–2015), and WONDER Annual Tables of Infectious Diseases and Conditions database (2016–2023). For each state, average Vibriosis cases per 6-year bracket (dark blue, 2000–2005; light blue, 2006–2011; orange, 2012–2017; red, 2018–2023) are depicted as circles, with increasing radii indicating increase in average cases. Year brackets where change in average cases remains within a specified range are represented as parts of a circle. If the average number of Vibriosis cases for 2 consecutive years within a 6-year bracket was ≤1, the average for that bracket was considered as 0 and not represented on the map. Created in BioRender. Almagro-Moreno, S. (2024) https://BioRender.com/m68j476.

Similar articles

Cited by

References

    1. COP26 Special Report on Climate Change and Health: the Health Argument for Climate Action [Internet]. 2021. Available from: https://www.who.int/publications/i/item/9789240036727.
    1. Romanello M, Napoli CD, Green C, Kennard H, Lampard P, Scamman D, et al.. The 2023 report of the Lancet Countdown on health and climate change: the imperative for a health-centred response in a world facing irreversible harms. Lancet. 2023;402(10419):2346–94. doi: 10.1016/S0140-6736(23)01859-7 - DOI - PMC - PubMed
    1. Hess J, Boodram LG, Paz S, Stewart Ibarra AM, Wasserheit JN, Lowe R. Strengthening the global response to climate change and infectious disease threats. BMJ. 2020;371:m3081. doi: 10.1136/bmj.m3081 - DOI - PMC - PubMed
    1. Ebi KL, Ogden NH, Semenza JC, Woodward A. Detecting and Attributing Health Burdens to Climate Change. Environ Health Perspect. 2017;125(8):085004. doi: 10.1289/EHP1509 - DOI - PMC - PubMed
    1. Mora C, McKenzie T, Gaw IM, Dean JM, von Hammerstein H, Knudson TA, et al.. Over half of known human pathogenic diseases can be aggravated by climate change. Nat Clim Chang. 2022;12(9):869–75. doi: 10.1038/s41558-022-01426-1 - DOI - PMC - PubMed

MeSH terms