. 2025 Feb;12(6):e2410525.
doi: 10.1002/advs.202410525. Epub 2024 Dec 16.

Dipeptidyl Peptidase 4 (DPP4) Exacerbates Osteoarthritis Progression in an Enzyme-Independent Manner

Affiliations

Dipeptidyl Peptidase 4 (DPP4) Exacerbates Osteoarthritis Progression in an Enzyme-Independent Manner

Xinyu Li et al. Adv Sci (Weinh). 2025 Feb.

Abstract

Chondrocyte senescence is a key driver of osteoarthritis (OA). Mitochondrial dysfunction and oxidative stress can induce chondrocyte senescence. However, the specific mechanisms by which senescence contributes to OA progression are not fully understood. Here, it is attested that Dipeptidyl peptidase 4 (DPP4) is significantly upregulated in osteoarthritic chondrocytes in both humans and mice. DPP4 promotes oxidative stress and cellular senescence in chondrocytes through excessive mitochondrial fission in an enzyme-independent manner. Intra-articular injection of adeno-associated virus 2 to upregulate DPP4 in chondrocytes promotes post-traumatic and aging-induced OA in mice in an enzyme-independent manner. Mechanistically, DPP4 competitively binds to Myosin heavy chain 9 (MYH9), interfering with its E3 ubiquitin ligase Carboxyl terminus of Hsc70-interacting protein (CHIP), and thereby upregulates MYH9 expression. Finally, a small molecule, 4,5-Dicaffeoylquinic acid is identified, which disrupts the interaction between DPP4 and MYH9, thereby ameliorating post-traumatic and aging-induced OA in mice caused by DPP4 upregulation. The study indicates that the non-enzymatic activity of DPP4 is a promising target for OA treatment.

Keywords: DPP4; MYH9; mitochondrial dynamics; osteoarthritis; senescence.


Conflict of interest statement

The authors declare no conflict of interest.

Figures
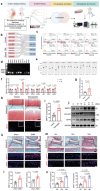
Figure 1
Figure 1
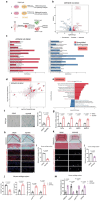
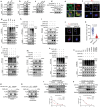
DPP4 is upregulated in osteoarthritic cartilage. a) Workflow for the discovery of DPP4 in OA. GSEA analysis was performed on eight RNA‐seq datasets comparing OA and none‐OA cartilage from the GEO database. Gene families present in each gene set were identified as intersecting gene families. Subsequent in vitro and in vivo experiments were conducted to validate the DPP family. b) The Sankey diagram shows intersecting gene families from RNA‐seq data of human, rat, and mouse. The image was generated by identifying the intersecting gene families enriched from the DEGs in each RNA‐seq dataset. c) GSEA analysis of the DPP family members from different RNA‐seq datasets. d) Agarose gel electrophoresis displays the expression of various genes from the DPP family in C28/I2 human chondrocytes. e) Relative expression levels of different DPP family genes in RNA‐seq data of human OA (n = 4) versus healthy (n = 3) cartilage (GSE 168505). f RT‐qPCR analysis of the expression of different DPP family genes in primary chondrocytes treated with PBS or IL‐1β for 24 h using Gapdh as the reference gene (n = 3, biologically independent samples). g) RT‐qPCR analysis of DPP4 expression in intact and damaged cartilage regions from the same OA patient (n = 6, biologically independent samples). h) Safranin‐O/fast green staining (upper images, scale bar = 500 µm) and IF (lower images, scale bar = 50 µm) of intact and damaged cartilage from the same OA patient. i) Quantitative analysis of the proportion of DPP4‐positive cells in the IF results from (h) (n = 6, biologically independent samples). j) Protein expression of MMP13, COL2A1, DPP4, and GAPDH in intact and damaged cartilage from the same patient (n = 3, biologically independent samples). k) Safranin‐O/fast green staining (scale bar = 250 µm) and IF (scale bar = 20 µm) analysis of knee joints from Sham and DMM surgery mice. l) Quantitative analysis of the proportion of MMP13/DPP4‐positive cells in the IF results from (k) (n = 6, biologically independent samples). m) Safranin‐O/fast green staining (scale bar = 250 µm) and IF (scale bar = 20 µm) analysis of knee joints from 6‐, 12‐, and 19‐month‐old mice. n) Quantitative analysis of the proportion of p16INK4a/DPP4‐positive cells in the IF results from (m) (n = 6, biologically independent samples). Two‐way analysis of variance (ANOVA) followed by Sidak correction for multiple comparisons is used for (f). Two‐tailed t‐tests are used for (g, i, and l) panels. One‐way analysis of variance (ANOVA) followed by Sidak correction for multiple comparisons is used for (n). Quantitative data are shown as mean ± s.d. Exact p‐values are shown in the figures.
Figure 2
Figure 2
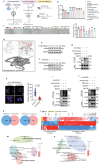
DPP4 promotes oxidative stress and senescence in chondrocytes. a) Schematic diagram of the experimental design. RNA‐seq and proteomics were performed on C28/I2 cells transfected with either OENC or DPP4OE plasmids, followed by differential pathway analysis. ScRNA‐seq of cartilage from OA patients in public databases were clustered based on high and low DPP4 expression, and pathway analysis was conducted on these clusters. b) Volcano plot of RNA‐seq data from C28/I2 cells transfected with DPP4OE (overexpression) or OENC plasmids (| log2 fold change | >0.5, FDR < 0.05).c) Bar plots show representative Gene Ontology terms and pathways of upregulated and downregulated DEGs between C28/I2 cells transfected with OENC and DPP4OE plasmids. d) Combined RNA‐seq and proteomics analysis in C28/I2 cells transfected with OENC and DPP4OE plasmids. e) Gene set variation analysis (GSVA) of the scRNA‐seq dataset (GSE169454) comparing DPP4high cells with DPP4low cells from cartilage samples of patients with OA. f) SA‐β‐gal staining and quantification of positively stained cells in primary mouse chondrocytes transfected with OENC and Dpp4OE plasmids (scale bar = 20 µm) (n = 5, biologically independent samples). g) RT‐qPCR analysis showing the relative expression levels of Tnfa, Il‐6, Mmp3, and Mmp13 in primary mouse chondrocytes transfected with OENC and Dpp4OE plasmids, using Gapdh as the reference gene (n = 3, biologically independent samples). h) Safranin‐O/fast green staining (upper images, scale bar = 250 µm, lower images, scale bar = 50 µm) and IF analysis (scale bar = 20 µm) of mouse cartilage explants transfected with OENC and Dpp4OE lentivirus. i) Quantification of Safranin‐O positive areas in (h) (n = 5, biologically independent samples). j) Quantification of MMP13, COL2A1, p16INK4a, and γH2AX positive cells or regions in the IF results from (h) (n = 5, biologically independent samples). k) Safranin‐O/fast green staining (upper images, scale bar = 500 µm, lower images, scale bar = 100 µm) and IF analysis (scale bar = 50 µm) of human cartilage explants transfected with OENC and DPP4OE lentivirus. l) Quantification of Safranin‐O positive areas in (k) (n = 5, biologically independent samples). m) Quantification of MMP13, COL2A1, p16INK4a, and γH2AX positive cells in the IF results from (k) (n = 5, biologically independent samples). Two‐way analysis of variance (ANOVA) followed by Sidak correction for multiple comparisons is used for (g, j, and m). Two‐tailed t‐tests are used for (f, i, j, and l) panels. Quantitative data are shown as mean ± s.d. Exact p‐values are shown in the figures.
Figure 3
Figure 3
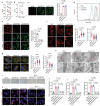
DPP4 promotes mitochondrial fission in chondrocytes. a) Enzyme activity of DPP4 in intact and damaged cartilage from OA patients (n = 16, biologically independent samples). b) Enzyme activity of DPP4 in primary mouse chondrocytes treated with vehicle or 10 ng mL−1 IL‐1β for 24 h (n = 6, biologically independent samples). c) IF assay and quantification of DCFH‐DA signal in primary mouse chondrocytes transfected with OENC, Dpp4OE‐WT, or Dpp4OE‐MUT plasmids (scale bar = 50 µm) (n = 5, biologically independent samples). d) Flow cytometry detection of DCFH‐DA signal in primary mouse chondrocytes transfected with OENC, Dpp4OE‐WT, or Dpp4OE‐MUT plasmids. e) IF assay and quantification of mitochondrial membrane potential in primary mouse chondrocytes transfected with OENC, Dpp4OE‐WT, or Dpp4OE‐MUT plasmids (scale bar = 20 µm) (n = 5, biologically independent samples). f) Mitotracker staining and quantitative analysis of the mitochondrial number and mean branch length in regions of interest (ROI) in primary mouse chondrocytes transfected with OENC, Dpp4OE‐WT, or Dpp4OE‐MUT plasmids (upper images, scale bar = 5 µm, lower images, scale bar = 2 µm) (n = 5, biologically independent samples, 100 cells per group). For each sample, cells were randomly selected, and a 15Í20 µm region was chosen as the ROI within each cell. Quantitative analysis was performed using the mitochondrial analyzer plugin in Image J. g) IF and quantitative analysis of DRP1/OPA1 and mitochondrial colocalization in primary mouse chondrocytes transfected with OENC, Dpp4OE‐WT, or Dpp4OE‐MUT plasmids (scale bar = 2 µm) (n = 5, biologically independent samples, 100 cells per group). Colocalization quantitative analysis was performed using the Coloc 2 plugin in Image J. h) Transmission electron microscopy images of primary mouse chondrocytes transfected with OENC, Dpp4OE‐WT, or Dpp4OE‐MUT plasmids (upper images, scale bar = 2 µm, lower images, scale bar = 0.5 µm). i) SA‐β‐gal staining of primary mouse chondrocytes transfected with OENC, Dpp4OE‐WT, or Dpp4OE‐MUT plasmids, with or without Mdivi‐1 (10 µм) (scale bar = 20 µm). j) Quantification of SA‐β‐gal positive cells in (i) (n = 5, biologically independent samples). k) IF analysis of primary mouse chondrocytes transfected with OENC, Dpp4OE‐WT, or Dpp4OE‐MUT plasmids, with or without Mdivi‐1 (10 µм). l) Quantification of p16INK4a or γH2AX positive cells in the IF results from (k) (scale bar = 5 µm) (n = 5, biologically independent samples). Two‐tailed t‐tests are used for (a and b). One‐way analysis of variance (ANOVA) followed by Sidak correction for multiple comparisons is used for (c, e, f, g, j, and l). Quantitative data are shown as mean ± s.d. Exact p‐values are shown in the figures.
Figure 4
Figure 4
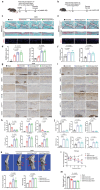
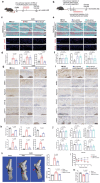
DPP4 promotes OA progression in mice induced by DMM and aging. a) Schematic diagram of the experimental design: 10‐week‐old mice underwent Sham or DMM surgery. Two weeks after surgery, the DMM group received intra‐articular injections of AAV2‐NC, AAV2‐Dpp4‐WT, or AAV2‐Dpp4‐MUT. Knee joints were collected 6 weeks later. b) Schematic diagram of the experimental design: 18‐month‐old mice received intra‐articular injections of AAV2‐NC, AAV2‐Dpp4‐WT, or AAV2‐Dpp4‐MUT. Knee joints were collected 3 months later. c) Safranin‐O/fast green staining (scale bar = 250 µm) and IF (scale bar = 20 µm) analysis of knee joints from Sham, DMM+AAV2‐NC, DMM+AAV2‐Dpp4‐WT, and DMM+AAV2‐Dpp4‐MUT groups. d) OARSI scores and quantitative analysis of the number of DPP4‐positive cells from (c) (n = 6 mice per group). e) Safranin‐O/fast green staining (scale bar = 250 µm) and IF (scale bar = 20 µm) analysis of knee joints from AAV2‐NC, AAV2‐Dpp4‐WT, and AAV2‐Dpp4‐MUT groups. f) OARSI scores and quantitative analysis of the number of DPP4‐positive cells from (e) (n = 6 mice per group). g) IHC analysis of knee joints from Sham, DMM+AAV2‐NC, DMM+AAV2‐Dpp4‐WT, and DMM+AAV2‐Dpp4‐MUT groups (scale bar = 50 µm). h) Quantitative analysis of results from (g) (n = 6 mice per group). i) IHC analysis of knee joints from AAV2‐NC, AAV2‐Dpp4‐WT, and AAV2‐Dpp4‐MUT groups (scale bar = 50 µm). j) Quantitative analysis of results from (i) (n = 6 mice per group). k) Micro‐CT analysis of knee joints from Sham, DMM+AAV2‐NC, DMM+AAV2‐Dpp4‐WT, and DMM+AAV2‐Dpp4‐MUT groups, including quantitative analysis of osteophyte number and subchondral bone plate (SBP) thickness (scale bar = 1000 µm) (n = 6 mice per group). l) Knee joint pain assessment in Sham, DMM+AAV2‐NC, DMM+AAV2‐Dpp4‐WT, and DMM+AAV2‐Dpp4‐MUT groups (n = 8 mice per group). m) Stride length measurement in Sham, DMM+AAV2‐NC, DMM+AAV2‐Dpp4‐WT, and DMM+AAV2‐Dpp4‐MUT groups (n = 8 mice per group). One‐way analysis of variance (ANOVA) followed by Sidak correction for multiple comparisons is used for (d, f, h, j, k, and m). Two‐way analysis of variance (ANOVA) followed by Sidak correction for multiple comparisons is used for (l). Quantitative data are shown as mean ± s.d. Exact p‐values are shown in the figures. ***p < 0.001, **p < 0.01, NS, no significance.
Figure 5
Figure 5
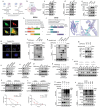
DPP4 binds and downregulates MYH9 expression. a) The schematic diagram of identifying MYH9 as a DPP4 binding target. IP‐MS and proteomics analyses were performed on C28/I2 cells transfected with either vector or DPP4‐HA plasmids. The intersecting proteins from these analyses were then identified and validated. b) Venn diagram showing the intersection of proteomics, IP‐MS, and mitochondrial dynamics‐related proteins. c,d) Reciprocal Co‐IP analysis showing the endogenous interaction between DPP4 and MYH9 in C28/I2 cells (n = 3). e) IP analysis shows the binding between MYH9‐FLAG and DPP4‐HA‐WT or DPP4‐HA‐MUT in C28/I2 cells (n = 3). f) IF analysis showing colocalization of DPP4 (green) and MYH9 (red) in C28/I2 cells (scale bar = 10 µm) (n = 3). g) PLA analysis showing the binding of DPP4 and MYH9 in C28/I2 cells (scale bar = 10 µm) (n = 3). h) Schematic diagram of DPP4 domains and truncation mutations. i) Wildtype and different truncation mutations of DPP4‐HA were transfected into C28/I2 cells along with MYH9‐FLAG. DPP4‐HA was immunoprecipitated with HA beads (n = 3). j) Schematic diagram of MYH9 domains and truncation mutations. k) Wildtype and different truncation mutations of MYH9‐FLAG were transfected into C28/I2 cells along with DPP4‐HA. MYH9‐FLAG was immunoprecipitated with FLAG beads (n = 3). l) Molecular docking showing the electrostatic interaction between DPP4 and MYH9. m) IP analysis shows the binding between MYH9‐FLAG and DPP4‐HA‐WT but not DPP4‐HA‐K2A (n = 3). n) Western blot shows that downregulating DPP4 leads to a reduction of MYH9 in (n) C28/I2 cells and o) primary mouse chondrocytes (n = 3). p) MYH9 protein expression in C28/I2 cells transfected with DPP4‐HA‐WT, DPP4‐HA‐MUT and DPP4‐HA‐K2A plasmids (n = 3). q) Western blot shows that DPP4‐HA upregulates MYH9 in primary mouse chondrocytes (n = 3). r) C28/I2 cells with ectopic expression of WT or MUT DPP4‐HA were treated with DMSO, Chlq (10 µм), or MG132 (10 µм) for 8 h (n = 3). s,t) C28/I2 cells were transfected with vector or DPP4‐HA and shNC or shDPP4 and treated with CHX (10 µм) for different durations (upper). Relative expression levels of MYH9 protein over time (lower) (n = 3). u) Effects of shNC and shDPP4 on the ubiquitination of MYH9‐FLAG in C28/I2 cells analyzed by in vivo ubiquitination assay (n = 3). v) Ubiquitination of MYH9‐FLAG in C28/I2 cells with vector, DPP4‐HA‐WT, DPP4‐HA‐K2A, DPP4‐HA‐MUT, and Ub‐MYC transfection (n = 3). n = 3 replicate independent biological replicates.
Figure 6
Figure 6
DPP4 interferes with CHIP‐mediated ubiquitination and degradation of MYH9. a,b) Co‐IP analysis shows the endogenous interaction between MYH9 and CHIP in C28/I2 cells. (n = 3). c) Downregulation of CHIP expression upregulates MYH9 in C28/I2 cells (n = 3). d) CHIP‐HIS downregulates MYH9 expression in C28/I2 cells (n = 3). e) IF analysis showing colocalization of MYH9 (red) and CHIP (green) in C28/I2 cells (scale bar = 10 µm) (n = 3). f) PLA analysis showing the interaction between MYH9 and CHIP in C28/I2 cells (scale bar = 10 µm) (n = 3). IgG was used as a negative control. g) Western blot of ubiquitination levels of MYH9‐FLAG in CHIP knockdown C28/I2 cells (n = 3). h) Western blot of ubiquitination levels of MYH9‐FLAG in CHIP‐HIS overexpressing C28/I2 cells (n = 3). i) Western blot of MYH9‐FLAG expression in C28/I2 cells overexpressing CHIP‐HIS and DPP4‐HA (n = 3). j) PLA analysis of the interaction between MYH9 and CHIP in C28/I2 cells transfected with OENC or DPP4‐HA plasmids (scale bar = 10 µm) (n = 3). k) Quantitative analysis from (j) (n = 3, 100 cells per group). l) Ubiquitination of MYH9‐FLAG in C28/I2 cells transfected with CHIP‐HIS, DPP4‐HA, MYH9‐FLAG, and Ub‐MYC (n = 3). m) In C28/I2 cells with DPP4 knocked down, overexpress CHIP‐HIS and MYH9‐FLAG, then pull down MYH9‐FLAG using FLAG beads and detect CHIP‐HIS expression. (n = 3). n) Ubiquitination levels of MYH9‐FLAG in C28/I2 cells transfected with shDPP4, CHIP‐HIS and MYH9‐FLAG plasmids(n = 3). o) In vivo ubiquitination assays in C28/I2 cells expressing WT or indicated mutant MYH9‐Flag plasmids(n = 3). p) Western blot analysis of MYH9‐FLAG expression in C28/I2 cells transduced with WT or 1642R MYH9‐FLAG vectors along with CHIP‐HIS vectors (n = 3). q) Western blot analysis of MYH9‐FLAG expression in primary mouse chondrocytes transduced with WT or 1642R MYH9‐FLAG plasmids along with CHIP‐HIS (n = 3). r) Western blot analysis in C28/I2 cells transfected with MYH9‐FLAG‐WT, vector, and CHIP‐HIS and treated with CHX (10 µм) for different time intervals (upper). Relative expression levels of MYH9 protein over time (lower) (n = 3). s) Western blot analysis in C28/I2 cells transfected with MYH9‐FLAG‐K1642R, vector, and CHIP‐HIS and treated with CHX (10 µм) for different time intervals (upper). Relative expression levels of MYH9 protein over time (lower) (n = 3). Two‐tailed t‐tests are used for (k). n = 3 replicate independent biological replicates.
Figure 7
Figure 7
4,5‐diCQA disrupts the interaction between DPP4 and MYH9 and promotes the degradation of MYH9. a) Schematic diagram of the experimental design. Virtual screening was performed to identify small molecule compounds that can bind to human MYH9 protein. Candidates were selected based on binding scores and previous reports. The effects of these compounds on the proliferation of primary mouse chondrocytes were assessed using the CCK8 assay, and their impact on cellular senescence was determined using SA‐β‐Gal staining. The effects of the compounds on OA were then validated in mouse OA models. b) CCK8 assay to assess cell viability of primary mouse chondrocytes treated with nine different drugs (n = 5 independent biological replicates). All drugs were used at a concentration of 10 µm. c) SA‐β‐Gal staining analysis to evaluate the effect of six drugs on senescent chondrocytes (left). Quantitative analysis of the proportion of senescent cells (right) (scale bar = 20 µm) (n = 5 independent biological replicates). d) The molecular structure of 4,5‐diCQA and a model of the interaction between 4,5‐diCQA and human MYH9. e) Different concentrations of 4,5‐diCQA were added to C28/I2 cells, and MYH9 levels were analyzed by western blot (n = 3 independent biological replicates). f) Different concentrations of 4,5‐diCQA were added to DPP4‐overexpressing C28/I2 cells, and MYH9 levels were analyzed by western blot (n = 3 independent biological replicates).g) In C28/I2 cells transfected with MYH9‐FLAG and DPP4‐HA plasmids, the addition of 4,5‐diCQA, followed by IP pull‐down of MYH9‐FLAG and western blot analysis to detect DPP4‐HA levels (n = 3 independent biological replicates) h) C28/I2 cells were treated with or without 4,5‐diCQA, and the interaction between DPP4 and MYH9 was analyzed using PLA (scale bar = 10 µm), followed by quantitative analysis (n = 3 independent biological replicates, 100 cells per group). In normal i) and DPP4‐overexpressing j) C28/I2 cells, 4,5‐diCQA was added or omitted, and an IP assay was conducted to assess the ubiquitination levels of MYH9‐FLAG (n = 3 independent biological replicates). k) Identification of DEGs in C28/I2 cells transfected with DPP4OE plasmid compared to OENC plasmid and the effect of 4,5‐diCQA (10 µм) treatment on these DEGs (FDR<0.05). l) Heatmap of the 4,5‐diCQAUp‐DEGs and the 4,5‐diCQADown‐DEGs. m) Pathway analysis of the 4,5‐diCQADown‐DEGs. n) Pathway analysis of the 4,5‐diCQAUp‐DEGs. One‐way analysis of variance (ANOVA) followed by Sidak correction for multiple comparisons is used for (b and c). Two‐tailed t‐tests are used for (h). Quantitative data are shown as mean ± s.d. ***p < 0.001, *p < 0.05, NS, no significance.
Figure 8
Figure 8
4,5‐diCQA alleviates DMM and aging‐induced OA progression in mice. a) Schematic diagram of the experimental design: 10‐week‐old mice underwent Sham or DMM surgery. One week after surgery, the DMM group received weekly intra‐articular injections of PBS or 4,5‐diCQA until 8 weeks after surgery, when knee joints were collected. b) Schematic diagram of the experimental design: 18‐month‐old mice received intra‐articular injections of AAV2‐NC, AAV2‐Dpp4‐WT, or AAV2‐Dpp4‐MUT. Two weeks later, AAV2‐NC mice received weekly PBS injections, while AAV2‐Dpp4‐WT and AAV2‐Dpp4‐MUT mice received weekly 4,5‐diCQA injections. Knee joints were collected 3 months later. c) Safranin‐O/fast green staining (scale bar = 250 µm) and IF (scale bar = 20 µm) analysis of knee joints from Sham, DMM+PBS, and DMM+4,5‐diCQA groups. d) Quantitative analysis of OARSI scores and the number of DPP4/MYH9‐positive cells from (c) (n = 6 mice per group). e) Safranin‐O/fast green staining (scale bar = 250 µm) and IF (scale bar = 20 µm) analysis of knee joints from PBS+AAV2‐NC, 4,5‐diCQA+AAV2‐Dpp4‐WT, and 4,5‐diCQA+AAV2‐Dpp4‐MUT groups. F) Quantitative analysis of OARSI scores and the number of DPP4/MYH9‐positive cells from (e) (n = 6 mice per group). g) IHC analysis of knee joints from Sham, DMM+PBS, and DMM+4,5‐diCQA groups (scale bar = 50 µm). h) Quantitative analysis of results from (g) (n = 6 mice per group). i) IHC analysis of knee joints from PBS+AAV2‐NC, 4,5‐diCQA+AAV2‐Dpp4‐WT, and 4,5‐diCQA+AAV2‐Dpp4‐MUT groups (scale bar = 50 µm). j) Quantitative analysis of results from (i) (n = 6 mice per group). k) Micro‐CT analysis of knee joints from Sham, DMM+PBS, and DMM+4,5‐diCQA groups, including quantitative analysis of osteophyte number and SBP thickness (scale bar = 1000 µm) (n = 6 mice per group). l) Knee joint pain assessment in Sham, DMM+PBS, and DMM+4,5‐diCQA groups (n = 8 mice per group). m) Stride length measurement in Sham, DMM+PBS, and DMM+4,5‐diCQA groups (n = 8 mice per group). One‐way analysis of variance (ANOVA) followed by Sidak correction for multiple comparisons is used for (d, f, h, j, k, and m). Two‐way analysis of variance (ANOVA) followed by Sidak correction for multiple comparisons is used for (l). Quantitative data are shown as mean ± s.d. Exact p‐values are shown in the figures. ***p < 0.001, *p < 0.05, NS, no significance.

References

    1. G. B. D. O. Collaborators , Lancet Rheumatol. 2023, 5, e508. - PubMed
    1. Hunter D. J., Bierma‐Zeinstra S., Lancet 2019, 393, 1745. - PubMed
    1. a) Katz J. N., Arant K. R., Loeser R. F., JAMA J. Am. Med. Assoc. 2021, 325, 568; - PMC - PubMed
    2. b) Hunter D. J., Nat. Rev. Rheumatol. 2011, 7, 13. - PubMed
    1. Kolasinski S. L., Neogi T., Hochberg M. C., Oatis C., Guyatt G., Block J., Callahan L., Copenhaver C., Dodge C., Felson D., Gellar K., Harvey W. F., Hawker G., Herzig E., Kwoh C. K., Nelson A. E., Samuels J., Scanzello C., White D., Wise B., Altman R. D., DiRenzo D., Fontanarosa J., Giradi G., Ishimori M., Misra D., Shah A. A., Shmagel A. K., Thoma L. M., Turgunbaev M., et al., Arthritis Care Res. (Hoboken) 2020, 72, 149. - PMC - PubMed
    1. a) Cao H., Yang P., Liu J., Shao Y., Li H., Lai P., Wang H., Liu A., Guo B., Tang Y., Bai X., Li K., Nat. Commun. 2023, 14, 6190; - PMC - PubMed
    2. b) Loeser R. F., Kelley K. L., Armstrong A., Collins J. A., Diekman B. O., Carlson C. S., Arthritis Rheumatol. 2020, 72, 1679; - PMC - PubMed
    3. c) Collins J. A., Kim C. J., Coleman A., Little A., Perez M. M., Clarke E. J., Diekman B., Peffers M. J., Chubinskaya S., Tomlinson R. E., Freeman T. A., Loeser R. F., Ann. Rheum. Dis. 2023, 82, 1464. - PMC - PubMed

LinkOut - more resources