. 2024 Dec 16;15(1):10683.
doi: 10.1038/s41467-024-55006-2.

Development of a RIPK1 degrader to enhance antitumor immunity

Affiliations

Development of a RIPK1 degrader to enhance antitumor immunity

Xin Yu et al. Nat Commun. .

Abstract

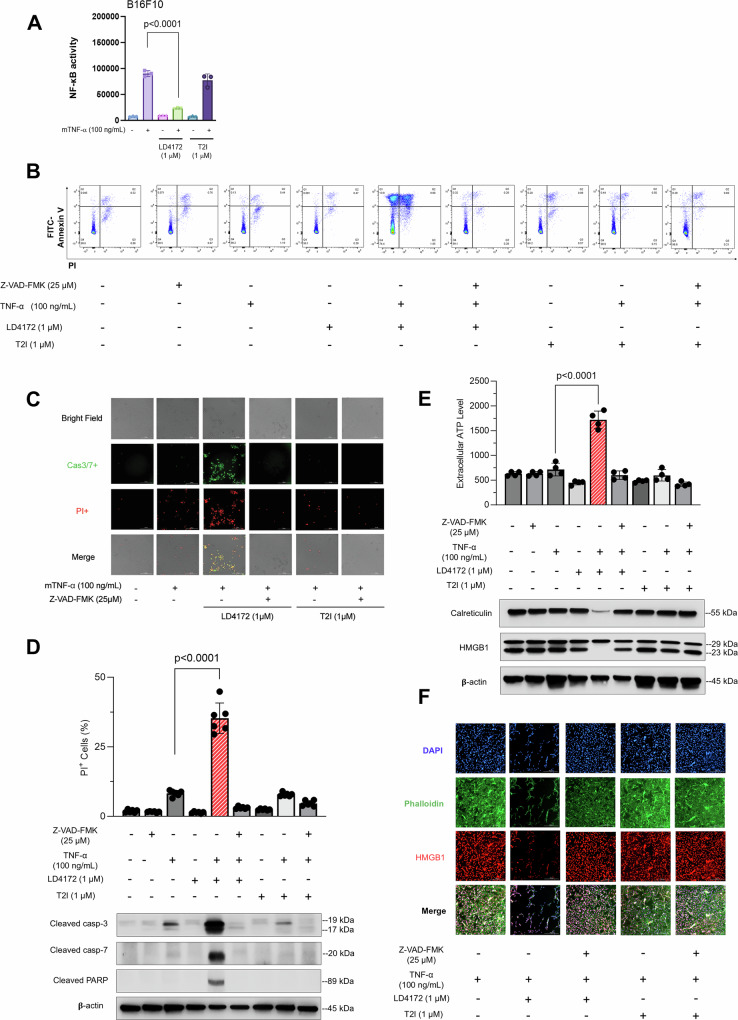
The scaffolding function of receptor interacting protein kinase 1 (RIPK1) confers intrinsic and extrinsic resistance to immune checkpoint blockades (ICBs) and emerges as a promising target for improving cancer immunotherapies. To address the challenge posed by a poorly defined binding pocket within the intermediate domain of RIPK1, here we harness proteolysis targeting chimera (PROTAC) technology to develop a RIPK1 degrader, LD4172. LD4172 exhibits potent and selective RIPK1 degradation both in vitro and in vivo. Degradation of RIPK1 by LD4172 triggers immunogenic cell death, enhances tumor-infiltrating lymphocyte responses, and sensitizes tumors to anti-PD1 therapy in female C57BL/6J mice. This work reports a RIPK1 degrader that serves as a chemical probe for investigating the scaffolding functions of RIPK1 and as a potential therapeutic agent to enhance tumor responses to ICBs therapy.


Conflict of interest statement

Competing interests: J.W. is a co-founder of Chemical Biology Probes, LLC, and serves as a consultant for CoRegen Inc. X.Y., D.L., and J.W. are inventors on a patent covering RIPK1 degraders reported in this work, titled “Novel RIPK1 Kinase-Targeting PROTACs and Methods of Use Thereof”, with the identification number WO2022120118A1. The remaining authors declare no competing interests.

Figures

Fig. 1
Fig. 1. Design and screen of RIPK1 PROTACs.
A Chemical structure and docking model of Type II inhibitor 1 bound to the kinase domain of RIPK1 (PDB: 4NEU). The solvent-exposed group is highlighted in a yellow circle. B Chemical structure and co-crystal structure of Type III inhibitor 2 in complex with RIPK1 (PDB: 6R5F). The solvent-exposed group of inhibitor 2 is highlighted in a yellow circle. C Small library design of RIPK1 PROTACs. Type II inhibitor 1 or Type III inhibitor 2 was conjugated with various E3 ligase ligands or an adamantane tag to generate a small library of RIPK1 PROTACs. D Quantification of RIPK1 levels in Jurkat cells treated with the indicated compounds for 24 h at 0, 0.1, 1, and 10 µM, followed by Western blot analysis. This preliminary screening experiment was performed once for all compounds, except for T2-VHL, which was tested in three independent experiments. Source data are provided as a Source Data file. E Quantification of RIPK1 levels from (D). F Quantification of RIPK1 levels in Jurkat and B16F10 cells treated with Type II inhibitor-based PROTACs with varying linker lengths for 24 h, followed by Western blot analysis. The optimal linker length was identified in this single experiment. Source data are provided as a Source Data file. G Quantification of RIPK1 levels from (F).
Fig. 2
Fig. 2. LD4172, a RIPK1 PROTAC, induces potent and highly specific degradation of RIPK1 in a panel of cell lines.
A Chemical structures of RIPK1 PROTAC LD4172 and its negative control, LD4172-NC. LD4172-NC shares the same warhead and linker as LD4172 but contains an inactive VHL ligand, making it unable to recruit VHL for ubiquitination. B Quantification of RIPK1 levels in Jurkat and B16F10 cells treated with various concentrations of LD4172 for 24 h, analyzed by Western blot. Results are representative of three independent experiments. Source data are provided as a Source Data file. C The DC50 and Dmax values of LD4172 were determined in various human and mouse cell lines. The screening of LD4172 across different cell types was conducted in a single experiment. DC50 represents the concentration at which 50% of RIPK1 is degraded, while Dmax indicates the maximum level of degradation achieved. D Kinetics of RIPK1 degradation induced by LD4172 (1 µM) and resynthesis upon LD4172 washout in Jurkat and B16F10 cells. Representative Western blots (n = 3) show that the degradation half-life of RIPK1 is less than 2 h in both cell lines. RIPK1 resynthesis begins 4 h post-washout, with half-lives of ~48 h in Jurkat cells and ~24 h in B16F10 cells. Source data are provided as a Source Data file. E Quantification of RIPK1 degradation and resynthesis from (D). F NanoBRET-based in-cell RIPK1 target engagement assay. HEK293 cells transfected with nLuc-RIPK1 were incubated with a RIPK1 NanoBRET tracer (500 nM) and different concentrations of LD4172 or LD4172-NC (n = 3 biological independent replicates, three independent experiments). G Time-resolved fluorescence resonance energy transfer (TR-FRET) biochemical binding assay for RIPK1. GST-tagged human RIPK1 (1 nM), Tb-labeled anti-GST antibody (0.3 nM), a RIPK1 TR-FRET tracer (350 nM), and various concentrations of LD4172 were incubated for 2 h (n = 3 biological independent replicates, three independent experiments), followed by TR-FRET measurements at excitation 340 nm and emission 495/520 nm. H NanoBRET-based ternary complex formation assay. HEK293T cells co-transfected with nLuc-RIPK1 and VHL-HaloTag were treated with different concentrations of LD4172 or LD4172-NC (n = 3 biological replicates, three independent experiments). Graph bars represent mean ± SD, and statistical significance was determined using a two-tailed unpaired t-test with P values indicated. I LD4172-induced RIPK1 degradation depends on ternary complex formation, neddylation, and proteasome activity. Representative Western blots (three independent experiments) of RIPK1 in Jurkat and B16F10 cells treated with T2I, a VHL ligand, MLN4924 (neddylation inhibitor), or Carfilzomib (proteasome inhibitor) for 4 h, followed by LD4172 treatment. Source data are provided as a Source Data file. J Proteomic profiling of LD4172-induced degradation. MDA-MB-231 cells were treated with LD4172 or LD4172-NC (200 nM) for 6 h (n = 3 biological independent replicates from the single experiment). Proteins were ranked in a volcano plot based on their P value (−log10) and fold change (log2 FC) between LD4172 and LD4172-NC treatments. RIPK1 (red dot) showed >50% degradation with P < 0.01, while blue dots represent kinases inhibited by the LD4172 warhead but not degraded. Source data are provided as a Source Data file.
Fig. 3
Fig. 3. LD4172 sensitizes B16F10 cells to TNFα-mediated apoptosis.
B16F10 cells were treated with or without TNFα (100 ng/mL), Z-VAD-FMK (25 μM), LD4172 (1 μM), and/or T2I (1 μM) for 72 h. A NF-κB activity in B16F10 cells expressing a NanoLuc reporter for NF-κB response. Data represent the mean NF-κB activity ± SD (n = 3 biologically independent samples from two independent experiments). Statistical significance was determined using a two-tailed unpaired t-test, with P values indicated. B Representative flow cytometry dot plots showing apoptosis in B16F10 cells from three independent experiments (n = 3 biologically independent samples per experiment). Viable cells (FITC−/PI−) are located in the lower left quadrant, early apoptotic cells (FITC+/PI−) in the lower right quadrant, and late apoptotic cells (FITC+/PI+) in the upper right quadrant. C Representative images of B16F10 cells stained with PI (red) and caspase 3/7 (green). Data are shown from three independent experiments (n = 3 biologically independent samples per experiment). Cell death was quantified by PI uptake using the Cytation 5 imager. D Top: Percentage of PI+ B16F10 cells after 72 h of the indicated treatments, calculated as PI+ (%) = (Number of PI+ cells/Total cells) × 100%, using the Cytation 5 imager. Data represent the mean ± SD (n = 6 biologically independent replicates from three independent experiments). Statistical significance was determined using a two-tailed unpaired t-test, with P values indicated. Bottom: Western blots showing expression of cleaved caspase-3, cleaved caspase-7, and cleaved PARP in B16F10 cells from one experiment. Source data are provided as a Source Data file. E Top: Quantification of extracellular ATP levels secreted by B16F10 cells. Data represent mean extracellular ATP levels ± SD (n = 4 biologically independent samples from one experiment), with statistical significance determined by a two-tailed unpaired t-test, and P values indicated. Bottom: Representative Western blots showing expression of HMGB1 and calreticulin in B16F10 cells. Source data are provided as a Source Data file. F Immunofluorescence staining of HMGB1 in B16F10 cells, with data from three biologically independent samples from one experiment.
Fig. 4
Fig. 4. LD4172 synergizes with Anti-PD1 to inhibit tumor growth.
A Plasma concentrations of LD4172 in C57BL/6J mice administered 1 mg/kg intravenously (i.v.) or 10 mg/kg intraperitoneally (i.p.) (n = 4 mice/group). B Reresentative immunoblots showing RIPK1 levels in various tissues from C57BL/6J mice treated with vehicle or LD4172. Tissues analyzed include B16F10 tumor, spleen, PBMC, lung (n = 3 mice for vehicle, n = 4 mice for LD4172), as well as lymph node and bone marrow (n = 6 mice for both groups). Source data are provided as a Source Data file. C Densitometric analysis of RIPK1 protein levels in various tissues based on immunoblot images from (B). Tissues analyzed: B16F10 tumor, spleen, PBMC, lung (vehicle n = 3 mice, LD4172 n = 4 mice), lymph node, and bone marrow (n = 6 mice for both groups). Graph bars represent mean values ± SD and statistical significance was calculated with a two-tailed unpaired t-test and P values are indicated. D Representative immunoblots showing RIPK1 levels in B16F10 cells transduced with either RIPK1-specific gRNA or a non-targeting control (sgNC). Data represent results from three independent experiments (n = 3 biologically independent samples per experiment). E B16F10-RIPK1-KO tumors sensitized to anti-PD1 treatment: 3 × 105 B16F10 cells transduced with gRNA specific for RIPK1 or non-targetable control (sgNC) were inoculated into C57BL/6J mice. After 7 days, mice with measurable tumors (~100 mm3) were randomly treated with or without anti-PD1 in vivo (100 µg per dose, i.p., every 3 days, n = 8 mice/group). Each symbol represents the mean tumor volume, with error bars indicating SEM. Statistical analysis was performed using two-way ANOVA followed by Sidak’s multiple comparisons test, with significance levels indicated. Results are representative of three independent experiments. F Tumor growth curve of mice with B16F10 tumors treated with LD4172 and/or anti-PD1 (n = 8 mice/group). C57B6/J mice were subcutaneously inoculated with 3 × 105 B16F10 tumor cells. After 7 days (tumor size ~100 mm3), mice were treated every 3 days with anti-PD1 (100 µg per dose, i.p.), daily with LD4172 (20 mg/kg, i.p.), a combination of LD4172 and anti-PD1 (same dose as their individual doses), or their corresponding vehicle control. Each symbol represents the mean tumor volume, with error bars indicating SEM. Statistical analysis was performed using two-way ANOVA followed by Sidak’s multiple comparisons test, with significance levels indicated. Results are representative of three independent experiments. G Kaplan-Meier survival curve for all experimental groups. H Final tumor weight (g) from (F) after 22 d of treatment (n = 8 mice/group). Statistical significance was calculated with a two-tailed unpaired t-test and P values are indicated. I Representative images of B16F10 tumors collected at the end of treatment. J Mouse body weight (n = 8 mice/group). K Tumor growth curve of mice with B16F10 tumors treated with T2I and/or anti-PD1 (n = 8 mice/group). The experimental conditions and treatment regimens were the same as (F) except using the RIPK1 kinase inhibitor T2I (20 mg/kg, i.p.) to replace LD4172. Each symbol represents the mean tumor volume, with error bars indicating SEM. Statistical analysis was performed using two-way ANOVA followed by Sidak’s multiple comparisons test, with significance levels indicated.
Fig. 5
Fig. 5. LD4172 alters the tumor immune microenvironment.
A Representative immunofluorescent images showing RIPK1, Calreticulin, CD8, CD4, Foxp3, and F4/80 staining, along with hematoxylin and eosin (H&E) staining and cleaved caspase-3/7 levels in B16F10 tumors following 5 days of the indicated treatment. Images represent four independent fields per slide, with one slide from each of four mice per group. Scale bars: 20 μm and 200 μm (both at 60× objective). B The mouse plasma HMGB1 level from different treatment groups (n = 8 mice). Statistical significance was calculated with a two-tailed unpaired t-test and P values are indicated. Flow cytometry quantification of PD1 + CD8+ T cells C CD4+ T cells D cDC cells E macrophages F and CD8+ T cells G in B16F10 tumors following 5 days of indicated treatment (n = 10 mice/group). H Flow cytometric quantification of IFNγ+ CD8+ T cells in B16F10 tumors treated with the indicated treatments for 5 days and stimulated with PMA/ionomycin in vitro for 6 h (n = 5 tumors/group). Statistical significance was calculated with a two-tailed unpaired t-test and P values are indicated. I Tumor volume (mm3) of vehicle-, anti-PD1−, LD4172−, anti-PD1+LD4172−, and anti-PD1+LD4172+anti-CD8–treated B16F10 tumors (n = 8 mice). Each symbol represents the mean tumor volume, with error bars indicating SEM. Statistical analysis was performed using two-way ANOVA followed by Sidak’s multiple comparisons test, with significance levels indicated. J Heat map showing log 10-fold changes in the concentration of mouse plasma cytokines normalized by the mean value of control mice (n = 8 mice). For all experiments: LD4172: 20 mg /kg; anti-PD1 antibody: 100 μg/mice; anti-CD8: 100 μg/mice; Combo: LD4172 plus anti-PD1.

Update of

References

    1. Korman, A. J., Garrett-Thomson, S. C. & Lonberg, N. The foundations of immune checkpoint blockade and the ipilimumab approval decennial. Nat. Rev. Drug Discov.21, 509–528 (2022). - PubMed
    1. Vesely, M. D., Zhang, T. & Chen, L. Resistance mechanisms to anti-PD cancer immunotherapy. Annu. Rev. Immunol.40, 45–74 (2022). - PubMed
    1. Upadhaya, S., Neftelinov, S. T., Hodge, J. & Campbell, J. Challenges and opportunities in the PD1/PDL1 inhibitor clinical trial landscape. Nat. Rev. Drug Discov.21, 482–483 (2022). - PubMed
    1. Mifflin, L., Ofengeim, D. & Yuan, J. Receptor-interacting protein kinase 1 (RIPK1) as a therapeutic target. Nat. Rev. Drug Discov.19, 553–571 (2020). - PMC - PubMed
    1. Cucolo, L. et al. The interferon-stimulated gene RIPK1 regulates cancer cell intrinsic and extrinsic resistance to immune checkpoint blockade. Immunity55, 671–685.e10 (2022). - PMC - PubMed

Publication types

MeSH terms

Substances

LinkOut - more resources