

A quantitative multi-parameter mapping protocol standardized for clinical research in multiple sclerosis
- PMID: 39681586
- PMCID: PMC11649941
- DOI: 10.1038/s41598-024-80274-9
A quantitative multi-parameter mapping protocol standardized for clinical research in multiple sclerosis
Abstract
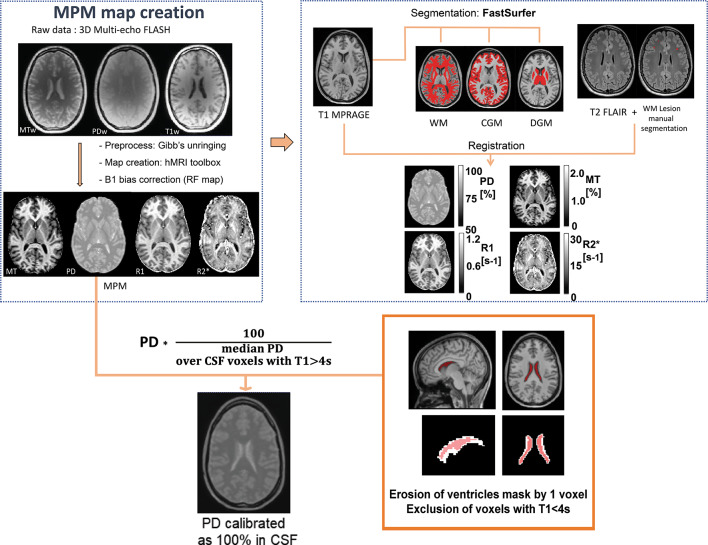
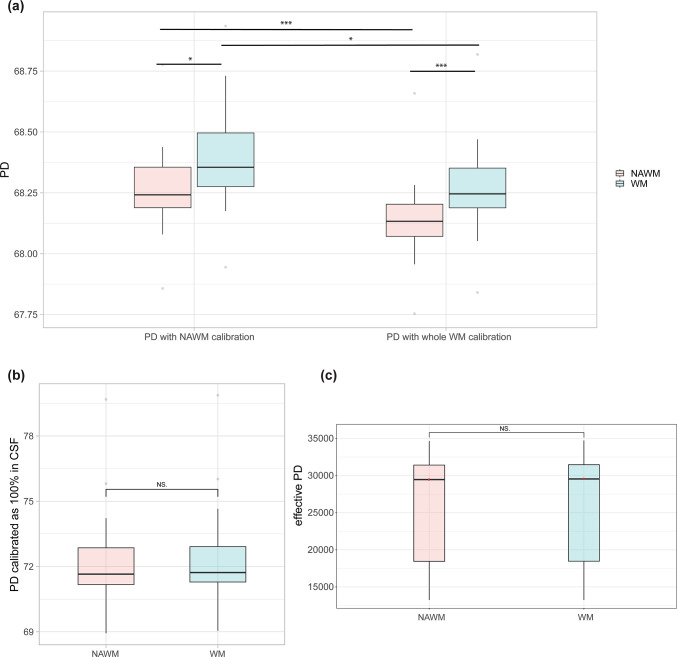
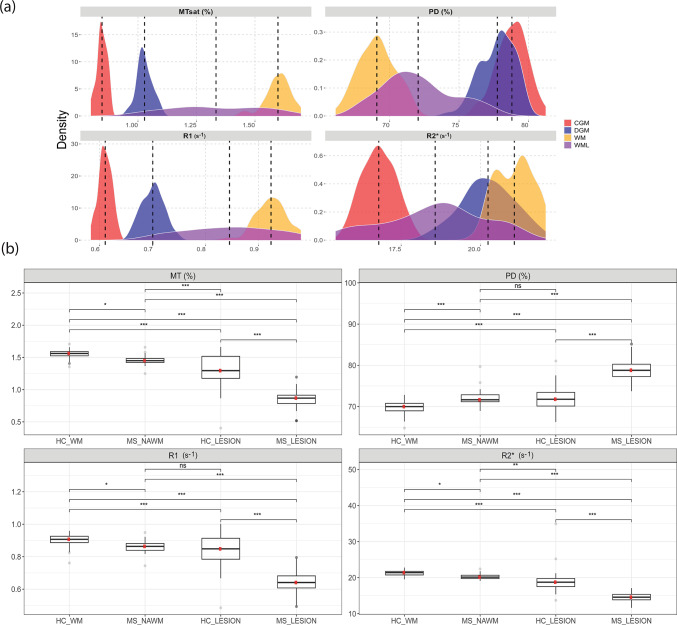
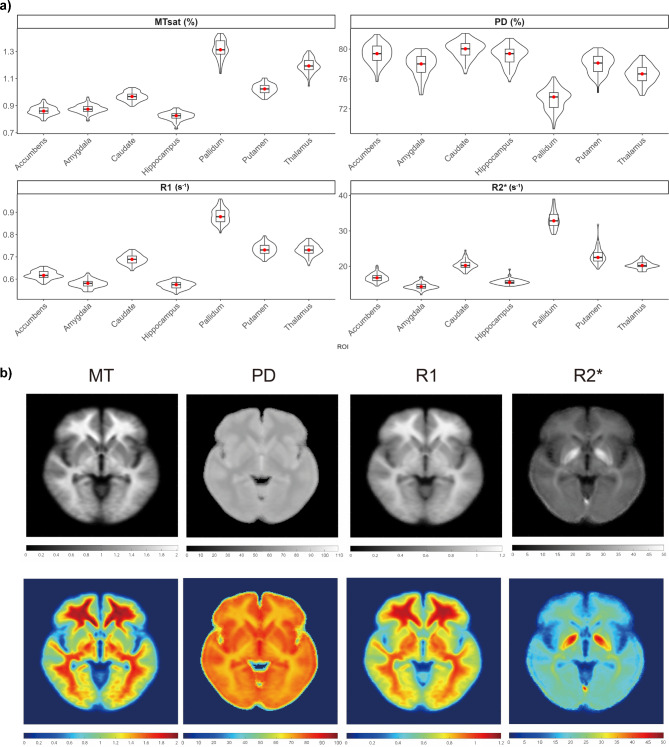
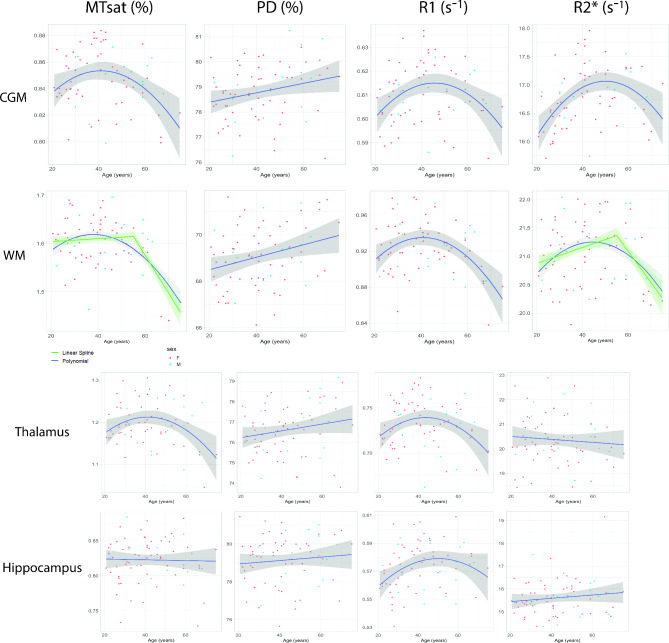
Quantitative magnetic resonance imaging (qMRI) involves mapping microstructure in standardized units sensitive to histological properties and supplements conventional MRI, which relies on contrast weighted images where intensities have no biophysical meaning. While measuring tissue properties such as myelin, iron or water content is desired in a disease context, qMRI changes may typically reflect mixed influences from aging or pre-clinical degeneration. We used a fast multi-parameter mapping (MPM) protocol for clinical routine at 3T to reconstruct whole-brain quantitative maps of magnetization transfer saturation (MT), proton density (PD), longitudinal (R1), and transverse relaxation rate (R2*) with 1.6 mm isotropic resolution. We report reference MPM values from a healthy population with age and gender distributions typical of multiple sclerosis in whole brain white matter (WM), T2-weighted WM hyperintensities, cortical grey matter and deep grey matter regions and present post-processing optimizations including integration of lesions and normalization of PD maps against cerebrospinal fluid (CSF) for standardized research in multiple sclerosis (MS) and potentially also in related disorders. PD maps were affected by WM abnormalities in MS using WM calibration. The results acknowledge the impact of non-linear age effects on MPM and suggest using CSF calibration for future clinical application in MS.
Keywords: Aging; Multi-parameter mapping; Multiple sclerosis; Neuroimaging; Proton density; Quantitative MRI.
© 2024. The Author(s).
Conflict of interest statement
Declarations. Competing interests: H.T is supported by iNAMES—MDC—Weizmann—Helmholtz International Research School for Imaging and Data Science from NAno to MESo. Q.C is supported by the Chinese Scholarship Council (CSC). C.C has received research support from Novartis and Alexion and is a part of a consortium funded by the U.S. Department of Defense, unrelated to this study. She also serves as a member of the Standing Committee on Science for the Canadian Institutes of Health Research (CIHR). D.M has received a research scholarship from the Berlin Institute of Health at Charité, Berlin, Germany. S.A received speaker’s honoraria from Bayer, Alexion, Roche and research grants from Stiftung Charité, Fritz-Thyssen-Stiftung, HEAD Genuit Stiftung, Rahel Hirsch Program, Novartis and Roche, all unrelated to this study. R.R. received speaking honoraria from Roche unrelated to this study. M.S. has received consulting fees from Roche, Pliant therapeutics, and Octave Bioscience all unrelated to this study. He is named as inventor on a patent describing use of N-acetylglucosamine as myelination and immunodulating therapy. T.S.H has received research funding from Celgene/bms and speaker honoraria from AbbVie, Bayer, and Roche both unrelated to this work. A.U.B is cofounder and holds shares of medical technology companies Motognosis GmbH and Nocturne GmbH. He is named as inventor on several patents and patent applications describing methods for retinal image analyses, motor function analysis, multiple sclerosis serum biomarkers and myelination therapies utilizing N-glycosylation modification. He is cofounder of IMSVISUAL and has served as member of the board of directors and secretary/treasurer of IMSVISUAL. AUB is now full-time employee and holds stocks and stock options of Eli Lilly and Company. His contribution to this work is his own and does not represent a contribution from Eli Lilly. F.P. has received research funding from Biogen, Genzyme, Guthy Jackson Foundation, Merck, Serono, Novartis, Bayer and Roche all unrelated to this work. He has received consulting fees from Alexion, Roche, Horizon, Neuraxpharm and speaker honoraria from Almirall, Bayer, Biogen, GlaxoSmithKline, Hexal, Merck, Sanofi, Genzyme, Novartis, Viela Bio, UCB, Mitsubishi Tanabe, Celgene, Guthy Jackson Foundation, Serono and Roche all unrelated to this study.
Figures
References
-
- Weiskopf, N., Edwards, L. J., Helms, G., Mohammadi, S. & Kirilina, E. Quantitative magnetic resonance imaging of brain anatomy and in vivo histology. Nat. Rev. Phys.3, 570–588. 10.1038/s42254-021-00326-1 (2021).
-
- Cercignani, M., Dowell, N. G. & Tofts, P. S. Quantitative MRI of the brain: Principles of physical measurement. (2018).
-
- Gelman, N., Ewing, J. R., Gorell, J. M., Spickler, E. M. & Solomon, E. G. Interregional variation of longitudinal relaxation rates in human brain at 3.0 T: Relation to estimated iron and water contents. Magn. Reson. Med.45, 71–79. 10.1002/1522-2594(200101)45:1%3c71::aid-mrm1011%3e3.0.co;2-2 (2001). - PubMed
-
- Langkammer, C. et al. Quantitative MR imaging of brain iron: A postmortem validation study. Radiology257, 455–462. 10.1148/radiol.10100495 (2010). - PubMed
MeSH terms
LinkOut - more resources
Full Text Sources
Medical
