. 2024 Dec 16;14(1):30492.
doi: 10.1038/s41598-024-81930-w.

Forceps minor control of social behaviour

Affiliations

Forceps minor control of social behaviour

Franziska Stoller et al. Sci Rep. .

Abstract

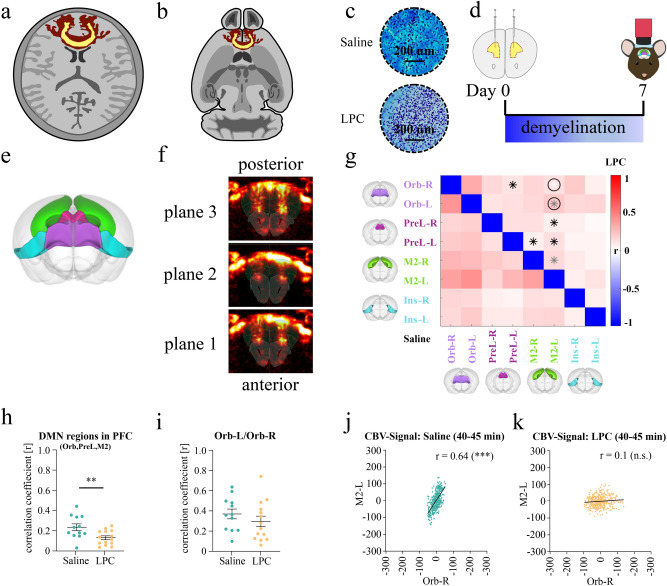
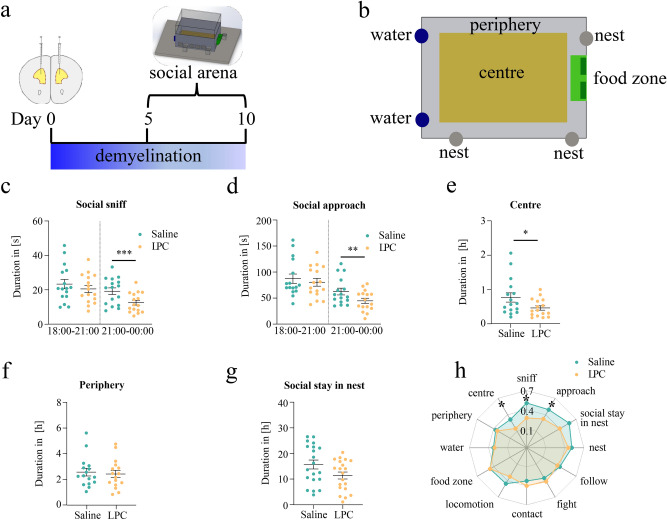
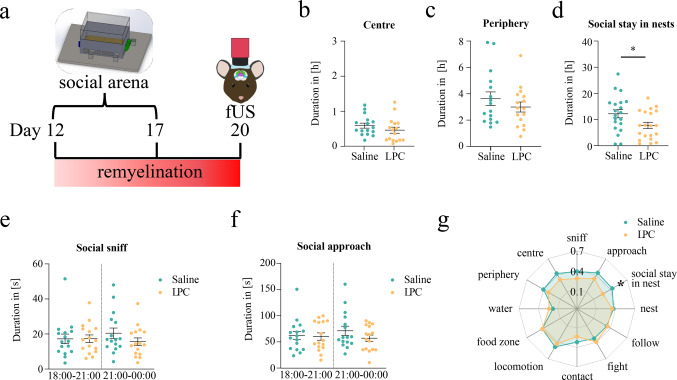
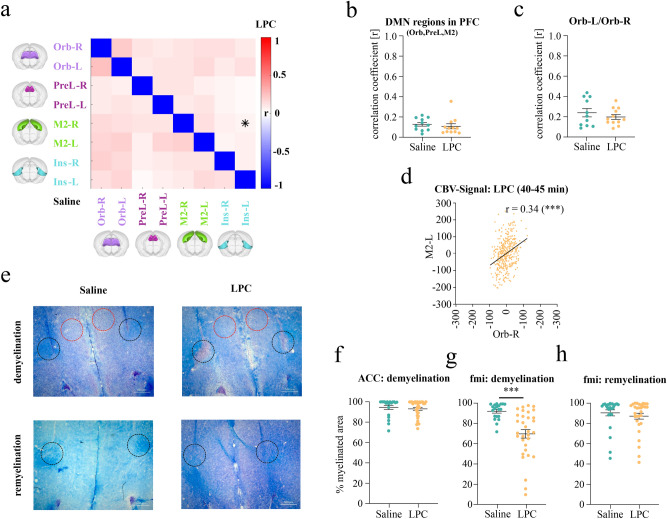
The PRISM project, funded by the EU's Innovative Medicines Initiative, has identified a transdiagnostic, pathophysiological relationship between the integrity of the default mode network (DMN) and social dysfunction. To explore the causal link between DMN integrity and social behaviour, we employed a preclinical back-translation approach, using focal demyelination of the forceps minor to disrupt DMN connectivity in mice. By applying advanced techniques such as functional ultrasound imaging and automated analysis of social behaviour, we demonstrated that reduced DMN connectivity leads to impaired social interactions and increased anxiety in mice. Notably, these effects were reversible, indicating that the forceps minor, a critical fibre tract connecting key DMN regions in the prefrontal cortex, plays a crucial role in social function. This study provides direct evidence for a causal relationship between DMN integrity and social dysfunction, with potential implications for developing targeted treatments in precision psychiatry.


Conflict of interest statement

Declarations. Competing interests: F.S., E.H., T.I., E.K., H.M.M., and B.H. received salaries from Boehringer Ingelheim Pharma GmbH & Co. KG.

Figures

Fig. 1
Fig. 1
Forceps minor and functional connectivity in saline and lysolecithin (LPC) group. Illustration of forceps minor in (a) human and (b) mouse brain (horizontal section). (c) magnified view of representative Luxol fast blue stained sections from Saline and Lysolecithin (LPC)-injected fmi regions (d) Experimental design of demyelination phase using functional ultrasound (fUS) on day seven after (LPC) or Saline injection into forceps minor. (e) 3D-illustration of fUS-scanned areas (scalablebrainatlas). (f) Representative example of images taken during a three-step volume scan. (g) Correlation matrices obtained in control group (n = 12) and LPC group (n = 14). Orb-R, Orbital Area Right; Orb-L, Orbital Area Left; PreL-R, Prelimbic Area Right; PreL-L, Prelimbic Area Left; M2-R, Secondary Motor Cortex Right; M2-L Secondary Motor Cortex Left; Ins-R, Insular Cortex Right; Ins-L, Insular Cortex Left, r = Fisher’s z-transformed Pearson’s r correlation coefficient. Black asterisk p < 0.05, grey asterisk p < 0.01, white asterisk p < 0.001, circle FDR-corrected. (h) correlation coefficient in control versus LPC group in Default Mode Network (DMN), Data are expressed as mean ± standard error of the mean (SEM) and compared by unpaired t-test (**p < 0.01). (i) correlation coefficient in control versus LPC group between Orbital area Left and Right, Data are expressed as mean ± SEM and compared by unpaired t-test (p = 0.3136).Representative example of (j) control animal and (k) LPC animal during recording minute 40–45 focusing on cerebral blood volume (CBV) arbitrary unit [AU] between Orbital area Right and Secondary Motor Cortex Left, r = Fisher’s z-transformed Pearsons’s correlation coefficient (control animal: ***p < 0.001, LPC animal: p = n.s.)
Fig. 2
Fig. 2
Behavioural analysis in demyelination phase during social arena stay. (a) Experimental design of behavioural experiment during demyelination phase between day 5–10 in social arena after injection. (b) Illustration of arena layout with predefined areas (centre, foodzone, nests, periphery, water). (c, d) Social parameters analysed during social arena stay as the sum of all detected events in three-hour bins, duration in seconds [s] (social sniff ***p < 0.001, social approach **p < 0.01) , data are expressed as means over 5 days ± standard error of the mean (SEM) and compared by One-way ANOVA corrected by Bonferroni post-hoc test. (e) Proportion of time spent in centre (p = 0.0495) or (f) periphery (p = 0.9189), as the sum of all detected events in 24-h, duration in hours [h], data are expressed as means over 5 days ± SEM and compared by unpaired t-test. (g) Time spent with >  = 1 cage mate inside nests, defined as social stay in nest (p = 0.0579) duration in hours [h], data are expressed as the sum of all detected events in a group per day ± SEM and compared by unpaired t-test (h) spider plot indicating social and non-social parameters as normalised values, asterisks represent significant differences.
Fig. 3
Fig. 3
Behavioural analysis in remyelination phase during social arena stay. (a) Experimental design of behavioural experiment during remyelination phase between day 12–17 in social arena and following functional ultrasound (fUS) scan on day 20 after injection (b) Proportion of time spent in centre (p = 0.26) or (c) periphery (p = 0.3279) of arena duration in hours [h], data are expressed as means over 5 days ± standard error of the mean (SEM) compared by t-test. (d) Time spent with >  = 1 cage mate inside nests, defined as social stay in nest (p < 0.05) duration in hours [h], data are expressed as the sum of all detected events in a group per day ± SEM and compared by unpaired t-test, (e, f) Social parameters analysed during social arena stay as the sum of all detected events in three-hour bins, duration in seconds [s] (social sniff p > 0.99, social approach p = 0.3625), data are expressed as mean over 5 days ± SEM and compared by One-way ANOVA corrected by Bonferroni post-hoc test. (g) spider web plot indicating social and non-social parameters as normalized values, asterisks represent significant differences.
Fig. 4
Fig. 4
Functional connectivity during remyelination and histological analysis. (a) Correlation matrices obtained in control group (n = 11) and Lysolecithin (LPC) group (n = 12) on day 20 post injection. Orb-R, Orbital Area Right; Orb-L, Orbital Area Left; PreL-R, Prelimbic Area Right; PreL-L, Prelimbic Area Left; M2-R, Secondary Motor Cortex Right; M2-L Secondary Motor Cortex Left; Ins-R, Insular Cortex Right; Ins-L, Insular Cortex Left, r = Fisher’s z-transformed Pearson’s r correlation coefficient. Black asterisk p < 0.05. (b) correlation coefficient in control versus LPC group in Default Mode Network (DMN), Data are expressed as mean ± standard error of the mean (SEM) and compared by unpaired t-test (p = 0.5350). (c) correlation coefficient in control versus LPC group between Orbital area Left and Right, Data are expressed as mean ± SEM and compared by unpaired t-test (p = 0.3829). (d) Representative example of LPC animal during recording minute 40–45 focusing on cerebral blood volume (CBV) arbitrary unit [AU] between Orbital area Right and Secondary Motor Cortex Left, r = Fisher’s z-transformed Pearsons’s correlation coefficient (LPC animal: ***p < 0.001). (e) Representative image of Luxol Fast Blue (LFB) stained control brain (Saline) on day 7 after injection, LPC brain on day 7 after injection, Saline brain and LPC brain 20 days after injection (red circles represent analysed areas in anterior cingulate cortices (ACC), black circles represent analysed areas in forceps minor (fmi)). (fh) white matter lesions in each hemisphere were analysed by percentage (%) of myelinated area, in ACC in demyelination phase (p = 0.5278, n.s.), fmi in demyelination phase (***p < 0.001) and fmi in remyelination phase (p = 0.4367, n.s.), Data are expressed as mean ± SEM and compared by unpaired t-test.

References

    1. Holt-Lunstad, J., Smith, T. B. & Layton, J. B. Social relationships and mortality risk: A meta-analytic review. PLoS Med.7(7), e1000316. 10.1371/journal.pmed.1000316 (2010). - PMC - PubMed
    1. Porcelli, S. et al. Social brain, social dysfunction and social withdrawal. Neurosci. Biobehav. Rev.97, 10–33. 10.1016/j.neubiorev.2018.09.012 (2019). - PubMed
    1. Dunbar, R. I. M. & Shultz, S. Evolution in the social brain. Science317, 1344–1347. 10.1126/science.1145463 (2007). - PubMed
    1. Dunbar, R. I. M. The social brain hypothesis and its implications for social evolution. Ann. Hum. Biol.36, 562–572. 10.1080/03014460902960289 (2009). - PubMed
    1. Kas, M. J. et al. A quantitative approach to neuropsychiatry: The why and the how. Neurosci. Biobehav. Rev.97, 3–9. 10.1016/j.neubiorev.2017.12.008 (2019). - PubMed

LinkOut - more resources