. 2024 Dec;5(12):1834-1851.
doi: 10.1038/s43018-024-00870-6. Epub 2024 Dec 16.

TIGIT and PD-L1 co-blockade promotes clonal expansion of multipotent, non-exhausted antitumor T cells by facilitating co-stimulation

Affiliations

TIGIT and PD-L1 co-blockade promotes clonal expansion of multipotent, non-exhausted antitumor T cells by facilitating co-stimulation

Katherine Nutsch et al. Nat Cancer. 2024 Dec.

Erratum in

Abstract

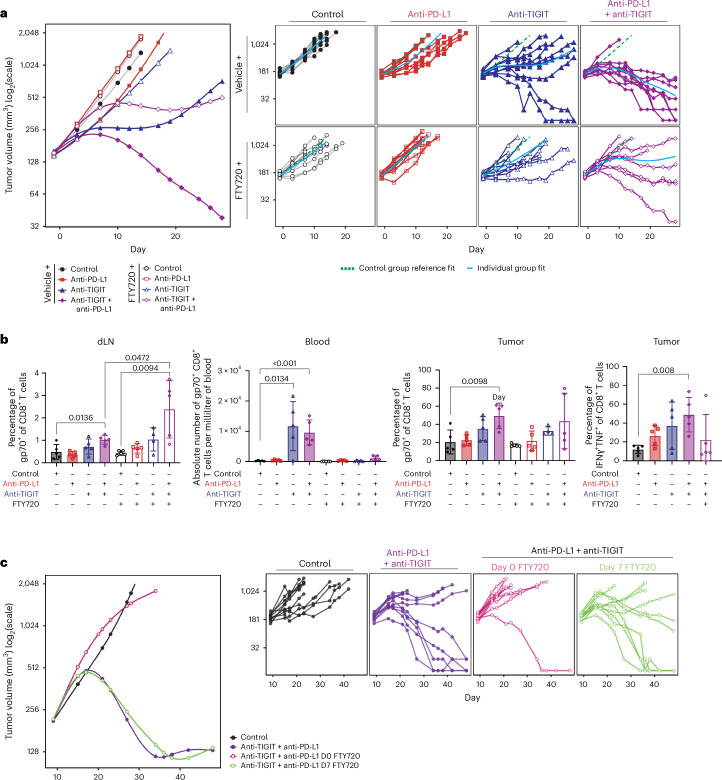
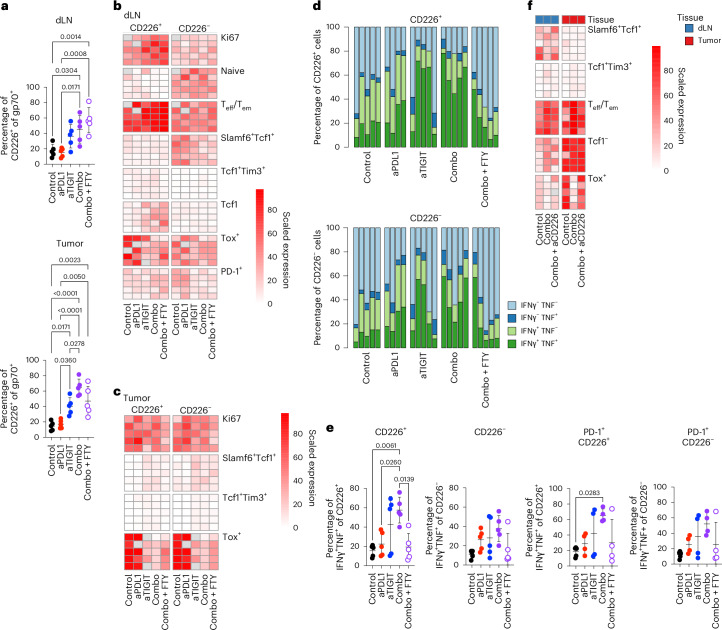
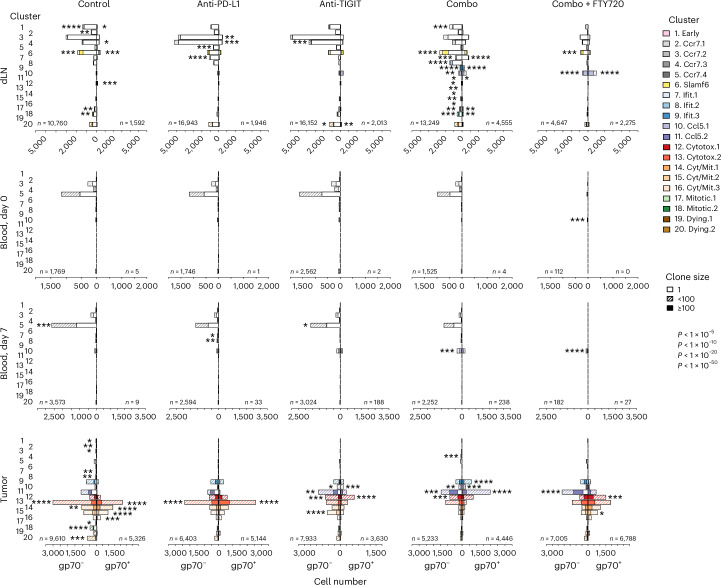
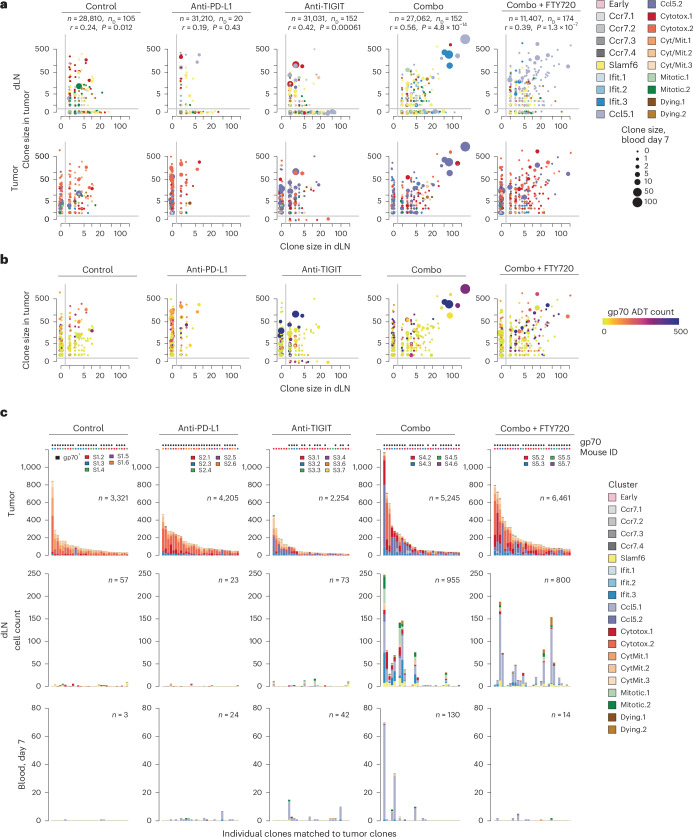
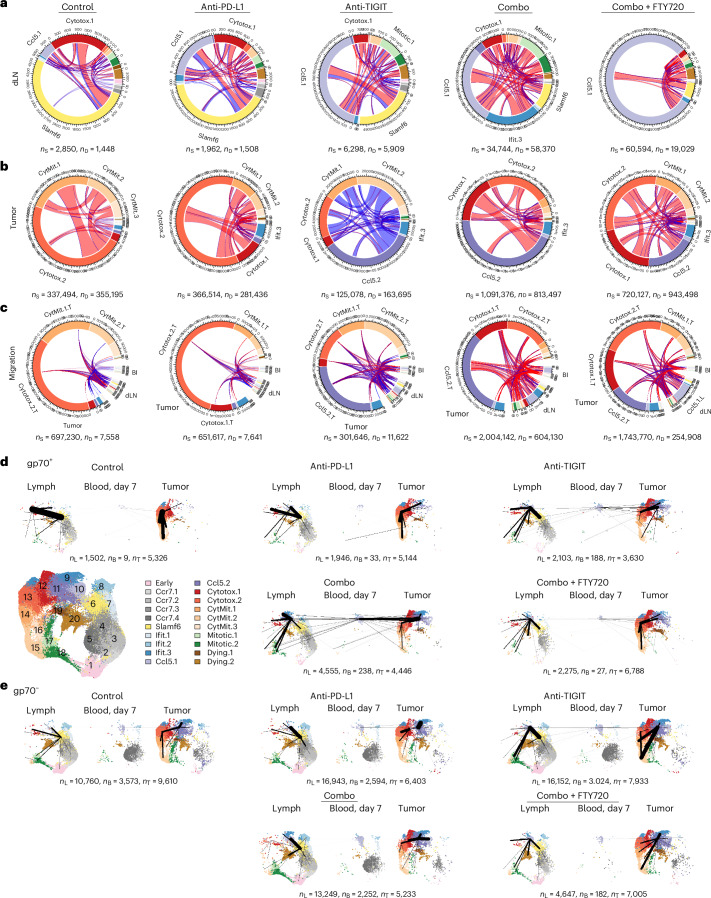
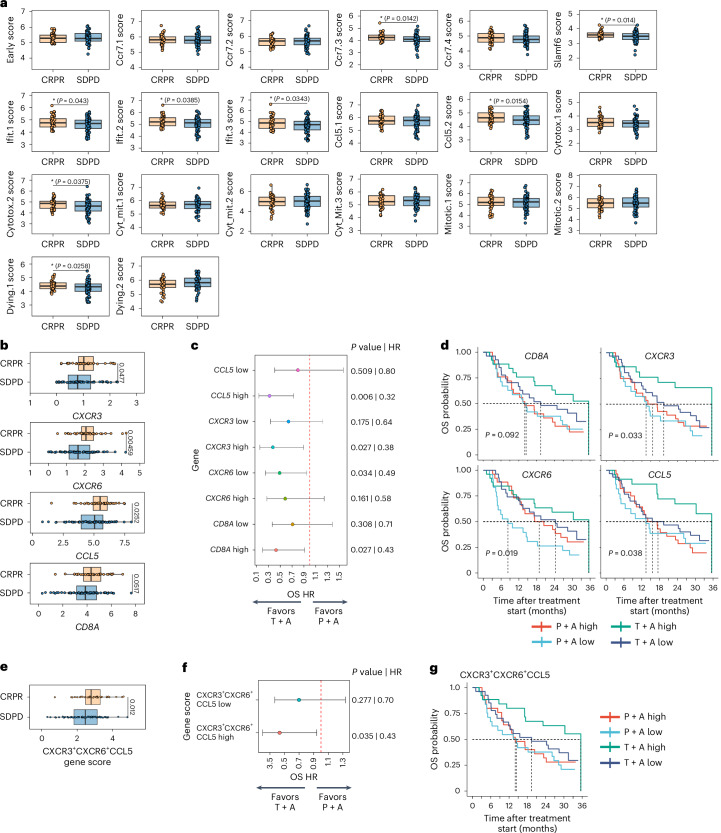
Blockade of immune checkpoints PD-1 and TIGIT has demonstrated activity in mouse tumor models and human patients with cancer. Although these coinhibitory receptors can restrict signaling in CD8+ T cells by regulating their associated co-stimulatory receptors CD28 and CD226, the functional consequences of combining PD-1 and TIGIT blockade remain poorly characterized. In mouse tumor models, we show that combination blockade elicited CD226-driven clonal expansion of tumor antigen-specific CD8+ T cells. The expanded clones emerged from a population of stem-like cells in draining lymph nodes, entering the blood as a previously unidentified single-phenotype, multiclonal population. Upon reaching the tumor, these transiting cells expanded further and differentiated into effector or exhausted T cells, with combination blockade restricting entry into the exhaustion pathway by favoring co-stimulation. Thus, PD-1 and TIGIT inhibition helps shape the repertoire of tumor-reactive CD8+ T cells in draining lymph nodes and determines their immunological fate in the tumor to enhance therapeutic benefit. Analysis of clinical trial samples suggests a similar mechanism may also occur in patients with cancer.


Conflict of interest statement

Competing interests: The authors declare the following competing interests: all authors are employees of Genentech, a member of the Roche group, which develops and markets drugs for profit.

Figures

Fig. 1
Fig. 1. Blockade of T cell egress from dLNs reduces efficacy of anti-PD-1 and anti-TIGIT treatment in mouse CT26 tumor model.
a, BALB/c mice inoculated subcutaneously with syngeneic CT26 tumor cells and treated with isotype control, anti-PD-L1, anti-TIGIT or the combination of anti-PD-L1 and anti-TIGIT antibodies, with or without FTY720. Tumor growth was monitored, and grouped analysis and growth curves for each individual animal (n = 10 animals per group) are shown. Tumor growth efficacy study is representative of three independent experiments. b, Frequency (dLN, tumor) or numbers (blood) of CD8+ T cells with positive staining for the gp70-specific tetramer. Frequency of tumor CD8+ T cells expressing IFNγ and TNF (right). Pharmacodynamic data are representative of three independent experiments (n = 5 animals per sample and treatment group). Bars represent mean; error bars represent s.d.; individual symbols represent individual animals. P values are indicated where differences between two groups were determined by two-way unpaired Student’s t-test to be statistically significant. c, FTY720 treatment after CD8+ T cells have egressed from dLNs and trafficked to tumors does not affect anti-TIGIT and anti-PD-L1 combination efficacy. FTY720 was administered on day 0, 1 day before initiation of therapy, or on day 7 after 1 week of therapy. Tumor growth was monitored, and grouped analysis and growth curves for each individual animal (n = 10 animals per group) are shown. Tumor growth efficacy study is representative of three independent experiments. Source data
Fig. 2
Fig. 2. CD226 expression is a determinant of tumor-specific CD8+ T cell differentiation state.
a, Fractions of gp70+CD8+ T cells expressing CD226 from dLNs (top) and tumors (bottom) of CT26 tumor-bearing mice treated with anti-PD-L1, anti-TIGIT or a combination with or without FTY720. b,c, Proportions of gp70+CD8+ T cells in dLNs (b) or tumors (c) having various biomarkers, separated by CD226+ (left) or CD226 (right) status, specifically, Ki67, naive phenotype, Teff/Tem phenotype, Slamf6 and TCF1 coexpression, TCF1 and Tim3 coexpression, nonexpression of TCF1, or TOX expression. Each row represents an individual mouse. d, Frequencies of CD226+ (top) and CD226 (bottom) TILs expressing combinations of IFNγ and TNF. e, Individual data and statistics for fractions of IFNγ+ TNF+ cells in CD226+ (left) and CD226 (right) bulk or PD-1+ TILs. f, Proportions of gp70+CD8+ T cells in dLNs (left) and tumor (right) having various biomarkers, under control and combination treatment, without and with anti-CD226 treatment. Data shown in a and e are represented as mean ± s.d. with individual symbols representing individual mice (n = 5 animals per treatment group), and are representative of three independent experiments. P values are indicated where differences between two groups were determined to be statistically significant by ordinary one-way ANOVA with Tukey’s multiple comparisons test. Source data
Fig. 3
Fig. 3. Single-cell RNA sequencing identifies distinct CD8+ T cell clusters in CT26 tumors, dLNs and blood.
a, UMAP of 155,496 CD8+ T cells colored by cluster. The UMAP includes CD8+ T cells from all tissues. b, Heatmap of relative average expression of selected marker genes associated with CD8+ T cell phenotype, function or differentiation state in each cluster identified in the UMAP. c, CD8+ T cell cluster correspondence with reference gene signatures. Heatmaps show cross-labeling of CD8+ T cell clusters (rows) to reference gene signatures (columns), taken from the analyses of Huang et al., Deak et al., Daniel et al. and Giles et al., with intensities indicating normalized frequency. d, RNA velocity projections on UMAP for dLNs and tumors from the control treatment group. Source data
Fig. 4
Fig. 4. Treatment effects on CD8+ T cell cluster and clonal composition in CT26 tumor-bearing mice, and stacked bar graphs of CD8+ T cell cluster composition in each tissue under each treatment condition.
Specificity for gp70 was determined by comparing ADT counts for gp70 tetramers, requiring that they should be higher than control tetramer count by a Poisson test with a one-sided P value < 1 × 10−6. In each stacked bar, open bar denotes singletons, solid bar denotes numbers for clones with less than 100 cells and hatched bar denotes numbers for clones with 100 or more cells. P values were determined by two-sided post hoc Fisher’s exact test for the indicated category relative to the rest of the contingency table and denoted by asterisks: *P < 1 × 10−5; **P < 1 × 10−10; ***P < 1 × 10−20; ****P < 1 × 10−50. n denotes the total number of gp70 (left) or gp70+ (right) cells. Source data
Fig. 5
Fig. 5. Effects of anti-PD-L1, anti-TIGIT and combination treatment on clonal diversity and dual expansion in dLNs and tumors.
a,b, Scatter plots showing primary clusters of each individual clonotype in dLNs (top) or tumors (bottom) (a) or gp70 specificity and ADT count for individual clones (b). Color of circles denote cluster designation. Size of circles is representative of clonotype numbers detected in blood on day 7. n denotes the total number of clones, including those present only in dLNs or tumors; nD refers to the number of dual clones (clones that are present in both dLNs and tumors) (a,b). P values were computed using a t-test on the Pearson correlation coefficient. c, Cluster composition of the top 30 largest clones in tumor with matching clonotypes, based on identical TCR usage in dLNs and blood, in absolute numbers. Clonotypes from individual mice within each treatment group are identified by the color legend at the top of the tumor bar graphs. Individual mice are labeled as S ‘group number’.‘mouse number’. gp70+ clones are identified by a black symbol at the top of the bar graphs. Data show that all mice have clonotypes represented in the top 30 largest clones in tumor. n denotes the number of cells that comprise the top 30 clones (c). Source data
Fig. 6
Fig. 6. CD8+ T cell cluster relationships within and across tissues of CT26 tumor-bearing mice following anti-TIGIT and/or anti-PD-L1 treatment.
a,b, Chord diagrams showing numbers of intraclonal pairs between clusters in dLNs (a) or tumors (b). Intraclonal pairs count all pairwise combinations of cluster phenotypes summed over all clones. Lines are shown for all intraclonal pairs between cells with different clusters, with their thickness representing the number of pairs relative to the total number of pairs constituting the full circle. Regions around the circumference without lines represent intraclonal pairs between cells with the same cluster. Red lines denote gp70+ clones; blue lines denote gp70 clones. Singleton clones do not have intraclonal pairs and are therefore not represented in this analysis. nS represents the total number of pairwise counts within the same cluster; nD is the pairwise counts between different clusters. c, Intraclonal pairs shared between dLNs, blood and tumors. Each chord diagram contains clusters from blood (Bl), dLNs and tumors, separated by gaps. Lines are shown for all intraclonal pairs between cells from different tissues. nS is the pairwise counts within the same tissue; nD is the pairwise counts between different tissues. d,e, Cluster co-occurrence links for gp70+ (d) or gp70 (e) clones in dLNs, blood and tumors, projected onto UMAP plots. UMAP plots show the cells of the given tissue and gp70 specificity for each experimental condition. Thickness of lines denotes relative strength of co-occurrence and correlates with line thickness shown in chord diagrams, with an additional multiplier of 3 for migration links between tissues. Lines within dLNs and tumors were pruned by an MST algorithm to show primary relationships. Migration lines from dLNs to blood and from blood to tumor were not subjected to MST. NL represents the total number of cells in dLNs; nB is the number of cells in blood on day 7; nT is the number of cells in tumors. Source data
Fig. 7
Fig. 7. Associations of human CD8+ T cell clusters and gene signatures with clinical response to tiragolumab plus atezolizumab.
a, Human gene signature scores in baseline tumor bulk RNA-seq samples from the phase 2 CITYSCAPE NSCLC trial. Patients, irrespective of treatment arm, were separated on the basis of clinical response (CR/PR, n = 37 patients; SD/PD, n = 67 patients). Boxplots are centered at the median, with the box boundaries set at the 25th and 75th percentiles; whiskers extend 1.5 × the interquartile range. P values are indicated for statistically significant differences by two-tailed t-test without correction for multiple comparisons. b, Individual human gene expression in baseline tumor bulk RNA-seq samples from CITYSCAPE patients who were treated with T + A or P + A separated on the basis of clinical response as described in a. Statistics were performed as described in a. c, Forest plot comparing high or low expression of indicated gene associated with OS HR in T + A (n = 53 patients) or P + A (n = 51 patients) treatment groups. Mean HR with 95% CIs, determined using a univariate Cox model and P values from a two-sided Wald test, are shown. d, KM curves showing the probability of OS in P + A or T + A treatment groups dichotomized on the basis of high or low expression of indicated gene. Number of patients in each subgroup were as follows: CD8A: P + A high, n = 26; P + A low, n = 25; T + A high, n = 26; T + A low, n = 27; CXCR6: P + A high, n = 27; P + A low, n = 24; T + A high, n = 25; T + A low, n = 28; CXCR3: P + A high, n = 29; P + A low, n = 22; T + A high, n = 23; T + A low, n = 30; CCL5: P + A high, n = 29; P + A low, n = 22; T + A high, n = 23; T + A low, n = 30. For KM plots, the P value is from a log-rank test with a null hypothesis that there is no difference between the groups. e, Gene score calculated using the average expression of the CD8 gene panel consisting of CXCR3, CXCR6 and CCL5 in tumor bulk RNA-seq samples from patients treated with T + A separated on the basis of clinical response. f, Forest plot comparing high or low expression of composite gene score associated with OS HR in T + A (n = 53 patients) or P + A (n = 51 patients) treatment groups. Mean HR with 95% CIs, determined using a univariate Cox model and P values from a two-sided Wald test, are shown. g, KM curves showing the probability of OS in P + A or T + A treatment groups dichotomized on the basis of high or low composite gene score. Number of patients in each subgroup were as follows: P + A high, n = 26; P + A low, n = 25; T + A high, n = 26; T + A low, n = 27. For KM plots, the P value is from a log-rank test with a null hypothesis that there is no difference between the groups.
Extended Data Fig. 1
Extended Data Fig. 1. Experimental schemas, efficacy and pharmacodynamic data for CT26 and EO771 studies.
a, Experimental schemas. Tumor growth and PD/multi-omics analysis for CT26 and EO771 studies (left); delayed FTY720 treatment in CT26 model (right). b, c, Mouse EO771 orthotopic tumor model. b, FTY720 treatment impairs efficacy of anti-PD-1 and anti-TIGIT treatment in EO771 tumor model. C57BL/6 mice inoculated in mammary fat pad with EO771 tumor cells and treated with isotype control, anti-PD-L1, anti-TIGIT, or the combination of anti-PD-L1 and anti-TIGIT antibodies, with or without FTY720. Tumor growth was monitored and grouped analysis and growth curves for each individual animal are shown (n = 10 animals per group). Data shown are representative of two independent experiments. c, Total numbers of CD8+ T cells, CD4+ T cells or Tregs in dLN (top panels) or tumor (bottom panels) of CT26 tumor-bearing mice treated with isotype control, anti-PD-L1, anti-TIGIT or the combination, with or without FTY720. n = 5 animals per sample and treatment group, mean ± s.d. are represented by bars and whiskers. Data are representative of three independent experiments. Source data
Extended Data Fig. 2
Extended Data Fig. 2. Flow cytometry gating strategies.
a, Representative dot plots for CD226 and gp70 tetramer co-expression on CD8+ T cells in dLN or tumor, or gp70 tetramer staining on CD8+ T cells in blood. b, Representative dot plots for CD226 and PD-1, Tim3 and PD-1 co-expression on CD8+ T cells in dLN. c, Representative dot plots for CD226 and LAG3 or Tim3 and PD-1 co-expression on CD8+ T cells in tumor. d, Representative dot plots for TCF1 and Tox co-expression on CD8+ T cells in dLN or tumor. e, Representative dot plots for IFN-γ and TNF intracellular staining in CD8+ T cells from tumor.
Extended Data Fig. 3
Extended Data Fig. 3. Treatment effects on tumor-specific CD8+ T cells.
a-g, Phenotyping of CD226+ or CD226 gp70+ CD8+ T cells from dLN or tumor, as indicated, of CT26 tumor-bearing mice treated with anti-PD-L1, anti-TIGIT, or combination with or without FTY720. Frequencies of gp70+CD8+ T cells expressing Ki67 (a), naïve phenotype (b), Teff/Tem phenotype (c), Slamf6 and TCF1 co-expression (d), TCF1 and Tim3 co-expression (e), not expressing TCF1 (f) or expressing Tox (g). For a-g, data are represented as mean +/- SD with individual symbols representing individual mice (n = 5 animals per sample and treatment group) and are representative of three independent experiments. p-values are indicated where differences between two groups were determined to be statistically significant by ordinary one-way ANOVA with Tukey’s multiple comparisons test. h-m, anti-TIGIT plus anti-PD-L1 combination treatment increases frequencies of TCF1+Tim+ CD8+ T cells and decreases frequencies of Tox+ CD8+ T cells in EO771 tumor-bearing mice. Mice with established EO771 tumors were treated with isotype control Ab or anti-TIGIT combined with anti-PD-L1, then dLN and tumors were collected on day 7 post-treatment for phenotypic characterization of CD8+ T cells by flow cytometry. h, Frequencies of CD8+ T cells in dLN (left) or tumor (right) as percentage of CD45+ cells. i, Frequencies of CD8+ T cells expressing CD226. j, Frequencies of CD8+ T cells positively stained with tetramer against EO771-specific antigen p15E. k, Frequencies of p15E+CD8+ T cells expressing CD226. l, m, Frequencies of CD226+ (left) or CD226 (right) p15E+CD8+ Teff/Tem cells co-expressing TCF1 and Tim3 (l) or Tox (m). For h-m, data are represented as mean +/- SD with individual symbols represent individual mice (n = 4 animals per sample and group); data are representative of one of two independent experiments. p-values are indicated where difference were determined by unpaired t-test to be statistically significant. n-q, Frequencies of gp70+CD8+ T cells co-expressing Slamf6 and TCF1 (n), co-expressing TCF1 and Tim3 (o), Teff/Tem phenotype (p) or Tox (q) in dLN (left) or tumor (right) of CT26 tumor-bearing mice treated with anti-PD-L1 plus anti-TIGIT combination or combo with anti-CD226 Ab. For n-q, data are represented as mean +/- SD with individual symbols representing individual mice (n = 5 animals per sample and treatment group) and are representative of three independent experiments. p-values are indicated where differences between two groups were determined to be statistically significant by ordinary one-way ANOVA with Tukey’s multiple comparisons test. Source data
Extended Data Fig. 4
Extended Data Fig. 4. Single-cell RNA-seq, TCR-seq and CITE-seq on 245,675 total T cells pooled from CT26 tumor, dLN and blood from 31 mice.
a, UMAP showing T cell clusters representing CD8+ T cells, CD4+ T cells and regulatory T cells. b,c. Treatment group (Group) (b) or tissue source (c) of T cells. d-g. CD8a expression (d), granzyme B expression (e), clone size (f), gp70 ADT counts (g) projected on UMAP. h, CITE-seq relative expression levels for indicated markers are projected on UMAP.
Extended Data Fig. 5
Extended Data Fig. 5. CD8+ T cell marker expression.
Marker expression was measured by scRNA-seq and projected on UMAPs comprised of CD8+ T cells from CT26 tumor, dLN and blood. n = 155,496 cells in all plots.
Extended Data Fig. 6
Extended Data Fig. 6. Multiomic analysis of CD8+ T cells.
a, CD8+ T cell cluster composition by individual mice in each treatment group. Each color represents an individual mouse. Data show that no cluster came solely from a single animal or experimental group. b, Treatment group (Group) and tissue source projected on CD8+ T cell UMAP. c, Clone size and ADT counts projected on CD8+ T cell UMAP. In panels (b) and (c), n = 155,496 cells. d–f. CD8+ T cell marker expression measured by CITE-seq. d, Relative marker expression levels determined using CITE-seq antibodies projected on UMAPs comprised of CD8+ T cells from CT26 tumor, dLN and blood. e, Heatmap of relative CITE-seq marker expression levels in each CD8+ T cell cluster. f, Heatmap of relative CITE-seq marker expression levels in tissues under various treatment conditions. Source data
Extended Data Fig. 7
Extended Data Fig. 7. Characterization of CD8+ T cell clusters.
a, Heatmap showing clusters defined using metadata from Li et al., where CD8T1 are likely naïve, CD8T2 has Tscm/memory properties, CD8T4 has activated effector cell properties, and CD8T5 has an exhausted phenotype. CD8T1 and CD8T2 were described as T cells that recently entered the tumor, while CD8T4 and CD8T5 were cells resident in tumor. CD8T2 also have the capacity to recirculate from tumor to dLN. b, RNA velocity projections on UMAPs for each treatment group in dLN (top) and tumour (bottom). c, UMAPs showing cluster composition in dLN (Lymph), tumor and blood from CT26 tumor-bearing mice treated with isotype control, anti-PD-L1, anti-TIGIT, combination, or combination with FTY720. Source data
Extended Data Fig. 8
Extended Data Fig. 8. Characterization of tumor-specific CD8+ T cell cluster composition.
CD8+ T cell cluster composition segregated by specificity for gp70, determined by comparing ADT counts for gp70 tetramers, requiring that they be higher than control tetramer count by a Poisson test with a one-sided p-value < 1×10⁻⁶. The proportion of each cluster within total CD8+ T cells from the indicated tissue for each treatment group is shown. Each symbol represents an individual mouse; each color identifies the same mouse within the treatment group. Source data
Extended Data Fig. 9
Extended Data Fig. 9. Clonal diversity of CD8+ T cells.
a, Scatterplots showing primary clusters of each individual clonotype in dLN and blood at day 7 (D7 Blood). n represents the total number of clones within a cluster in each scatterplot; nB is the number of clones observed in blood at day 7; nBB is the number of clones in blood at day 7 with clone size greater than 1. Color of circles denote cluster designation as shown in panels (b) and (c). b, c, Cluster composition for the 30 largest clonotypes from tumor (upper panels), D7 blood (middle panels) or dLN (lower panels) of CT26 tumor-bearing mice treated with isotype control, anti-PD-L1, anti-TIGIT, combination, or combination with FTY720, shown as (b) absolute numbers, or (c) normalized against the total number of cells for each individual clonotype (total cell number = 1). Cluster identity is indicated by color. In (b), clonotypes from individual mice within each treatment group are identified by the color legend at the top of the tumor bar graphs. Individual mice are labeled as S”group number”.”mouse number”. gp70+ clones are identified by black symbol at the top of the bar graphs. Source data
Extended Data Fig. 10
Extended Data Fig. 10. Analysis of human CD8+ T cell clusters.
Association of human CD8+ T cell clusters corresponding to mouse reference with response in tiragolumab plus atezolizumab Ph1b and Ph2 NSCLC clinical trials. a. scRNA-seq of 144,413 human CD8+ T cells from blood of patients in a Ph1b NSCLC study of tiragolumab plus atezolizumab (T + A). Human genes were renamed to their mouse ortholog (if present) and gene expression was normalized before sample integration and projection onto a mouse CD8+ T cell reference UMAP. b. Predicted cell type score for mapped human CD8+ T cells for each assigned mouse CD8+ T cell reference cluster. c. Frequencies of human predicted clusters in patients with complete or partial response (CRPR) compared to stable or progressive disease (SDPD) on cycle 2 day 1 of treatment with T + A in the Ph1b study. Percent total was calculated as the percentage of the cluster in total CD8+ T cells for each patient. d. Forest plot comparing high or low expression of the top corresponding human 18-20 signature genes (signature gene score) from each mouse CD8+ T cell cluster or CD8A and their association with overall survival (OS) hazard ratio (HR) T + A or placebo plus atezolizumab (P + A) treatment groups in Ph2 CITYSCAPE. Mean HR with 95% confidence intervals and p-values are shown. e, Kaplan-Meier curves showing OS probability in P + A or T + A treatment groups dichotomized on the basis of high or low CD8+ T cell cluster gene scores from each reference cluster. p-value is from log-rank test with null hypothesis that there is no difference between the groups. f. Kaplan-Meier curves comparing progression-free survival (PFS, left) or OS (right) in patients from the phase 3 NSCLC OAK study who received atezolizumab monotherapy. Patients were dichotomized by median gene score calculated using the average expression of the CD8 gene panel comprised of CXCR3, CXCR6 and CCL5.

References

    1. Mellman, I., Chen, D. S., Powles, T. & Turley, S. J. The cancer-immunity cycle: indication, genotype, and immunotype. Immunity56, 2188–2205 (2023). - PubMed
    1. Chiang, E. Y. & Mellman, I. TIGIT–CD226–PVR axis: advancing immune checkpoint blockade for cancer immunotherapy. J. Immunother. Cancer10, e004711 (2022). - PMC - PubMed
    1. Cho, B. C. et al. Tiragolumab plus atezolizumab versus placebo plus atezolizumab as a first-line treatment for PD-L1-selected non-small-cell lung cancer (CITYSCAPE): primary and follow-up analyses of a randomised, double-blind, phase 2 study. Lancet Oncol.23, 781–792 (2022). - PubMed
    1. Guan, X. et al. Anti-TIGIT antibody tiragolumab leverages myeloid cells and regulatory T cells to improve PD-L1 checkpoint blockade. Nature627, 646–655 (2024). - PMC - PubMed
    1. Johnston, R. J. et al. The immunoreceptor TIGIT regulates antitumor and antiviral CD8+ T cell effector function. Cancer Cell26, 923–937 (2014). - PubMed

MeSH terms

Substances