. 2024 Dec 9;2(1):78.
doi: 10.1186/s44263-024-00103-z.

Patterns and drivers of excess mortality during the COVID-19 pandemic in 13 Western European countries

Collaborators, Affiliations

Patterns and drivers of excess mortality during the COVID-19 pandemic in 13 Western European countries

Simon Galmiche et al. BMC Glob Public Health. .

Abstract

Background: Important differences in excess mortality between European countries during the COVID-19 pandemic have been reported. Understanding the drivers of these differences is essential to pandemic preparedness.

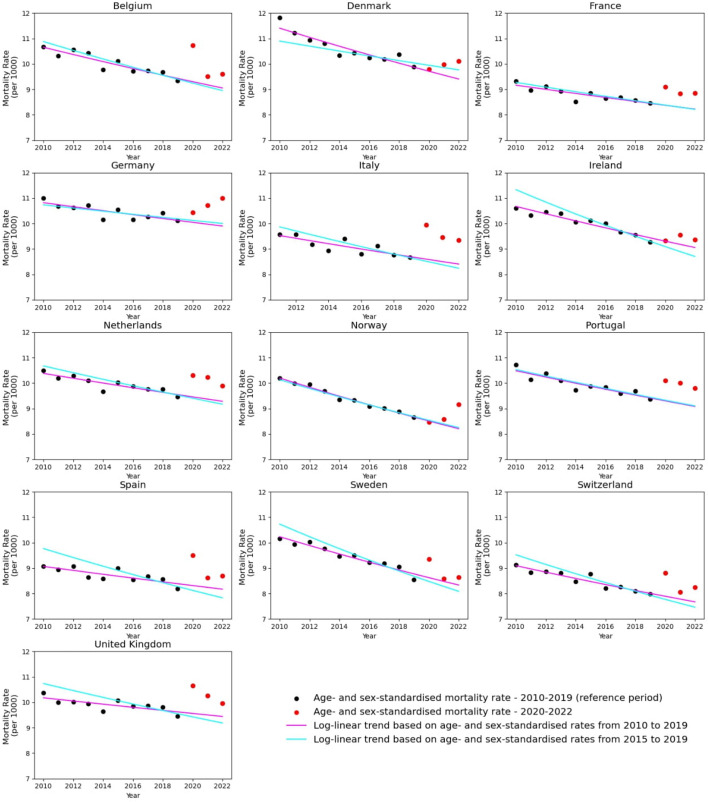
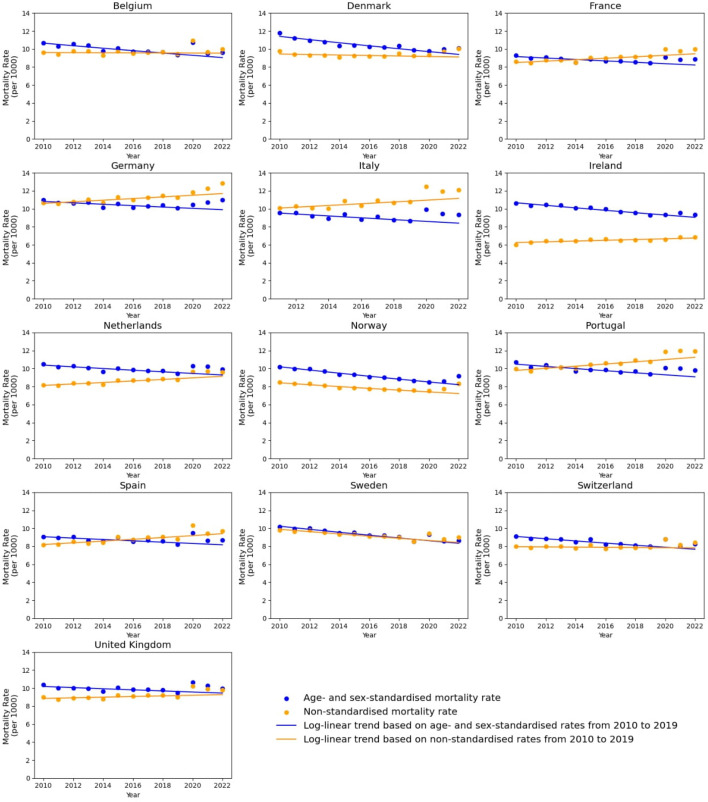
Methods: We examined patterns in age- and sex-standardized cumulative excess mortality in 13 Western European countries during the first 30 months of the COVID-19 pandemic and the correlation of country-level characteristics of interest with excess mortality.

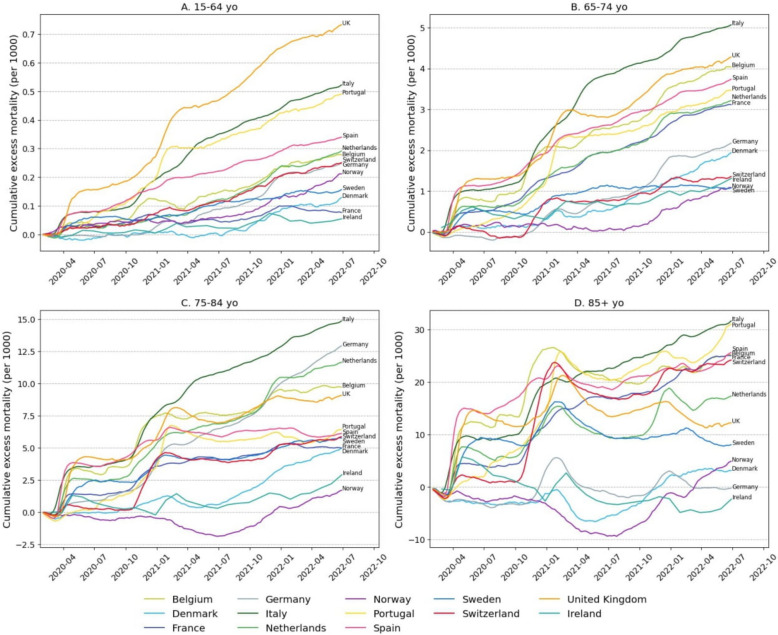
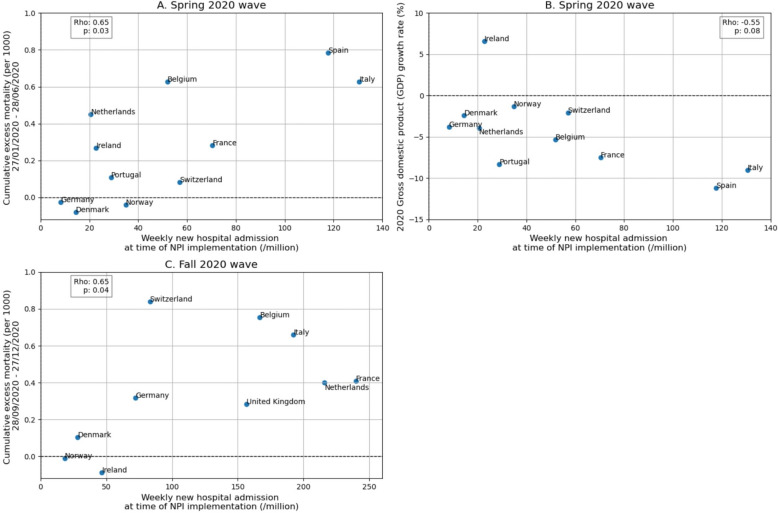
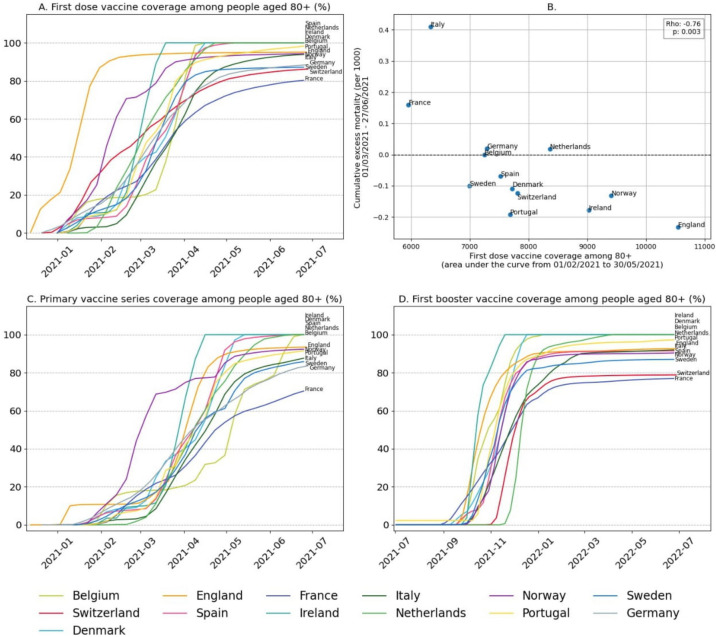
Results: In a timeline analysis, we identified notable differences in seeding events, particularly in early 2020 and when the Alpha variant emerged, likely contributing to notable differences in excess mortality between countries (lowest in Denmark during that period). These differences were more limited from July 2021 onwards. Lower excess mortality was associated with implementing stringent non-pharmaceutical interventions (NPIs) when hospital admissions were still low in 2020 (correlation coefficient rho = 0.65, p = 0.03) and rapid rollout of vaccines in the elderly in early 2021 (rho = - 0.76, p = 0.002). Countries which implemented NPIs while hospital admissions were low tended to experience lower gross domestic product (GDP) losses in 2020 (rho = - 0.55, p = 0.08). Structural factors, such as high trust in the national government (rho = - 0.77, p = 0.002) and low ratio of population at risk of poverty (rho = 0.55, p = 0.05), were also associated with lower excess mortality.

Conclusions: These results suggest the benefit of early implementation of NPIs and swift rollout of vaccines to the most vulnerable. Further analyses are required at a more granular level to better understand how these factors impacted excess mortality and help guide pandemic preparedness plans.

Keywords: COVID-19; COVID-19 / prevention & control; COVID-19 vaccines; Western Europe.


Conflict of interest statement

Declarations. Ethics approval and consent to participate: Not applicable. Consent for publication: Not applicable. Competing interests: The authors declare no competing interests.

Figures

Fig. 1
Fig. 1
Annual age- and sex-standardized mortality rates between 2010 (2011 for Italy) and 2022. Log-linear models fitted to data from 2010 (2011 for Italy) to 2019 and 2015 to 2019. Each point includes data for the full year, thus including the weeks preceding the period of interest in early 2020 (before 27 January) and following the period of interest in late 2022 (after 3 July). Weekly mortality data are provided by the Human Mortality Database (except for Ireland for which monthly mortality data are provided by the Irish Central Statistics Office). Age strata are defined as 0–14, 15–64, 65–74, 75–84, and 85 years and above. The reference population for age and sex distribution is the 2013 edition of the European Standard Population
Fig. 2
Fig. 2
Annual age- and sex-standardized and non-standardized mortality rates between 2010 (2011 for Italy) and 2022. Log-linear models fitted to data from 2010 (2011 for Italy) to 2019.  Each point includes data for the full year, thus including the weeks preceding the period of interest in early 2020 (before 27 January) and following the period of interest in late 2022 (after 3 July)
Fig. 3
Fig. 3
Age-stratified cumulative excess mortality rates across 13 Western European countries from 27 January 2020 to 3 July 2022. A 15–64 years old. B 65–74 years old. C 75–84 years old. D People aged 85 years and above. Data for 0–14 years old not shown
Fig. 4
Fig. 4
Age- and sex-standardized cumulative excess mortality rate in 13 Western European countries. A 27 January 2020 to 28 June 2020 (historical strain). B 29 June 2020 to 27 June 2021 (historical strain, followed by predominance of the Alpha variant). C 28 June 2021 to 3 July 2022 (predominance of the Delta variant followed by predominance of the Omicron variant and its descendent lineages)
Fig. 5
Fig. 5
Correlation of weekly hospital admission rate on the day of implementation of non-pharmaceutical interventions with excess mortality and with the change in gross domestic product in 2020. Correlation coefficients are Spearman’s rank coefficients. A Spring 2020, excess mortality from 27 January 2020 to 28 June 2020. B Spring 2020, change in GDP in 2020. C Fall 2020, excess mortality from 28 September 2020 to 3 January 2021. Italy opted for a stepwise implementation of restrictions in the fall of 2020. Among the possible dates, we retained the one closest to the peak of hospital admissions during that period minus 11 days (approximate time from infection to hospital admission): Italy opted for a nationwide stay-at-home recommendation as well as closure of nonessential shops and leisure venues on 26 October. Implementation of NPIs happened at the regional level during this period in Spain
Fig. 6
Fig. 6
Vaccine coverage in individuals 80 years of age and older (%). A First-dose coverage between 13 December 2020 to 30 June 2021. B Correlation of area under the curve of the vaccine coverage between 1 February 2021 and 30 May 2021 with the age- and sex-standardized cumulative excess mortality rate between 1 March and 27 June 2021. C Full primary vaccine series 13 December 2020 to 30 June 2021. D First booster 1 July 2021 to 30 June 2021. Data sources are available in Additional file 1: Table S1. For some countries, the coverage provided by the European Centre for Disease Prevention and Control exceeded 100% (likely due to imprecise denominator data on the number of individuals 80 years of age and older). We capped this coverage at 100% when it was first reached. Data for booster vaccine coverage in Germany are available only among people aged 60 years and older. The coverage in this age group was 6.7% on 3 November 2021, 26.0% on 1 December 2021, and 61.8% on 1 January 2022

References

    1. World Health Organization. Global excess deaths associated with COVID-19 (modelled estimates) n.d. https://www.who.int/data/sets/global-excess-deaths-associated-with-covid... . Accessed 11 Apr 2024.
    1. Shalal A. IMF sees cost of COVID pandemic rising beyond $12.5 trillion estimate. Reuters. 2022.
    1. Msemburi W, Karlinsky A, Knutson V, Aleshin-Guendel S, Chatterji S, Wakefield J. The WHO estimates of excess mortality associated with the COVID-19 pandemic. Nature. 2023;613:130–7. 10.1038/s41586-022-05522-2. - PMC - PubMed
    1. Karlinsky A, Kobak D. Tracking excess mortality across countries during the COVID-19 pandemic with the World Mortality Dataset. eLife. 2021;10:e69336. 10.7554/eLife.69336. - PMC - PubMed
    1. COVID-19 Excess Mortality Collaborators. Estimating excess mortality due to the COVID-19 pandemic: a systematic analysis of COVID-19-related mortality, 2020–21. Lancet Lond Engl. 2022;399:1513–36. 10.1016/S0140-6736(21)02796-3.5. - PMC - PubMed

LinkOut - more resources