. 2024 Dec 6;16(23):4087.
doi: 10.3390/cancers16234087.

Plakin Expression in Serous Epithelial Ovarian Cancer Has the Potential to Impede Metastatic Spread and Epithelial-Mesenchymal Transition: A Comparative Expression Analysis of Immunohistochemical and In Silico Datasets

Affiliations

Plakin Expression in Serous Epithelial Ovarian Cancer Has the Potential to Impede Metastatic Spread and Epithelial-Mesenchymal Transition: A Comparative Expression Analysis of Immunohistochemical and In Silico Datasets

Tamsin Wesley et al. Cancers (Basel). .

Abstract

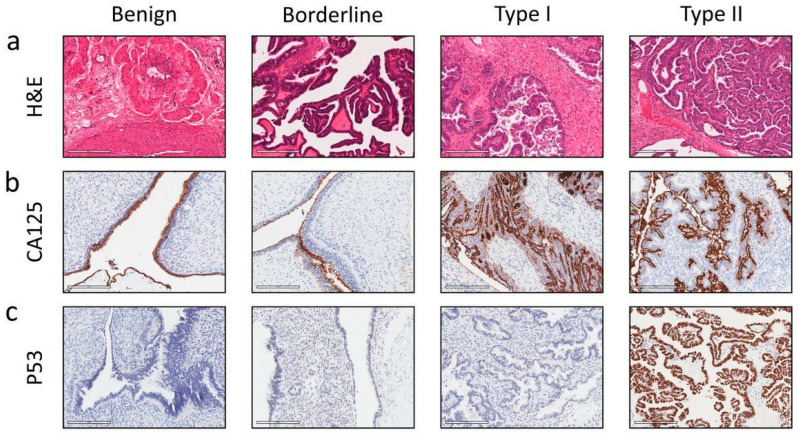
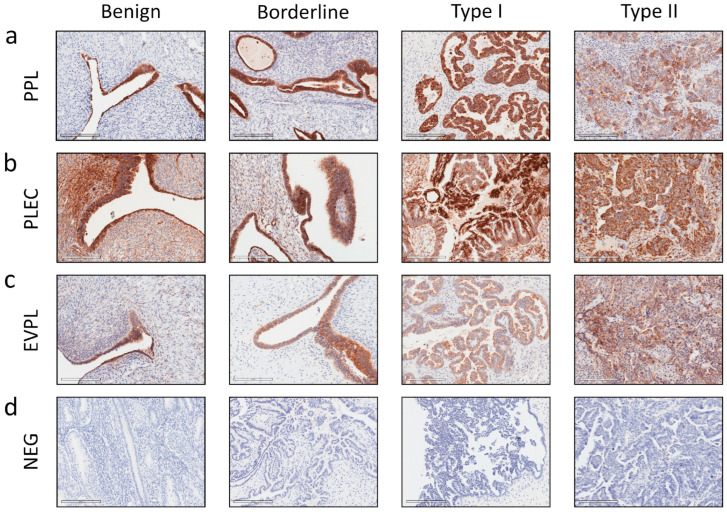
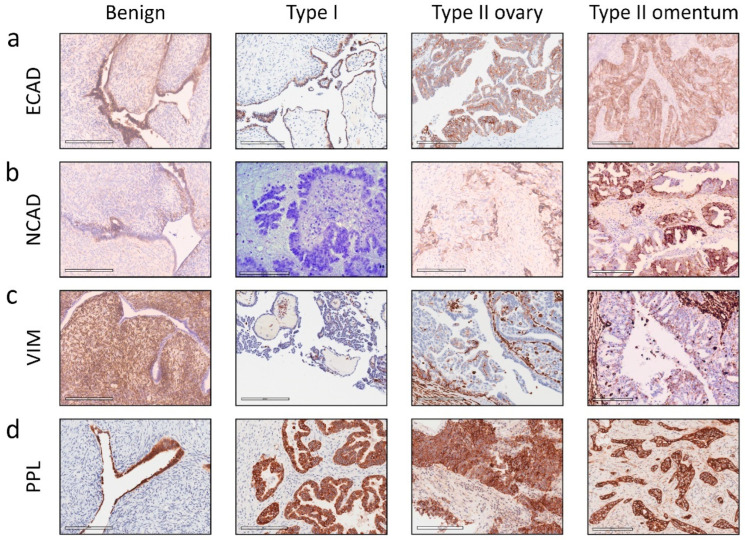
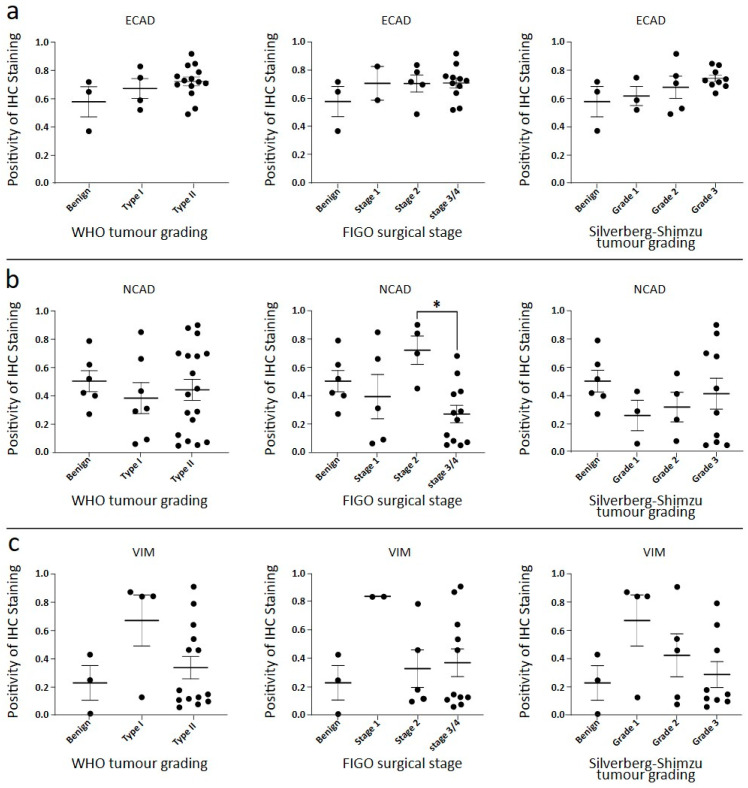
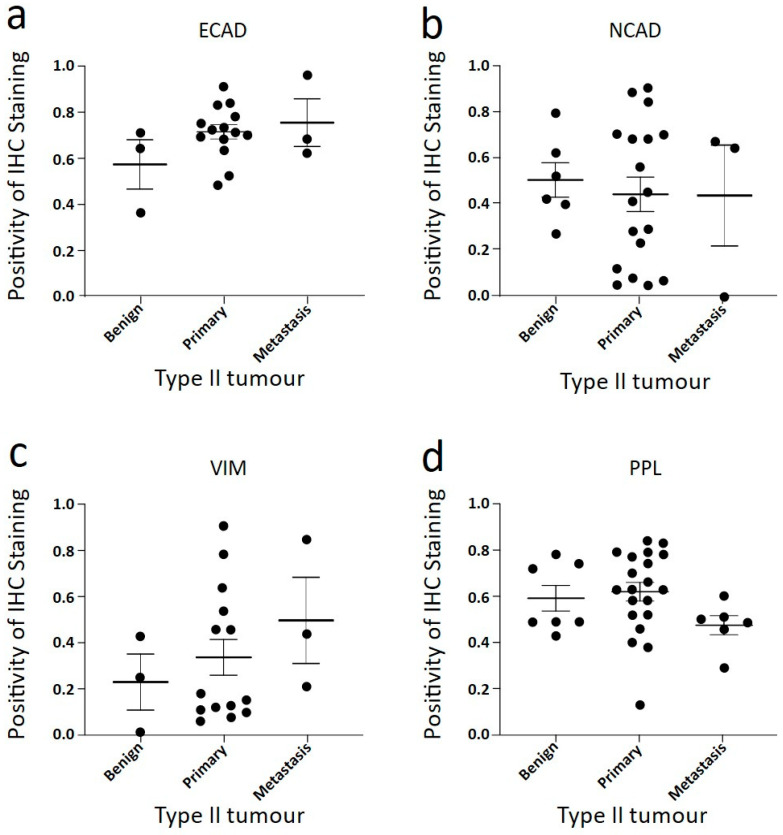
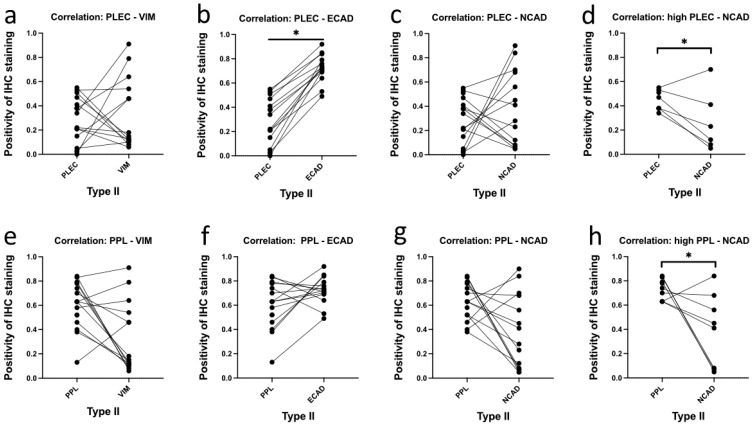
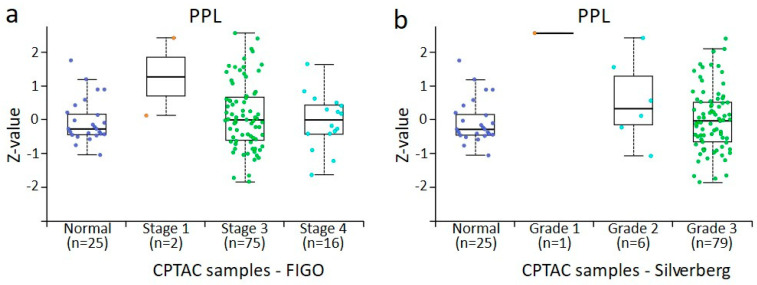
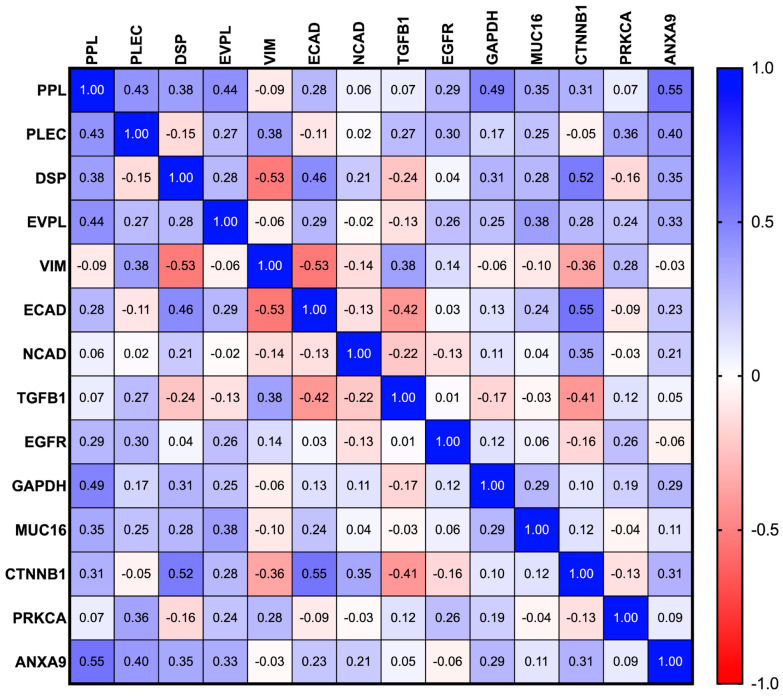
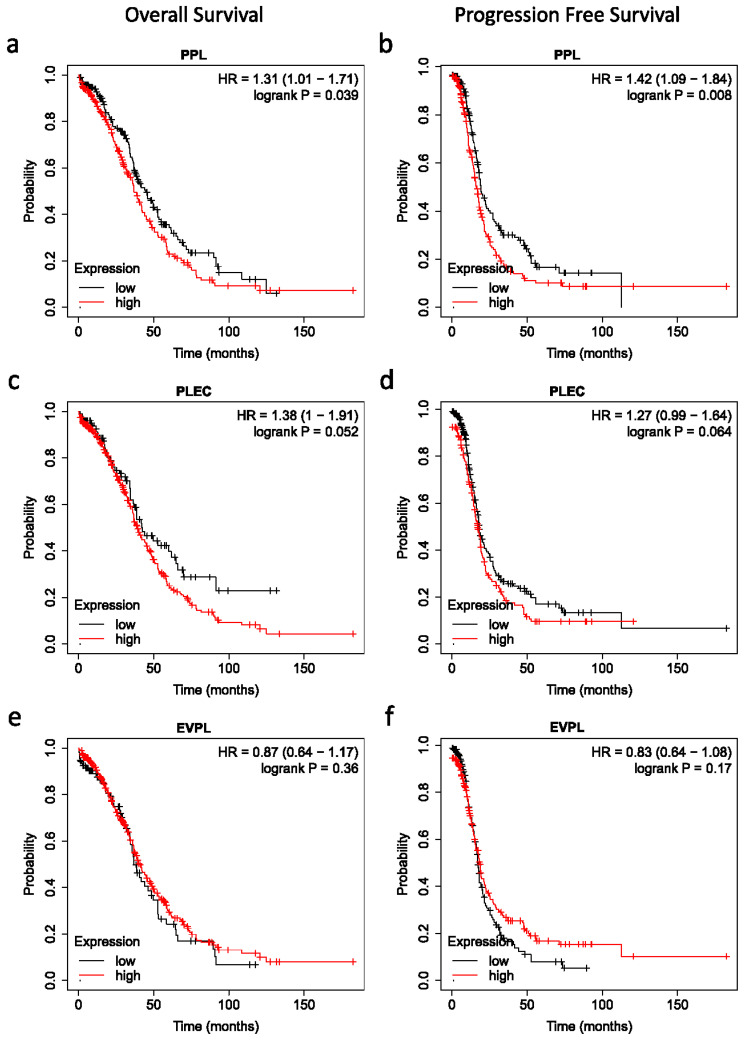
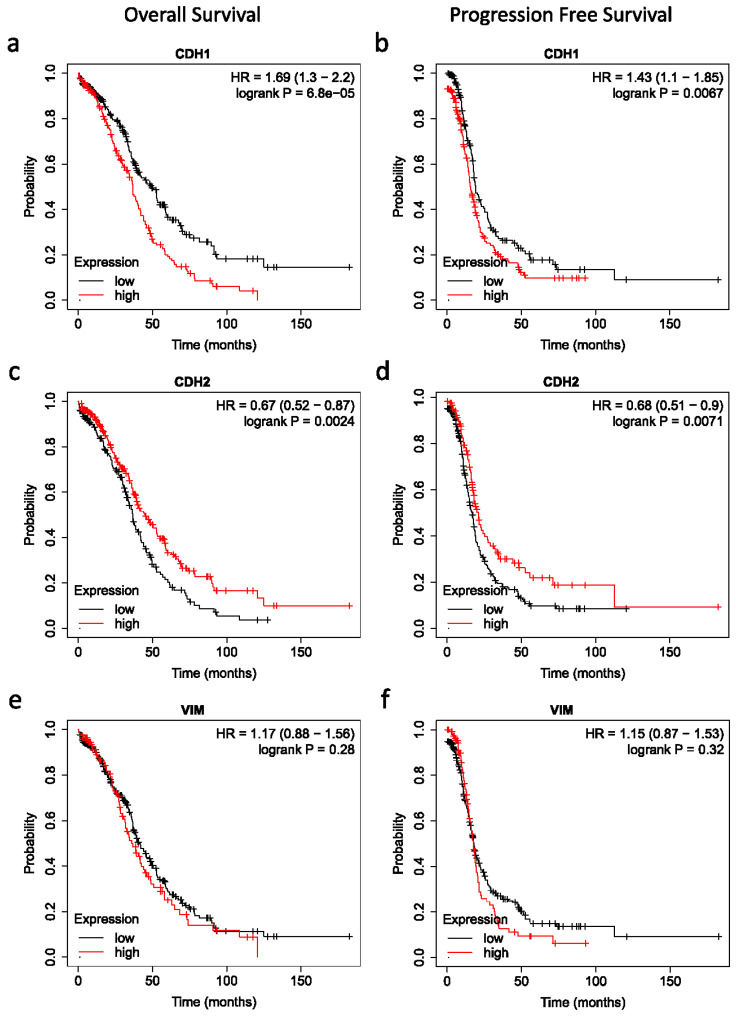
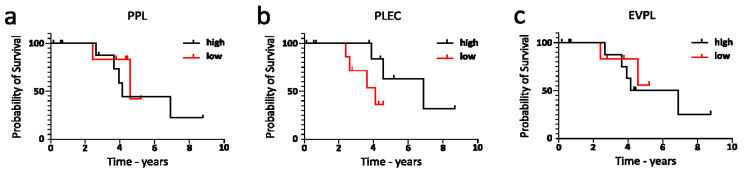
Epithelial ovarian cancer is aggressive and causes high mortality among women worldwide. Members of the plakin family are essential to maintain cytoskeletal integrity and key cellular processes. In this study we characterised the expression of plakins, particularly plectin (PLEC), periplakin (PPL), envoplakin (EVPL), and EMT-related proteins by immunohistochemistry in n = 48 patients' samples to evaluate a potential correlation of plakin expression with EMT as EOC progresses. These tissue plakin and EMT expression analyses were further evaluated by in vitro cell line expression and correlated with the expression of these molecules using publicly available datasets such as Cancer Genome Atlas (TCGA) and Clinical Proteome Tumour Analysis Consortium (CPTAC) datasets. We demonstrate that the expression of PPL and PLEC plakins is decreased in high-grade compared to low-grade EOCs with mixed EMT marker protein expression. This is supported by the correlation of high PPL and PLEC expression with an epithelial rather than mesenchymal phenotype. Our data suggest a partial loss of plakin expression as EOC tumours progress. This may impact the connections of plakins with membrane-bound receptors, which impede the downstream signalling required for the initiation of EMT as the tumours progress.

Keywords: ascites; epithelial ovarian cancer; epithelial–mesenchymal transition; in silico datasets; metastasis; plakins.


Conflict of interest statement

The authors declare no competing interests.

Figures

Figure 1
Figure 1
Representative images of benign and cancerous solid ovarian tumours evaluated by immunohistochemistry. Representative images of benign ovarian tissue, Silverberg borderline, WHO Type I and Type II tumours. (a) Cell morphology, H&E, (b) CA125 glycoprotein staining and (c) p53 immunostaining. Protein expression was deduced using immunohistochemistry, images were taken using a Leica DLMB microscope with attached Leica DFC450C camera and Leica Application Suite software (LAS, version 4.8.0), ×40 magnification, or from Aperio Imagescope software 12.8.
Figure 2
Figure 2
Representative images of plakin expression in benign and cancerous solid ovarian tumours evaluated by immunohistochemistry. Representative images of protein expression using immunohistochemistry in benign ovarian tissue, borderline, Type I and Type II tumours. (a) PPL, (b) PLEC, (c) EVPL immunostaining, and (d) IHC negative control image using secondary-only anti-mouse HRP-labelled DAB staining. Images were taken using a Leica DLMB microscope with attached Leica DFC450C camera and LAS software 4.8.0, ×40 magnification (D ×20 magnification) or from Aperio Imagescope software 12.3.
Figure 3
Figure 3
Quantitative analysis of plakins staining in benign ovarian tissues and serous ovarian tumours. Quantification of plakin protein expression staining using DAB immunohistochemistry. Positivity output from Aperio was normalized to background (non-epithelial cell) staining. Quantification of IHC staining: (a) PPL, (b) PLEC and (c) EVPL for each of cases sorted by WHO tumour Type, cases sorted by FIGO surgical stage, (blue data points represent WHO Type I cases) and cases sorted by Silverberg–Shimizu tumour grade. For PPL expression at a), statistical significance measured by one-way ANOVA, * p < 0.05, ** p < 0.01, *** p < 0.005. For PLEC at (b), statistical significance measured by one-way ANOVA, * p < 0.05. For EVPL at (c), statistical significance was measured by one-way ANOVA; no significance was determined between the groups.
Figure 4
Figure 4
Representative images of benign and cancerous solid ovarian tumours evaluated by immunohistochemistry for EMT markers. Representative images of benign ovarian tissue, WHO Type I tumours and WHO Type II tumour deposits in both ovary and omentum (pre-chemotherapy). (a) ECAD, (b) NCAD, (c) VIM, and (d) PPL immunostaining. Protein expression staining using DAB immunohistochemistry, images taken from Aperio slide scans, ×20 magnification.
Figure 5
Figure 5
Quantitative analysis of EMT marker staining in benign tissues and serous ovarian tumours. EMT marker protein expression staining using DAB immunohistochemistry. Positivity output from Aperio was normalized to background staining. Quantification of IHC staining for (a) ECAD, (b) NCAD, and (c) VIM for cases sorted by WHO tumour grade, cases sorted by FIGO surgical stage, and cases sorted by Silverberg–Shimizu tumour grade. For ECAD at (a), statistical significance measured by one-way ANOVA, no significance found. For NCAD at (b), statistical significance measured by one-way ANOVA, * p = 0.015. For VIM at (c), statistical significance measured by one-way ANOVA; no significance was found.
Figure 6
Figure 6
Quantitative analysis of EMT marker staining in benign tissues, ovarian (primary) WHO Type II cases and omental (metastatic) deposits. Analysis of EMT marker staining in benign tissues, ovarian (primary) WHO Type II cases and omental (metastatic) deposits. (a) ECAD stained WHO Type II cases sorted by origin of tumours, (b) NCAD stained WHO Type II cases sorted by origin of tumours, (c) VIM stained WHO Type II cases sorted by origin of tumours and (d) PPL stained WHO Type II cases sorted by origin of tumours. Statistical significance measured by one-way ANOVA; no significance was found.
Figure 7
Figure 7
Correlation of PLEC and PPL with EMT markers in WHO Type II primary tumour samples. Pearson correlation analysis of PLEC and PPL staining with EMT marker expression in Type II tumours from IHC staining. Top row: (a) PLEC vs. VIM, (b) PLEC vs. ECAD * p < 0.05, (c) PLEC vs. NCAD, (d) high PLEC (cases above mean PLEC expression) vs. NCAD * p < 0.05. Bottom row: (e) PPL vs. VIM, (f) PPL vs. ECAD, (g) PPL vs. NCAD, (h) high PPL (cases above mean PPL expression) vs. NCAD * p < 0.05.
Figure 8
Figure 8
Morphological features of ovarian cancer cell lines. Representative phase contrast images of CAOV3, OVCAR4, OVCAR5, and HEY cell lines grown in monolayer culture. Magnification: 20× magnification, scale bar = 100 um.
Figure 9
Figure 9
mRNA expression of plakins and EMT markers in ovarian cancer cell lines. (a) mRNA expression of PPL, EVPL, and PLEC in CAOV3, OVCAR4, OVCAR5, and HEY cell lines were measured as described in Methods. Data is expressed as mRNA expression of gene of interest fold-change relative to 18S rRNA housekeeping gene. n = 3, biological and technical triplicates were performed. One-way ANOVA performed, * p < 0.05, ** p < 0.01. (b) mRNA expression of VIM, ECAD, and NCAD was evaluated as described in the methods. Data are expressed as gene of interest fold-change relative to 18S rRNA housekeeping gene. n = 3, biological and technical triplicates were performed. Biological and technical triplicates were performed, n = 3, statistical analysis was not performed.
Figure 10
Figure 10
PPL protein expression from CPTAC dataset in ovarian cancer by surgical tumour stage (FIGO) and Silverberg grade. All cases are from CPTAC from the UALCAN [48]. (a) Ovarian tumours compared by surgical stage, (b) ovarian tumours compared by Silverberg grade. Insufficient data points were available for statistical comparison of all grades and stages. Student’s t-test with consideration of unequal variance with p < 0.001 was found when surgical stage 3 and stage 4 were compared and Silverberg grade 2 versus grade 3, where both grades commonly fall within the WHO Type II definition.
Figure 11
Figure 11
PLEC protein expression from CPTAC dataset in ovarian cancer by surgical tumour stage (FIGO) and Silverberg grade. All cases are from CPTAC from the UALCAN [48]. (a) Ovarian tumours compared by surgical stage, (b) ovarian tumours compared by Silverberg grade. Insufficient data points were available for statistical comparison of all grades and stages. Student’s t-test with consideration of unequal variance with p < 0.001 was found when surgical stage 3 and stage 4 were compared and Silverberg grade 2 versus grade 3, where both grades commonly fall within the WHO type II definition.
Figure 12
Figure 12
ECAD protein expression from CPTAC dataset in ovarian cancer by surgical tumour stage (FIGO) and Silverberg grade. All cases are from CPTAC from the UALCAN [48]. (a) Ovarian tumours compared by surgical stage, (b) ovarian tumours compared by Silverberg grade. Insufficient data points were available for statistical comparison of all grades and stages. Student’s t-test with consideration of unequal variance with p < 0.001 was found when normal tissue was compared to surgical stage 3 and stage 4, and between stage 3 and stage 4. In normal versus grade 2 p < 0.05, normal versus grade 3 p < 0.001, and Silverberg grade 2 versus grade 3 p < 0.001, where both grades commonly fall within the WHO Type II definition.
Figure 13
Figure 13
NCAD protein expression CPTAC dataset in ovarian cancer by surgical tumour stage (FIGO) and Silverberg grade. All cases are from CPTAC from the UALCAN [48]. (a) Ovarian tumours compared by surgical stage, (b) ovarian tumours compared by Silverberg grade. Insufficient data points were available for statistical comparison of all grades and stages. Student’s t-test with consideration of unequal variance with p < 0.001 was found when surgical stage 3 and stage 4 were compared and Silverberg grade 2 versus grade 3, where both grades commonly fall within the WHO Type II definition.
Figure 14
Figure 14
VIM protein expression from CPTAC dataset in ovarian cancer by surgical tumour stage (FIGO) and Silverberg grade. All cases are from CPTAC from the UALCAN [48]. (a) Ovarian tumours compared by surgical stage, (b) ovarian tumours compared by Silverberg grade. Insufficient data points were available for statistical comparison of all grades and stages. Student’s t-test with consideration of unequal variance with p < 0.001 was found when normal versus surgical stage 3, and stage 3 versus stage 4 were compared. In normal tissue versus Silverberg grade 3 p < 0.001, and Silverberg grade 2 versus grade 3 p < 0.001, where both grades commonly fall within the WHO Type II definition.
Figure 15
Figure 15
Pearson r correlation of the protein expression of plakins with EMT markers and plakin associated proteins from TCGA dataset. All cases are WHO Type II ovarian tumours with p53 mutations from the dataset titled Ovarian Serous Cystadenocarcinoma (TCGA, Nature 2011) [49]. Data analysis and correlation plot are produced with GraphPad Prism 10.2.0 software. Comparison of plakin proteins of interest and classical and alternative markers of EMT. Weak correlation between 0 and 0.3 (or −0.3), moderate between 0.3 and 0.5, and very strong above 0.5, n = 79.
Figure 16
Figure 16
Pearson r correlation of the mRNA expression of plakins with EMT markers and plakin associated proteins from TCGA dataset. All cases are WHO Type II ovarian tumours with p53 mutations from the dataset titled Ovarian Serous Cystadenocarcinoma (TCGA, Nature 2011) [49]. Data analysis and correlation plot were produced with GraphPad Prism 10.2.0 software. Comparison of plakin mRNA of interest and classical and alternative markers of EMT. Weak correlation between 0 and 0.3 (or −0.3), moderate between 0.3 and 0.5, and very strong above 0.5, n = 240.
Figure 17
Figure 17
Kaplan–Meier analysis of overall and progression-free survival of patients in relation to mRNA expression of plakins. Cases analysed using the Kaplan–Meier Plotter website, dataset titled Ovarian Serous Cystadenocarcinoma (TCGA, Nature 2011) [49], with these conditions: WHO Type II serous ovarian cancer with p53 mutations, all treatment Types, and auto-threshold selection of high versus low expression. (a) PPL mRNA expression in relation to overall survival, (b) PPL mRNA expression in relation to progression-free survival, (c) PLEC mRNA expression in relation to overall survival, (d) PLEC mRNA expression in relation to progression-free survival, (e) EVPL mRNA expression in relation to overall survival, (f) EVPL mRNA expression in relation to progression-free survival. Sample numbers: n = 418 for OS, n = 398 for PFS, samples without relevant data were omitted.
Figure 18
Figure 18
Kaplan–Meier analysis of overall and progression-free survival of patients in relation to mRNA expression of EMT markers. Cases analysed using the Kaplan–Meier Plotter website, dataset titled Ovarian Serous Cystadenocarcinoma (TCGA, Nature 2011) [49], with these conditions: WHO Type II serous ovarian cancer with p53 mutations, all treatment types, and auto-threshold selection of high versus low expression. (a) ECAD mRNA expression in relation to overall survival, (b) ECAD mRNA expression in relation to progression-free survival, (c) NCAD mRNA expression in relation to overall survival, (d) NCAD mRNA expression in relation to progression-free survival, (e) VIM mRNA expression in relation to overall survival, (f) VIM mRNA expression in relation to progression-free survival. Sample numbers: n = 418 for overall survival, n = 398 for progression-free survival, samples without relevant data were omitted.
Figure 19
Figure 19
Overall survival in relation to high and low expression of PPL (a), PLEC (b), and EVPL (c) in RWH cases (WHO Type II only). Data analysis and survival graphs produced with GraphPad Prism 10.2.0 software of the protein expression and survival data of the WHO Type II cases presented in Figure 1, Figure 2, Figure 3, Figure 4, Figure 5, Figure 6 and Figure 7. Cases separated by level of plakin protein expression, high—above mean identified in Figure 2, low—below mean in Figure 3. No significant difference was found using Mantel–Cox (log-rank) test.

Similar articles

Cited by

References

    1. Lheureux S., Gourley C., Vergote I., Oza A.M. Epithelial ovarian cancer. Lancet. 2019;393:1240–1253. doi: 10.1016/S0140-6736(18)32552-2. - DOI - PubMed
    1. Lengyel E. Ovarian cancer development and metastasis. Am. J. Pathol. 2010;177:1053–1064. doi: 10.2353/ajpath.2010.100105. - DOI - PMC - PubMed
    1. Bray F., Laversanne M., Sung H., Ferlay J., Siegel R.L., Soerjomataram I., Jemal A. Global cancer statistics 2022: GLOBOCAN estimates of incidence and mortality worldwide for 36 cancers in 185 countries. CA Cancer J Clin. 2024;74:229–263. - PubMed
    1. Momenimovahed Z., Tiznobaik A., Taheri S., Salehiniya H. Ovarian cancer in the world: Epidemiology and risk factors. Int. J. Women’s Health. 2019;11:287–299. doi: 10.2147/IJWH.S197604. - DOI - PMC - PubMed
    1. Latifi A., Escalona R., Quinn M.A., Thompson E.W., Findlay J.K., Ahmed N. Distinct molecular signature of recurrent ovarian tumor cells isolated from the ascites of advanced-stage serous ovarian cancer patients. J. Cancer Stem Cell Res. 2014;2:e10061-20. doi: 10.14343/JCSCR.2014.2e1006. - DOI

LinkOut - more resources