. 2024 Nov 23;13(23):1952.
doi: 10.3390/cells13231952.

Overexpression of Egr1 Transcription Regulator Contributes to Schwann Cell Differentiation Defects in Neural Crest-Specific Adar1 Knockout Mice

Affiliations

Overexpression of Egr1 Transcription Regulator Contributes to Schwann Cell Differentiation Defects in Neural Crest-Specific Adar1 Knockout Mice

Lisa Zerad et al. Cells. .

Abstract

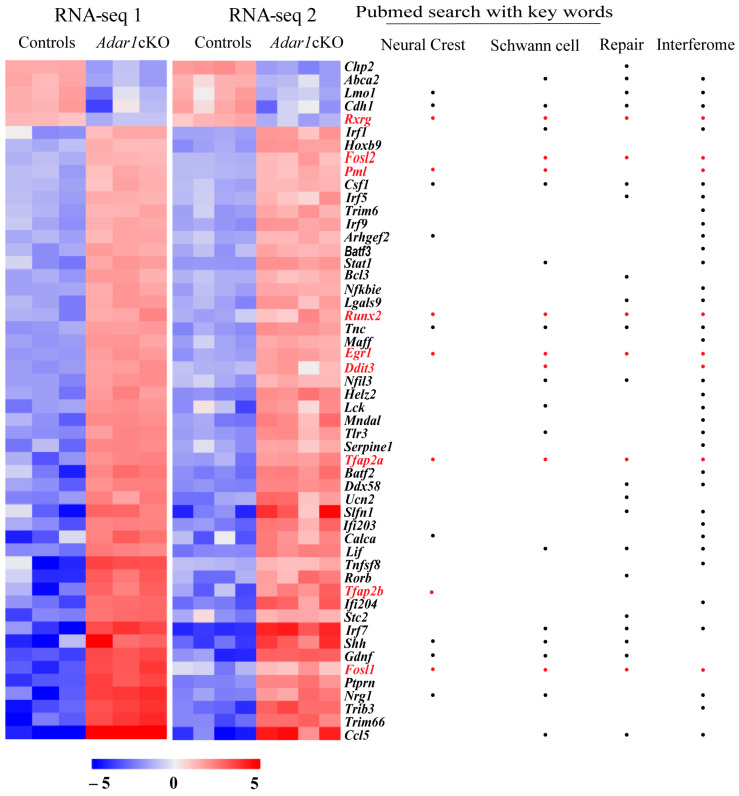
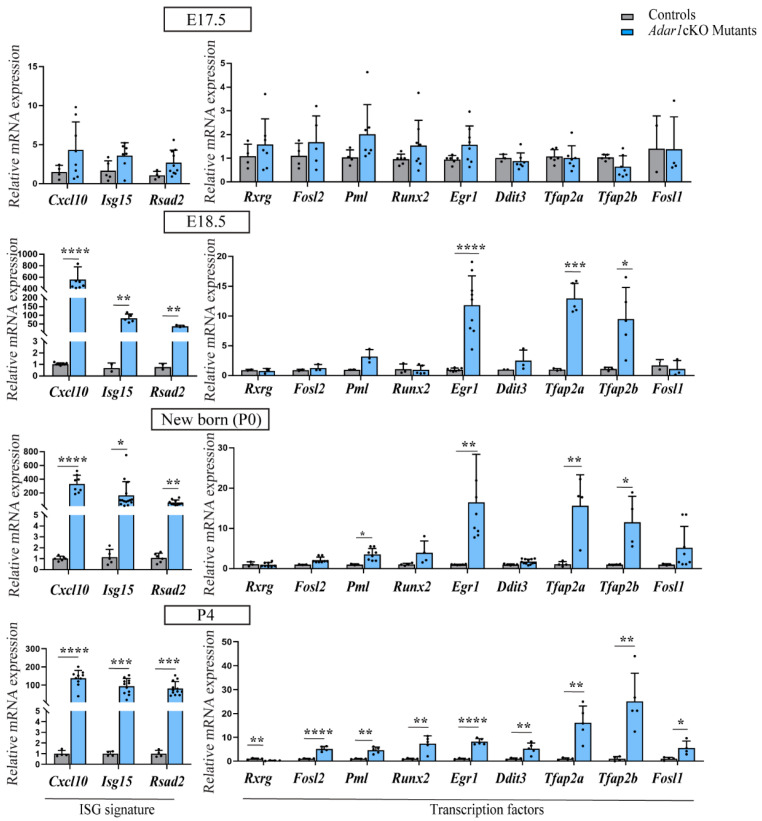
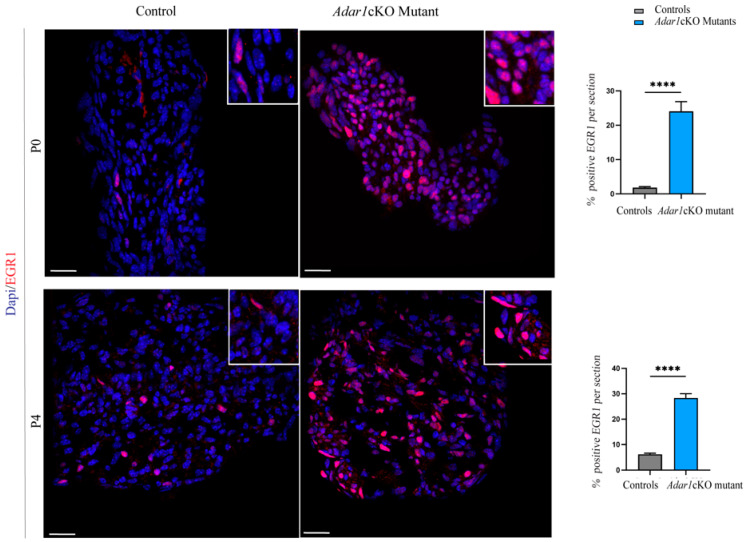
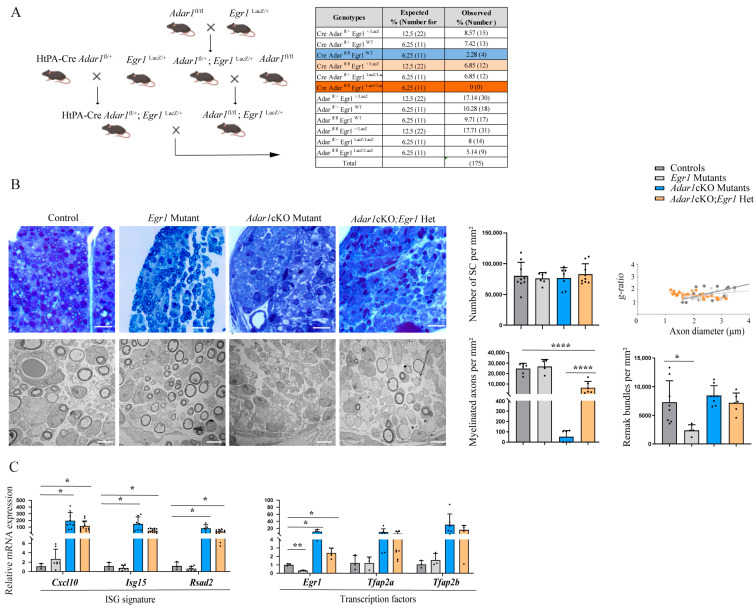
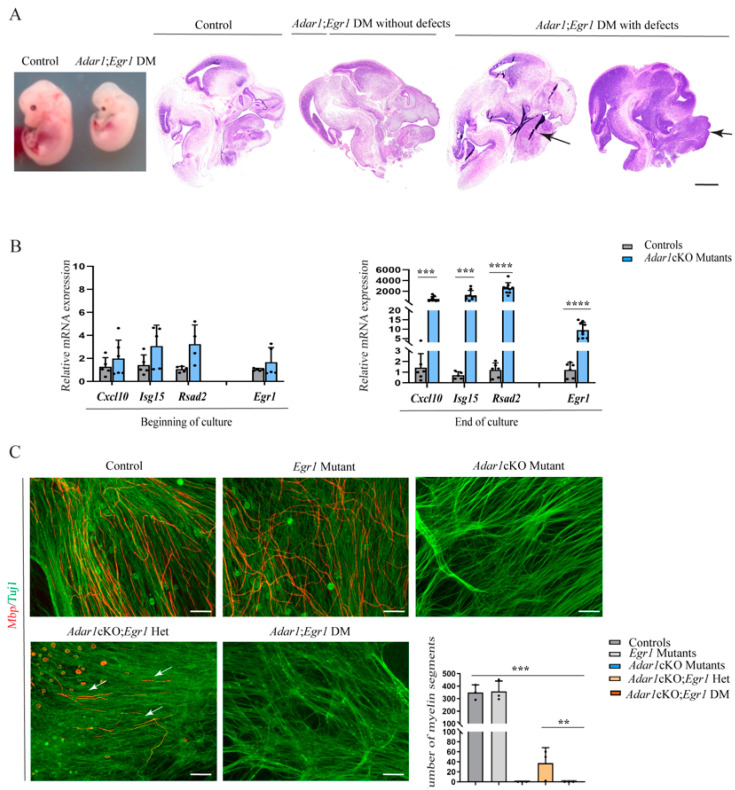
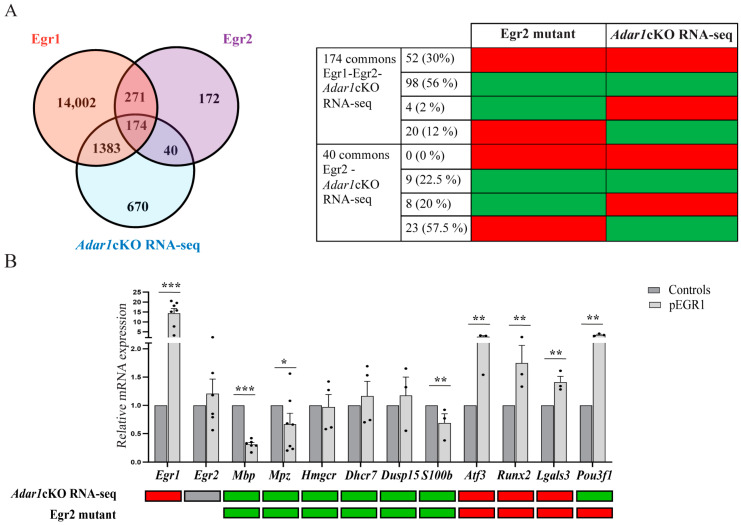
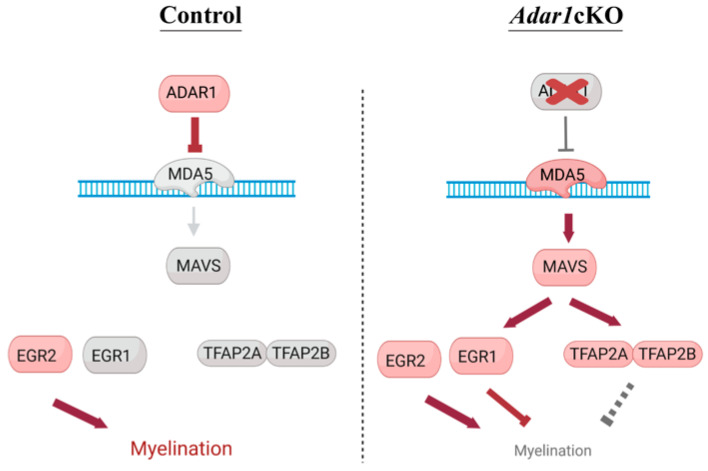
Adenosine deaminase acting on RNA 1 (ADAR1) is the principal enzyme for the adenosine-to-inosine RNA editing that prevents the aberrant activation of cytosolic nucleic acid sensors by endogenous double stranded RNAs and the activation of interferon-stimulated genes. In mice, the conditional neural crest deletion of Adar1 reduces the survival of melanocytes and alters the differentiation of Schwann cells that fail to myelinate nerve fibers in the peripheral nervous system. These myelination defects are partially rescued upon the concomitant removal of the Mda5 antiviral dsRNA sensor in vitro, suggesting implication of the Mda5/Mavs pathway and downstream effectors in the genesis of Adar1 mutant phenotypes. By analyzing RNA-Seq data from the sciatic nerves of mouse pups after conditional neural crest deletion of Adar1 (Adar1cKO), we here identified the transcription factors deregulated in Adar1cKO mutants compared to the controls. Through Adar1;Mavs and Adar1cKO;Egr1 double-mutant mouse rescue analyses, we then highlighted that the aberrant activation of the Mavs adapter protein and overexpression of the early growth response 1 (EGR1) transcription factor contribute to the Adar1 deletion associated defects in Schwann cell development in vivo. In silico and in vitro gene regulation studies additionally suggested that EGR1 might mediate this inhibitory effect through the aberrant regulation of EGR2-regulated myelin genes. We thus demonstrate the role of the Mda5/Mavs pathway, but also that of the Schwann cell transcription factors in Adar1-associated peripheral myelination defects.

Keywords: ADAR1; EGR1; MAVS; Schwann cells; differentiation; neural crest.


Conflict of interest statement

The authors declare no conflicts of interest.

Figures

Figure 1
Figure 1
Transcriptional regulator transcripts deregulated in the sciatic nerves of Adar1cKO versus the controls. Transcriptomic analysis identified 52 transcriptional regulators deregulated in the sciatic nerves of HtPA-Cre; Adar1fl/fl (Adar1cKO) mutants relative to the controls with fold change (FC ≥ 5). Heatmap representations of differentially-expressed transcriptional regulators [found in association with the GO terms mentioned in the text and deregulated more than fivefold in Adar1cKO mutants (n = 7) relative to the controls (n = 7) in RNA-Seq 1 and RNA-Seq 2 datasets]. The name of each gene is indicated on the right, with whether it belongs to the Interferome database, or involved in the Schwann cell repair process (see Table S3 for PMIDs). Genes found in the literature using the “neural crest” or “Schwann cells” keywords are also indicated. Colors reflect the z-score. Deregulated transcripts indicated in red (including dots) were the ones selected for further experimental validation.
Figure 2
Figure 2
Timing of the expression of candidate transcription factors in the sciatic nerves of Adar1cKO versus the controls. Analysis of the expression of Rxrg, Fosl2, Pml, Runx2, Egr1, Ddit3, Tfap2a, Tfap2b, Fosl1, and Interferon stimulated genes (ISG signature composed of Cxcl10, Isg15, Rsad2) in the sciatic nerves of the controls (grey) and HtPA-Cre; Adar1fl/fl (Adar1cKO) mutants (blue) at embryonic day E17.5 and E18.5, newborn (P0), and post-natal day 4 (P4) by RT-qPCR. All data represent the mean ± SD. Statistical differences between the groups (n = 3 to 12 controls and n = 3 to 11 mutants) were determined using the t-test (asterisks represent p values: * p ≤ 0.05, ** p < 0.01, *** p < 0.001, **** p < 0.0001).
Figure 3
Figure 3
Upregulation of the EGR1 protein in the sciatic nerves of Adar1cKO compared to the controls. EGR1 (red) immunostaining was performed on sections of sciatic nerves of Adar1cKO and the control mice at P0 and P4. Counter staining with DAPI is shown to identify the nuclei. Scale bar: 60 µm. Quantification was performed by counting the percentage of EGR1 positive nuclei over the total number of DAPI positive cells per section of 9 to 12 sections per genotype. Statistical differences between the groups were determined using the t-test (asterisks represent p values: **** p < 0.0001).
Figure 4
Figure 4
Axon myelination and normalized expression of Egr1, Tfap2a, and Tfap2b in the sciatic nerves of Adar1;Mavs DM versus the controls. Electron micrographs of transverse sections of sciatic nerves from AdarΔ2−13/Δ2−13;Mavs−/− double mutant (Adar1;Mavs DM) mice at P1 (A) and P14 (B), showing the presence of myelin in double mutants compared to the controls (AdarΔ2−13/+; Mavs −/−, or Adar1+/+; Mavs−/−). Quantifications, presented as the mean ± SD, were performed on at least 5 EM images (means presented) from n = 3 controls and n = 3 mutants at each stage to count the Schwann cell number, myelinated axon number, Remak bundles per square millimeter, and g-ratio in the controls (grey) and Adar1;Mavs DM (green), as described in [40]. Statistical differences between the groups were determined using the t-test. Scale bar: 5 µm. The lower halves of panels (A,B) show the expression of the ISG (ISG signature composed of Cxcl10, Isg15, Rsad2) of transcripts encoding myelination proteins (Pmp22, Mbp, and Mpz), and of Egr1, Tfap2a, and Tfap2b in the sciatic nerves of the controls (grey) and Adar1;Mavs DM (green) at indicated stages. Statistical analyses were made between the groups (n = 4 controls and n = 7 DM at P1 and n = 3 controls and n = 3 DM at P14). Statistical differences between the groups were determined using the t-test.
Figure 5
Figure 5
Deletion of one copy of Egr1 rescues Adar1cKO myelination defects in vivo. (A) Breeding strategy used to generate HtPA-Cre; Adar1fl/fl; Egr1LacZ/LacZ (Adar1cKO;Egr1 DM), HtPA-Cre; Adar1fl/fl; Egr1LacZ/+ (Adar1cKO;Egr1Het), single mutants, and the controls. The percentage (%) and expected number of animals of each genotype versus those collected between P1 and P14 are presented in the table. Comparison to the expected number was performed using the chi-square test to measure the significance of the deviation from Mendelian expectations (and to estimate the percentage survival of each genotype). This test revealed that the two sets of data, the observed and expected values, were different p = 0.00006711. (B) Semi-thin and electron micrographs of transverse sections of sciatic nerves from the controls (grey), Egr1 (light grey) and Adar1cKO (blue) single mutants, and HtPA-Cre; Adar1fl/fl; Egr1LacZ/+ (Adar1cKO;Egr1Het, orange) at P4. Quantification was performed by counting the number of Schwann cells, myelinated axons, and Remak bundles per square millimeter on two to six pictures of n = 3 animals per group and the g-ratio as described in [40]. Statistical differences between the groups were determined using the t-test (Asterisks represent p values: * p ≤ 0.05, **** p < 0.0001). Scale bar: 5 µm (EM) and 0.7 µm (semi-thin). (C) RT-qPCR, represented as the mean  ±  SD, were performed to quantify (i) Cxcl10, Isg15 and Rsad2, (ii) Egr1, Tfap2a, andTfap2b in the sciatic nerves of the controls (grey), Egr1 single mutants (light grey), Adar1cKO (blue), and HtPA-Cre; Adar1fl/f;Egr1LacZ/+ (Adar1cKO;Egr1Het, orange) relative to the controls. Note the partial myelin rescue in Adar1cKO;Egr1Het compared to Adar1cKO despite ISG signature activation and Tfap2a and Tfap2b overexpression. Statistical differences between the groups were determined using the t-test (asterisks represent p values: * p ≤ 0.05, ** p < 0.01).
Figure 6
Figure 6
Craniofacial alterations and myelin defects in Adar1cKO;Egr1 DM E13.5 embryos. (A) photo of whole E13.5 Adar1cKO;Egr1 DM embryos versus sibling controls, and sagittal sections of E13.5 Adar1cKO;Egr1 DM embryos and controls stained with H&E showing examples of craniofacial alterations observed in 5 out of the 15 Adar1cKO;Egr1 DM (macroglossia and syngnatia are indicated with black arrows). Scale bar: 1 mm. (B) Relative expression of Egr1 and three ISG in the mRNA extracted from primary cultures of mixed neurons and Schwann cells from dorsal root ganglia (DRG) of the controls (grey) and Adar1cKO E13.5 embryos (blue) at the start and end of the culture. Statistical differences between the groups (n = 3 to 8) were determined using the t-test (asterisks represent p values: *** p  <  0.001, **** p  <  0.0001). (C) End-stage mixed embryonic DRG cultures established from the controls, Egr1 or Adar1cKO single mutants, Adar1cKO;Egr1Het and Adar1cKO;Egr1 DM embryos immunostained with Mbp and Tuj1 markers to visualize myelin segments (red) along sensory axons (green) at the end of the culture. Scale bar: 24 µm. Graph shows the quantification of the number of myelin segments per axons per well in n = 3 cultures established from the embryos of the indicated genotypes. Statistical differences between the groups were determined using the t-test (asterisks represent p values: ** p < 0.01 and *** p < 0.001).
Figure 7
Figure 7
Overexpression of EGR1 disturbs the expression of several EGR2 regulated genes. (A) Venn diagram showing the overlap between genes misregulated in the RNA-Seq data generated in this study (Adar1cKO RNA-Seq), in EGR2-ChIP-Seq data on sciatic nerves [52], and in EGR1-ChIP-Seq performed in various cell lines [55]. The number of genes overlapping between each dataset are indicated. Table on the right indicates the number and % of genes upregulated (red) or downregulated (green) in the Egr2 hypomorphic mutants or in Adar1cKO mutants among the 174 genes and 40 genes overlapping between EGR1/EGR2 ChIP-Seq/Adar1cKO RNA-Seq or EGR2/Adar1cKO datasets, respectively. (B) RT-qPCR validation of 10 of the overlapping and differentially-regulated genes on RNA extracted from mouse Schwann cells non-transfected or transfected with the EGR1 overexpression plasmid. Relative expression levels in non-transfected (grey) and transfected (light grey) are presented as the mean  ± SEM Statistical differences between the groups (n = 3 to 7) were determined using the t-test (asterisks represent p values: * p ≤ 0.05, ** p < 0.01, *** p < 0.001. For comparison, up (red) and down (green) expression of selected transcripts in the Adar1cKO RNA-Seq and EGR2 mutant datasets are presented below.
Figure 8
Figure 8
Model summarizing the proposed effect of Adar1 deletion, leading to increased expression of the transcription factor. In normal Schwann cells, ADAR1 edits dsRNAs, preventing their recognition by the MDA5 sensor. Upon NC-specific Adar1 deletion, activation of the MDA5/MAVS pathway leads to aberrant overexpression/re-expression of Egr1, Tfap2a, and Tfap2b, which are repressors of the myelination process; EGR1 competes with EGR2 to control the myelination process. Red: activated and grey: not activated.

References

    1. Heraud-Farlow J.E., Walkley C.R. What do editors do? Understanding the physiological functions of A-to-I RNA editing by adenosine deaminase acting on RNAs. Open Biol. 2020;10:200085. doi: 10.1098/rsob.200085. - DOI - PMC - PubMed
    1. Quin J., Sedmik J., Vukic D., Khan A., Keegan L.P., O’Connell M.A. ADAR RNA Modifications, the Epitranscriptome and Innate Immunity. Trends Biochem. Sci. 2021;46:758–771. doi: 10.1016/j.tibs.2021.02.002. - DOI - PubMed
    1. Tassinari V., Cerboni C., Soriani A. Self or Non-Self? It Is also a Matter of RNA Recognition and Editing by ADAR1. Biology. 2022;11:568. doi: 10.3390/biology11040568. - DOI - PMC - PubMed
    1. Walkley C.R., Li J.B. Rewriting the transcriptome: Adenosine-to-inosine RNA editing by ADARs. Genome Biol. 2017;18:205. doi: 10.1186/s13059-017-1347-3. - DOI - PMC - PubMed
    1. Hayashi M., Suzuki T. Dyschromatosis symmetrica hereditaria. J. Dermatol. 2013;40:336–343. doi: 10.1111/j.1346-8138.2012.01661.x. - DOI - PubMed

Publication types

MeSH terms

Associated data

LinkOut - more resources