

Targeted Deletion in the Basal Body Protein Talpid3 Leads to Loss of Primary Cilia in Embryonic Stem Cells and Defective Lineage-Specific Differentiation
- PMID: 39682705
- PMCID: PMC11639927
- DOI: 10.3390/cells13231957
Targeted Deletion in the Basal Body Protein Talpid3 Leads to Loss of Primary Cilia in Embryonic Stem Cells and Defective Lineage-Specific Differentiation
Abstract
Talpid3 is a basal body protein required for the formation of primary cilia, an organelle involved in signal transduction. Here, we asked if Talpid3 has a role in the regulation of differentiation and/or self-renewal of ES cells and whether cells lacking cilia due to a deletion in Talpid3 can be reprogrammed to induced pluripotent stem (iPS) cells. We show that mouse embryonic limb fibroblasts which lack primary cilia with a targeted deletion in the Talpid3 (Ta3) gene can be efficiently reprogrammed to iPS cells. Furthermore, vector-free Ta3-/- iPS cells retain ES cell features and are able to self-renew. However, both Ta3-/- iPS and ES cells are unable to form visceral endoderm and differentiate poorly into neurons. The observed defects are not a consequence of reprogramming since Ta3-/- ES cells also exhibit this phenotype. Thus, Talpid3 and primary cilia are required for some differentiation events but appear to be dispensable for stem cell self-renewal and reprogramming.
Keywords: differentiation; extraembryonic membranes; mouse ES cells; primary cilia; talpid 3.
Conflict of interest statement
The authors declare no competing interests.
Figures
 ), R1 (
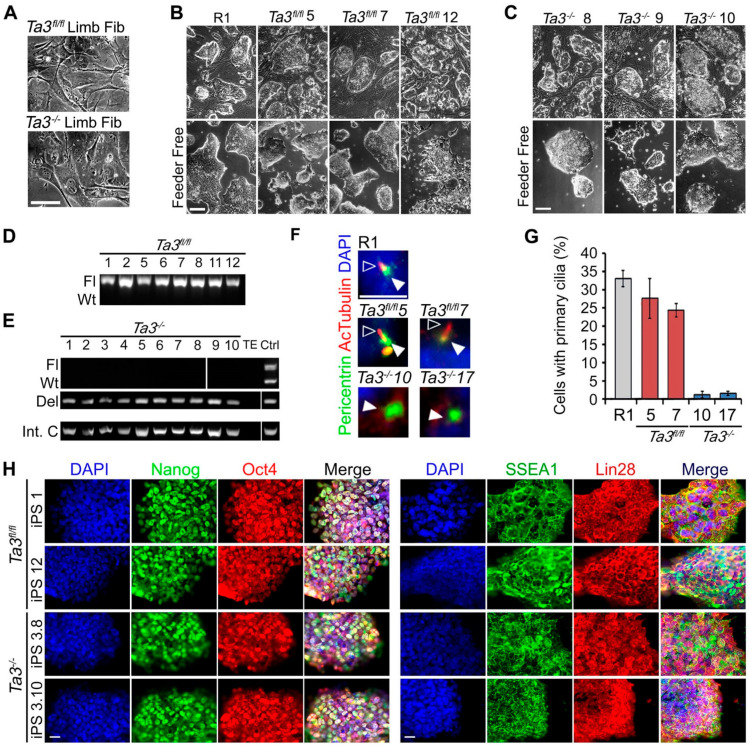
 ), Ta3−/− cells (
 ). Error bars ± SEM, n ≥ 350 cells from three independent experiments. (H) Expression of pluripotency markers Nanog, Oct4, SSEA1 and Lin28 in Ta3fl/fl and Ta3−/− iPS cells. Scale bar: 25 µm.
 ), Ta3fl/fl iPS X12 and X22 (), Ta3fl/fl ES 9 (
 ), Ta3−/− iPS X10 and X17 (), and Ta3−/− ES 6 (
 ). (E) Expression of the limb markers HoxD13 and Meis1 in ES and iPS cell lines and in E12.5 mouse limb (Lb,
  ).
). ), Ta3−/− ES cells (), R1 (), Ta3fl/fl iPS (), Ta3fl/fl ES cells (). (Error bars ±SEM, three independent experiments, ≥350 cells per experiment, * p < 0.05, one-way ANOVA with Tukey’s post-hoc). (D) Primary cilia in R1, transgene-free Ta3fl/fl X12 or X22 and Ta3−/− X10 and X17. ES cells immunostained for pericentriolar material 1 (Pcm1, hollow arrows) and acetylated tubulin (white arrows). Scale bar: 10 µm. (E) The mean area of pericentriolar material protein Pcm1 in immunostained images. Pcm1 areas in Ta3−/− iPS (), Ta3−/− ES cells (), R1 (), Ta3fl/fl iPS (), Ta3fl/fl ES cells (). (Error bars ±SEM, three independent experiments, ≥350 cells per experiment, * p < 0.05, data were compared by one-way ANOVA with Tukey’s post-hoc). Scale bar: 10 µm.

 ), Ta3fl/fl ES 9(
 ), Ta3fl/fl iPS X12 (
 ), Ta3fl/fl iPS X22 (
 ), Ta3−/− ES 6 (
 ), Ta3−/− iPS X10 (
 ) and Ta3−/− iPS 17 (
 ). n = 3. Error bars ± SEM. qPCRs were performed in triplicate for each time point. Data from 3 independent experiments.

References
Publication types
MeSH terms
Grants and funding
LinkOut - more resources
Full Text Sources
Molecular Biology Databases
