. 2024 Nov 27;13(23):1964.
doi: 10.3390/cells13231964.

JRM-28, a Novel HDAC2 Inhibitor, Upregulates Plasticity-Associated Proteins in Hippocampal Neurons and Enhances Morphological Plasticity via Activation of CREB: Implications for Alzheimer's Disease

Affiliations

JRM-28, a Novel HDAC2 Inhibitor, Upregulates Plasticity-Associated Proteins in Hippocampal Neurons and Enhances Morphological Plasticity via Activation of CREB: Implications for Alzheimer's Disease

A F M Towheedur Rahman et al. Cells. .

Abstract

Enhancement of neuronal plasticity by small-molecule therapeutics protects cognitive skills and also ameliorates progressive neurodegenerative pathologies like Alzheimer's disease (AD) and dementia. One such compound, a novel histone deacetylase 2 (HDAC2) inhibitor named JRM-28, was shown here to enhance dendritic strength, augment spine density, and upregulate post-synaptic neurotransmission in hippocampal neurons. The molecular basis for this effect correlates with JRM-28-induced upregulation of the transcription of cAMP response element-binding protein(CREB), induction of its transcriptional activity, and subsequent stimulation of expressions of CREB-dependent plasticity-associated genes, such as those encoding N-methyl-D-aspartate (NMDA) receptor subunit NR2A and the α-amino-3-hydroxy-5-methyl-4-isoxazolepropionic acid (AMPA) receptor subunit GluR1. Specifically, JRM-28 stimulated the NMDA- and AMPA-receptor-sensitive ionotropic calcium influx in hippocampal neurons. Interestingly, JRM-28 did not induce NMDA- and AMPA-sensitive calcium influx in hippocampal neurons once the expression of CREB was knocked down by creb siRNA, suggesting the critical role of CREB in JRM-28-mediated upregulation of synaptic plasticity. Finally, JRM-28 upregulated CREB mRNA, CREB-dependent plasticity-associated markers, and ionotropic calcium influx in iPSC-derived AD human neurons, indicating its therapeutic implications in the amelioration of AD pathologies.

Keywords: AMPA-sensitive glutamate receptor 1; HDAC inhibitor; Histone deacetylase 2; NMDA receptor subunit 2A; benzene; cAMP responsive element binding protein 2; dichloromethane; immunoblot; immunofluorescence; iodine; lithium diisopropylamide; meta-chloroperoxybenzoic acid; methanol; sodium acetate; tetrahydrofuran; triethyl amine.


Conflict of interest statement

S.B., C.G.G. and A.R. are employees of Simmaron Research Institute, other authors declare no conflict of interest.

Figures
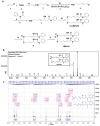
Figure 1
Figure 1
Synthesis and characterization of JRM-28. (A) A schema for JRM-28 synthesis. Reagents and conditions: (a) Et3N, CH2Cl2, r.t., 3 h; (b) 2-(triphenylphosphoranylidene) acetaldehyde, C6H6, reflux, 12 h; (c) LDA, THF, −78 °C; (d) I2, NaOAc, CH2Cl2: MeOH (10:1), 0 °C to r.t., 3 h; (e) mCPBA, CH2Cl2, reflux 40 °C, 12 h; (f) mCPBA, CH2Cl2, r.t. to 40 °C, reflux, 2 h; (B) Mass spectra of JRM-28 in positive ion mode with the base peak at 561 (C28H36 N2O6S2+H+) and (C) 1H-NMR of JRM-28 with peak assignment confirm the successful synthesis of the proposed compound (details discussed in Supplementary Methods section). A chemical shift value was recorded for each equivalent proton (marked with alphabet from A to M) and shown as ppm unit within enclosures in the NMR spectra. (Acronyms: Et3N = triethyl amine, CH2Cl2 = dichloromethane, C6H6 = benzene, LDA = lithium di-isopropylamide, THF = tetrahydrofuran, I2 = iodine, NaOAc = sodium acetate, MeOH = methanol, mCPBA = meta-chloroperoxybenzoic acid).
Figure 2
Figure 2
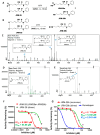
HDAC2 inhibitory role of JRM-28 and its monomers JRM-28a and b. Schematic presentations of the reduction of JRM-28 to JRM-28a and JRM-28b (A) and the reduction of JRM-20 to JRM-28b (B) by DTT. Before the HDAC2 inhibition assay, a 10 mM solution of both JRM-28 and its precursor, JRM-20, in DMSO was reduced by 350 mM aqueous DTT solution. The mass spectrum of the sample containing JRM-28 and DTT confirms the existence of JRM-28a (trace), JRM-20 (trace), and JRM-28 (predominant, base peak at 561) in positive ion mode, (C) whereas the negative ion mode predominantly confirmed the generation of JRM-28a (D). The mass spectrum for JRM-20 with DDT displayed the base peak at 266 for JRM-28b (E). Luminescence assay for purified recombinant HDAC2 inhibition by JRM-28 (F) and JRM-20 (G) with and without DTT. HDAC2 assays were performed in triplicate, and the averages were plotted on the non-linear regression graph of the concentration-response equation using GraphPad Prism 8 software. In this assay, aminoluciferin and luciferase were coupled to deacetylase activity such that luminescence (arbitrary units, au) linearly reflected the rate of deacetylation. HDAC2 concentration (0.5 nM) and the dose of inhibitors were consistent in each reaction.
Figure 3
Figure 3
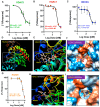
JRM-28 is an HDAC2 inhibitor. Fluorimetric inhibition analyses (Ex/Em = 480/528 nm) with purified (A) HDAC2, (B) HDAC1, and (C) HDAC3 were performed in the presence of increasing doses of JRM-28 (reduced with DTT). Respective IC50 and Hill slope were calculated from a non-linear inhibition curve derived from GraphPad Prism 9 software. Hill coefficients were found to be unstable in HDAC1 and HDAC3 binding curves with high IC50. The fluorescence value was normalized with DMSO control and then DTT control. (D) In silico binding assay displayed a low-resolution docking pose of JRM-28 with HDAC2. The PDB structure of rigid body docking analyses between HDAC2 and JRM-28a was visualized in Chimera 1.14 (UCSF) software. (E) The high-resolution image showed amino acid residues within an 11 Å distance of JRM-28a in a catalytic binding pocket. (F) The electrostatic potential surface displayed the charge distribution of HDAC2 protein around JRM-28a. Blue = positive charge, white = neutral, and red = negative charge. (G) HDAC6 inhibition assay was performed with increasing doses of JRM-28 (reduced) based on a fluorometric strategy (Ex/Em = 480/528 nm) followed by plotting the non-linear binding curve in GraphPad Prism 9 software. (H) In silico docking pose of JRM-28a with HDAC4 was visualized as a ribbon structure in UCSF Chimera 1.14 software. (I) Electrostatic potential surface display summarizing the charge distribution of HDAC4 around JRM-28a in its catalytic binding pocket.
Figure 4
Figure 4
Exploring the cytotoxicity of JRM-28. SHSY5Y neurons were treated with different doses of JRM-28 for 24 h and then analyzed for different cytotoxicity assays. (A) Representative images are duplicate analyses of TUNEL staining in SHSY5Y neurons with increasing doses of JRM-28. TUNEL+ve cells were detected as condensed brown bodies, whereas nuclei were stained with hematoxylin (blue). (B) TUNEL bodies were counted per 10 randomly selected cells in 20 different images. Results were plotted as a dotted boxplot, and the significance of the mean was analyzed by one-way ANOVA (single effector = treatment). **** p < 0.00001 versus DMSO control. (C) LDH (lactate dehydrogenase) release assay was performed in the supernatants after 24 h of treatment with increasing doses of JRM-28. One-way ANOVA resulted in ** p < 0.01 and *** p < 0.001 versus control. (D) Immunoblot (IB) analysis of HDAC2 in the total cell lysate of SHSY5Y cells treated with increasing doses of JRM-28 for 24 h. IB assay of β-actin was performed as a housekeeping protein (Supplementary Figure S18 for raw blot). (E) The band density of individual HDAC2 bands was assessed in ImageJ software (version 1.45) followed by normalization with respective β-actin band density. The relative densitometry was plotted by a bar diagram. (F) Immunofluorescence (IF) analysis of HDAC2 in SHSY5Y cells treated with DMSO (i) and 5 μM JRM-28 (iii). Nuclei were stained with DAPI. (ii) Cells with nuclear and (iv) cytosolic HDAC2 were counted in 10 independent images for both control and JRM-treated groups followed by scatter histogram analyses in percent scale. Unpaired t-test (**** p < 0.0001) was performed to measure the significance of means between groups. (G) Endogenous HDCA2 inhibition assay in the cell lysate of SHSY5Y cells treated with increasing doses of JRM-28. The assay was performed at a different time after the treatment with JRM-28. (H) Dose-dependent endogenous HDAC2 inhibition assay in SHSY5Y cells with increasing doses of JRM-28. A characteristic sigmoidal non-linear inhibitor binding curve was drawn in GraphPad Prism 9 software followed by measuring IC50 and Hill slope. Results are confirmed after three different experiments.
Figure 5
Figure 5
JRM-28 induces structural plasticity in neurons. SHSY5Y neurons and E18 mouse primary hippocampal neurons were grown in complete neurobasal media, treated with different doses of JRM-28 for 24 h, and then analyzed for dendritic morphogenesis by a different immunoassay. (A) After 24 h of seeding, JRM-28 was treated for an additional 24 h. After that, the immunofluorescence (IF) assay of dendritic marker MAP2 (green) was performed as described in the Methods section. Nuclei were stained with DAPI (blue). (B) The dendritic length was measured in 200 randomly selected neurons per group in ImageJ software. Briefly, scale bar calibration was performed after converting pixels to micrometer scale, followed by measuring dendritic length with the line tool. Two-tailed unpaired t-test was performed to test the significance of the means between groups, resulting in *** p < 0.0001 (t = 18.26; df = 398). (C) Immunoblot analysis of MAP2 (top) and beta-actin (bottom) in SHSY5Y cells treated with 2, 5, and 10 μM doses of JRM-28. (Supplementary Figure S18 for raw blot). (D) The band intensity was measured in ImageJ software and then normalized with the respective band density of beta-actin. Unpaired t-test resulted in *** p < 0.0001 vs. control, and ns = no significance. (E) E18 mouse primary neurons were grown in complete neurobasal media for 7 days in vitro (DIV). After that, 5 μM JRM-28 was treated for 24 h, followed by IF analysis of MAP2 (Green). Nuclei were stained with DAPI. For spine analysis, E18 neurons were grown in 18 DIV. Alexa 640-tagged Phalloidin staining (Red) was performed together with MAP2 (Green) to visualize dendritic spines on the dendrites in (F) control and (G) 5 μM JRM-28-treated neurons. The image was captured in 100× objective after oil immersion, followed by visualizing in LSM Zeiss image browsing software (version 4.2.0.121) at 400× magnification. (H) Spine size was measured following the measurement of the ratio between the MFI of the spine head and the MFI of the spine shaft, as described in the adjacent image and method. Spines were considered to be mature if the ratio was ≥ 0.6. Unpaired t-test generated **** p < 0.0001 versus control. Results are confirmed with mean ± SD of three different experiments.
Figure 6
Figure 6
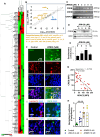
JRM-28 stimulates transcriptional activity of CREB via inhibition of HDAC2. SHSY5Y neurons were cultured, differentiated, and treated with different doses of JRM-28 for 24 h and then analyzed for PCR, immunoblot, dual IF, and firefly/renilla dual luciferase reporter assay. (A) A cDNA-based array for 88 CREB and CREB-dependent genes was performed in a commercially available array kit (RT2 Profiler PCR Array for human synaptic plasticity; Qiagen: Cat # PAHS-126-EZ). The Ct data were uploaded to Qiagen’s web analysis server. The result was summarized by (A) Heatmap and (B) scatter plot analyses. Thirty-eight genes, including CREB, were found to be upregulated. (C) Semi-quantitative RT-PCR analyses for CREB family of genes, including creb and crem. The 100 bp DNA ladder was run to identify the amplified products of these genes. The gapdh gene was included as the housekeeping gene (Supplementary Figure S18 for raw PCR gel). (D) Immunoblot analysis of CREB (top) and beta-actin (bottom) in SHSY5Y cells treated with increasing doses of JRM-28 (Supplementary Figure S18 for raw blot). (E) The band intensity was measured in ImageJ software and then normalized with the respective band density of beta-actin. * p < 0.05 (=0.0324), ** p < 0.01 (=0.0031), * p < 0.05 (=0.0477) vs. control. (F) Dual IF analysis of CREB (Green) and HDAC2 (Red) in control and 5 µM JRM-28-treated SHSY5Y cells. Nuclei were stained with DAPI. (Inset) Enclosed boxes magnified to estimate the relative distribution of CREB and HDAC2 for (i) cytosolic HDAC2 (CytHDAC2) and CREB as well as (ii) nuclear HDAC2 (NucHDAC2) and CREB. (G) A non-parametric Spearman correlation analysis in 40 randomly selected dual-stained cells with CREB and HDAC2 were considered for MFI calculations, followed by correlation statistics. The non-parametric correlation was considered once the dataset failed to pass the normality test. (H) The firefly cre luciferase assay was performed in 2, 5, and 10 µM JRM-28-treated SHSY5Y cells, normalized with renilla luciferase, and then offset with negative control. The normalized luciferase was plotted as a dotted histogram. One-way ANOVA demonstrated F3,20 = 9.731; **** p < 0.0005 (=0.0004). Results are confirmed with mean ± SD of three different experiments.
Figure 7
Figure 7
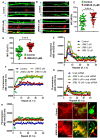
JRM-28 enhances post-synaptic calcium influx in E18 mouse primary hippocampal neurons. Mouse primary hippocampal neurons were generated from E18 fetal brains as described in the Methods section. After 18 days of differentiation, these neurons were treated with 5 µM of JRM-28 for 48 h and then analyzed for IF and calcium influx assay. The representative images demonstrate dual IF analyses of (A) MAP2 (green) plus NMDA receptor subunit NR2A (red); and (B) MAP2 (green) plus AMPA receptor subunit GluR1 (red). Nuclei were stained with DAPI (blue). (C) MFIs (mean fluorescence intensities) of NR2A and (D) GluR1 were calculated in ImageJ software in 50 different NR2A-ir and GluR1-ir receptors (as shown in red-colored dense bodies) per group and then plotted as dotted histograms. An unpaired t-test was adopted to test the significance of the means between groups, resulting in **** p < 0.0001 versus control (t = 5.334; df = 98) in NR2A analysis and **** p < 0.0001 versus control (t = 9.608; df = 98) for GluR1. (E) Ionotropic calcium assay was performed in hippocampal neurons with increasing doses of JRM-28. Recording started 0.1 s after the addition of 20 μM NMDA via a dual pump autoinjector, and the kinetic plot was recorded at Ex: Em 485:535 nm filter set at 0.1 s interval for 100 readings. The result was normalized with baseline and plotted as a linear scale. (F) AMPA-driven calcium influx assay in hippocampal neurons treated with 2, 5, and 10 μM of JRM-28. The recording was performed at a 0.1 s time interval for 100 repeats following the addition of 20 μM AMPA. (G) Hippocampal neurons were transfected with creb siRNA for 24 h, followed by treatment with different doses of JRM-28 for another 24 h. After that, an NMDA-sensitive calcium influx assay was performed. (H) AMPA-sensitive calcium entry assay was measured in creb siRNA-transfected hippocampal neurons after treatment with increasing doses of JRM-28. (I) Pre-synaptic protein synaptotagmin was dual labeled with NR2A. The enhanced interaction between these two proteins may represent augmented synaptic transmission. (a) In control cells, synaptotagmin-ir endocytic membrane fold (circular; green arrow) is found to be present near the post-synaptic NMDA receptor (red dot; NR2A; red arrow). (b) Synaptotagmin-ir endocytic membrane complex (green arrow) was found to be latched onto NR2A-ir (red arrow) NMDA receptor in JRM-28- (5 µM) treated neuron. Scale bar = 5 µm. Results are confirmed after three independent experiments.
Figure 8
Figure 8
The effect of JRM-28-mediated suppression of HDAC2 on the upregulation of CREB and MAP2 in AD neurons with A246E psen1 mutation. AD neurons were differentiated from iPSC-derived neural stem cells (NSCs) in a conditional neurobasal media as described in the Methods section. AD neurons were stimulated with 5 µM of JRM-28 for 48 h and then immunolabeled. (A) The representative image exhibits a dual IF analysis of CREB (green) and HDAC2 (red). Nuclei were stained with DAPI (blue). (B) A non-parametric Spearman correlation analysis of mean fluorescence intensities (MFIs) was performed between CREB and HDAC2. The resultant scatter plot displays a moderate negative correlation (* p < 0.05). A total of 30 random neurons were selected from 6 different images (3 images per group) in this analysis. MFI was calculated in ImageJ software, the raw values were recorded, and the derived dataset was analyzed for the normality test in GraphPad Prism 8 software. Spearman correlation analysis was decided once the dataset failed to pass the D’Agostino–Pearson normality test. (C) A representative dual IF image of MAP2 (green) and HDAC2 (red). Nuclei were labeled with DAPI (blue). (D) A parametric Pearson correlation statistic of MFIs between HDAC2 and MAP2 was performed after the normality test was successfully executed in GraphPad Prism 8 software. A total of 30 neurons from six independent images (three images/group) were selected in this analysis. Results are confirmed after three different experiments.
Figure 9
Figure 9
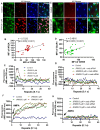
The effect of JRM-28-mediated activation of CREB on the upregulation of NR2A, GluR1, and induction of ionotropic calcium entry in AD neurons. AD neurons were differentiated from iPSC-derived neural stem cells (NSCs) as described under the Methods section, followed by treatment with 5 µM of JRM-28 for 48 h, and then analyzed for IF and calcium influx assay. (A) The representative image exhibits a dual IF analysis of NR2A (green) and CREB (red). Nuclei were stained with DAPI (blue). (B) A non-parametric Spearman correlation analysis of mean fluorescence intensities (MFIs) was performed between CREB and NR2A. The resultant scatter plot displays a strong positive correlation (*** p < 0.005). A total of 30 random neurons were selected from six different images (three images per group) in this analysis. MFI was calculated in ImageJ software, the raw values were recorded, and the derived dataset was analyzed for the normality test in GraphPad Prism 8 software. Spearman correlation analysis was decided once the dataset failed to pass the D’Agostino–Pearson normality test. MFI measurement was restricted to cell bodies only. (C) A representative dual IF image of GluR1 (green) and CREB (red). Nuclei were labeled with DAPI (blue). (D) A parametric Pearson correlation statistic of MFIs between CREB and GluR1 was performed after the normality test was successfully executed in GraphPad Prism 8 software. A total of 30 neurons from six independent images (three images/group) were selected in this analysis. Results are confirmed after three different experiments. (E) Ionotropic calcium assay was performed in AD neurons with increasing doses of JRM-28. Recording started 0.1 s after the addition of 20 μM NMDA via a dual pump autoinjector, and the kinetic plot was recorded at Ex: Em 485:535 nm filter set at 0.1 s interval for 100 readings. The result was normalized with baseline and plotted. * p < 0.05 and ** p < 0.01 versus maximum fluorescence value of control reading. (F) AMPA-driven calcium influx assay in AD neurons treated with 2, 5, and 10 μM of JRM-28. The recording was performed at a 0.1 sec time interval for 100 repeats following the addition of 20 μM AMPA. (G) AD neurons were transfected with the creb siRNA for 24 h, followed by treatment with different doses of JRM-28 for another 24 h. After that, an NMDA-sensitive calcium influx assay was performed. (H) AMPA-sensitive calcium entry assay was measured in creb siRNA-transfected AD neurons after the treatment with increasing doses of JRM-28. Results are confirmed after three independent experiments.

References

    1. Papa M., Segal M. Morphological plasticity in dendritic spines of cultured hippocampal neurons. Neuroscience. 1996;71:1005–1011. doi: 10.1016/0306-4522(95)00490-4. - DOI - PubMed
    1. Jan Y.-N., Jan L.Y. Branching out: Mechanisms of dendritic arborization. Nat. Rev. Neurosci. 2010;11:316–328. doi: 10.1038/nrn2836. - DOI - PMC - PubMed
    1. Borczyk M., Śliwińska M.A., Caly A., Bernas T., Radwanska K. Neuronal plasticity affects correlation between the size of dendritic spine and its postsynaptic density. Sci. Rep. 2019;9:1693. doi: 10.1038/s41598-018-38412-7. - DOI - PMC - PubMed
    1. Yuste R., Bonhoeffer T. Morphological changes in dendritic spines associated with long-term synaptic plasticity. Annu. Rev. Neurosci. 2001;24:1071–1089. doi: 10.1146/annurev.neuro.24.1.1071. - DOI - PubMed
    1. Walmsley B. Signalling at the synapse: Regulation of the post-synaptic response to quantal transmitter release. Immunol. Cell Biol. 1998;76:430–435. doi: 10.1046/j.1440-1711.1998.00764.x. - DOI - PubMed

Publication types

MeSH terms

Substances

LinkOut - more resources