. 2024 Nov 28;13(23):1970.
doi: 10.3390/cells13231970.

The Potential of a Novel Cold Atmospheric Plasma Jet as a Feasible Therapeutic Strategy for Gingivitis-A Cell-Based Study

Affiliations

The Potential of a Novel Cold Atmospheric Plasma Jet as a Feasible Therapeutic Strategy for Gingivitis-A Cell-Based Study

Andreea-Mariana Negrescu et al. Cells. .

Abstract

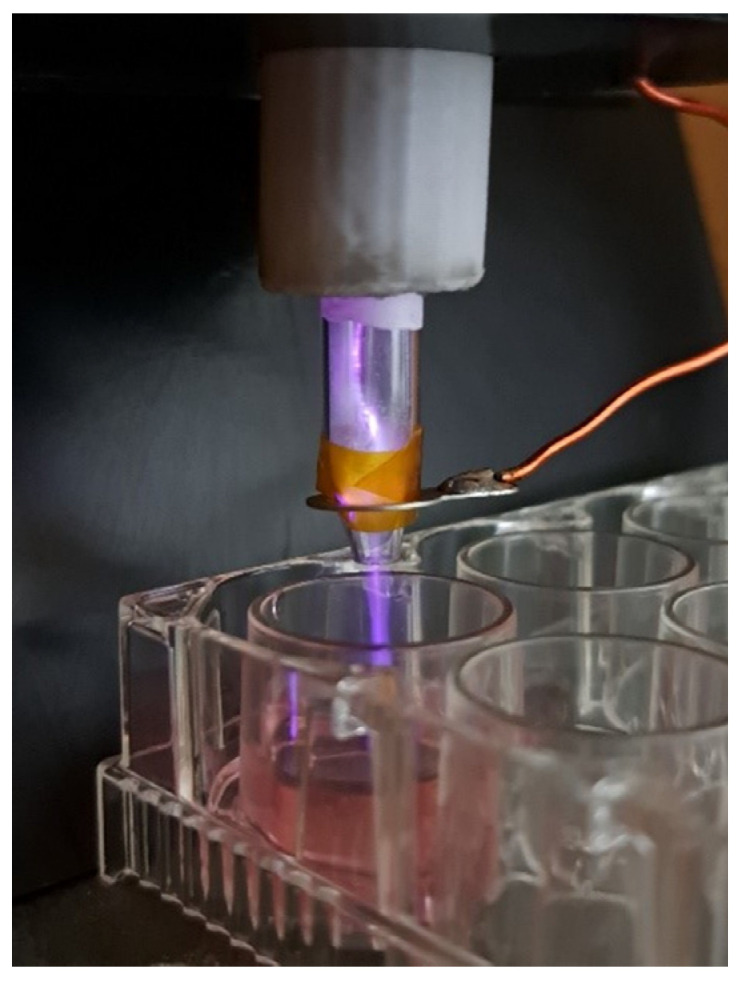
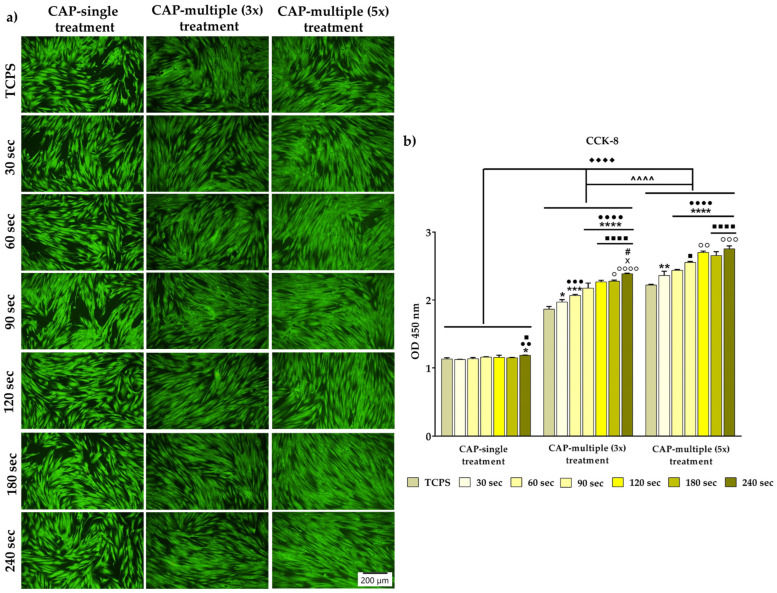
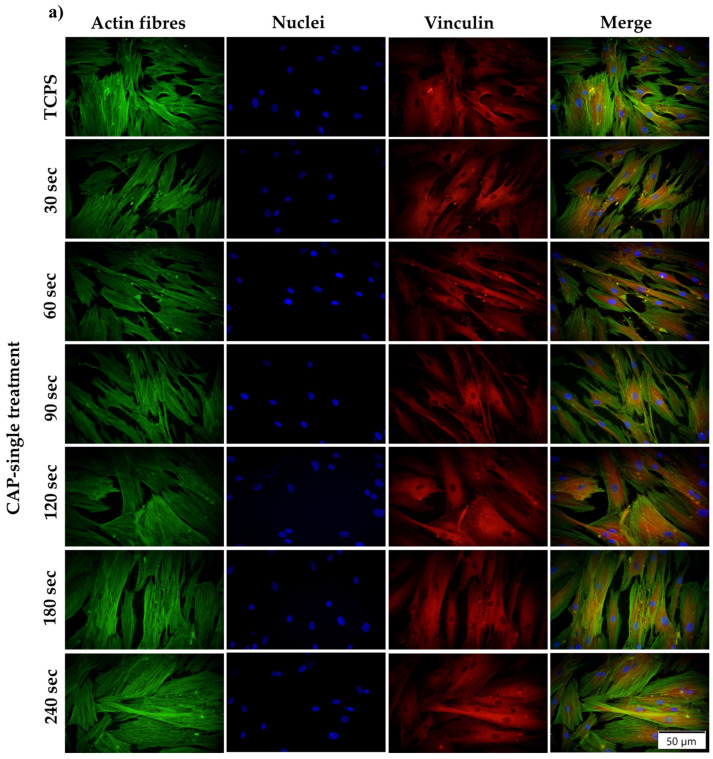
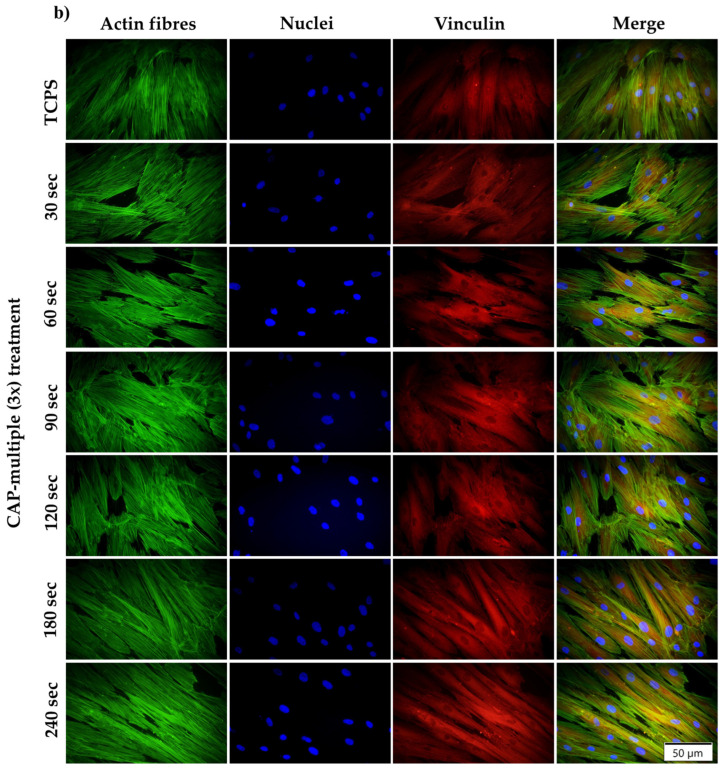
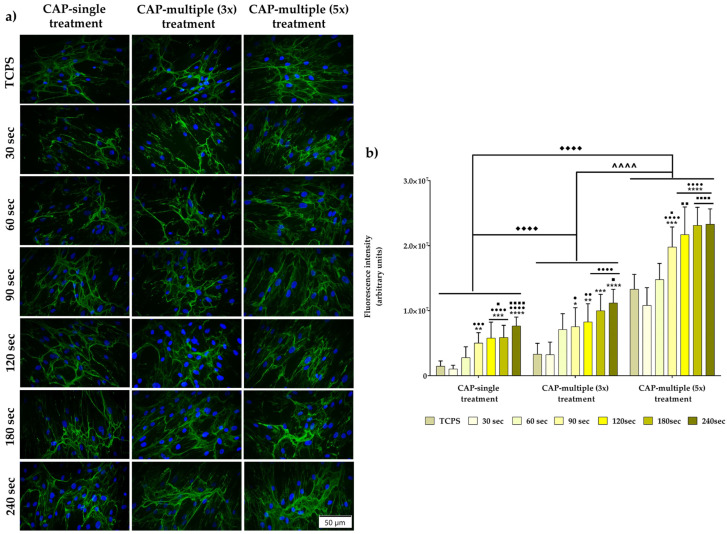
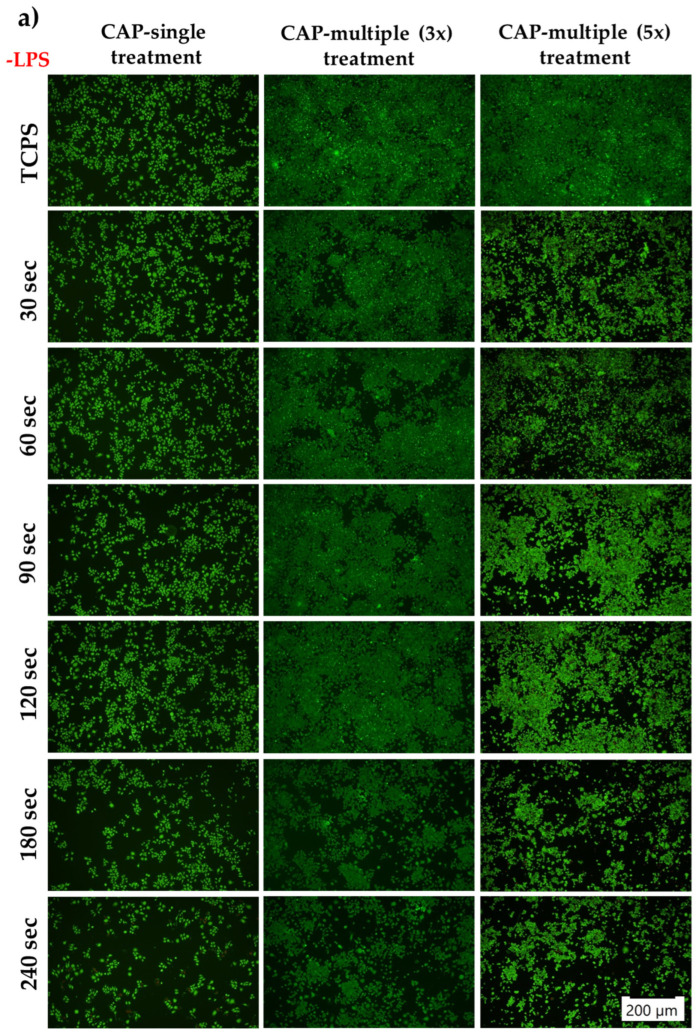
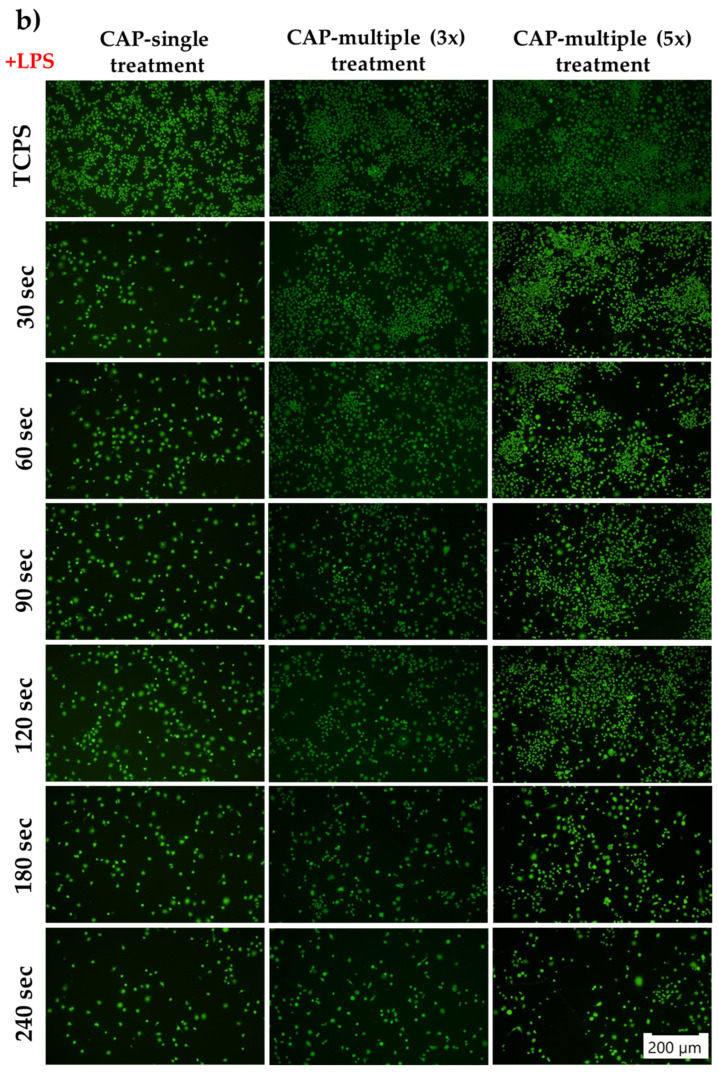
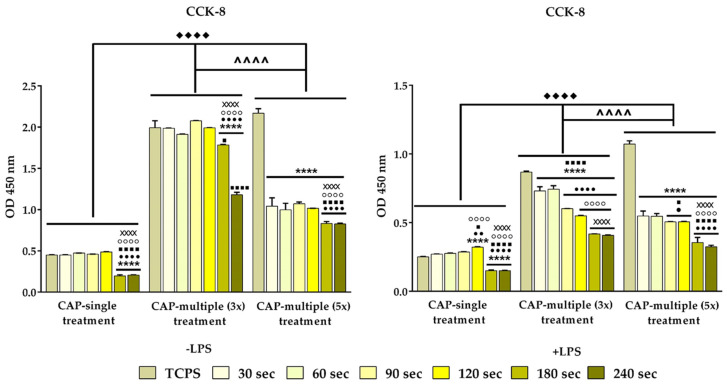
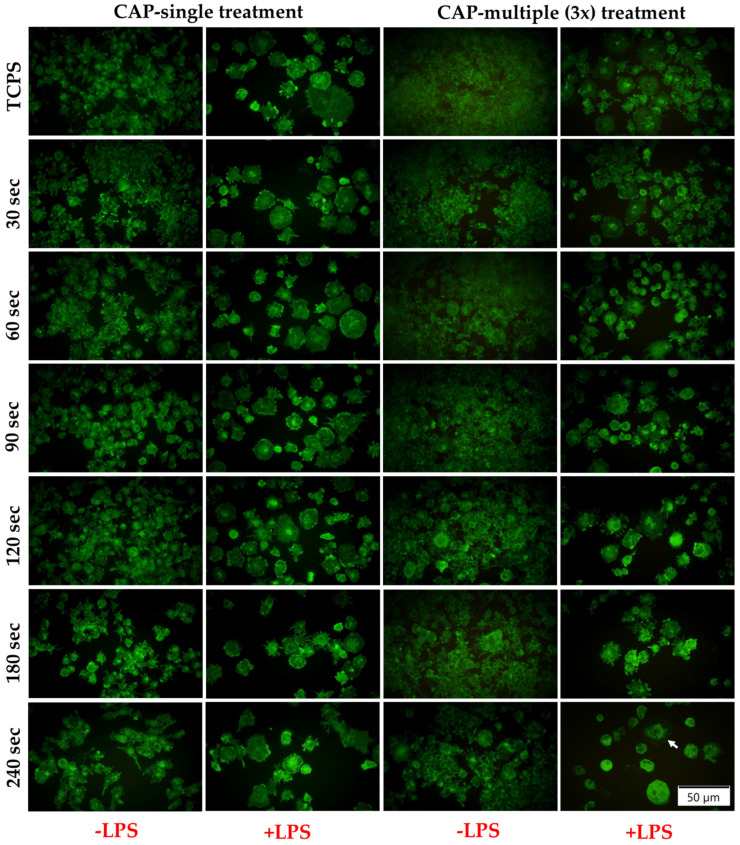
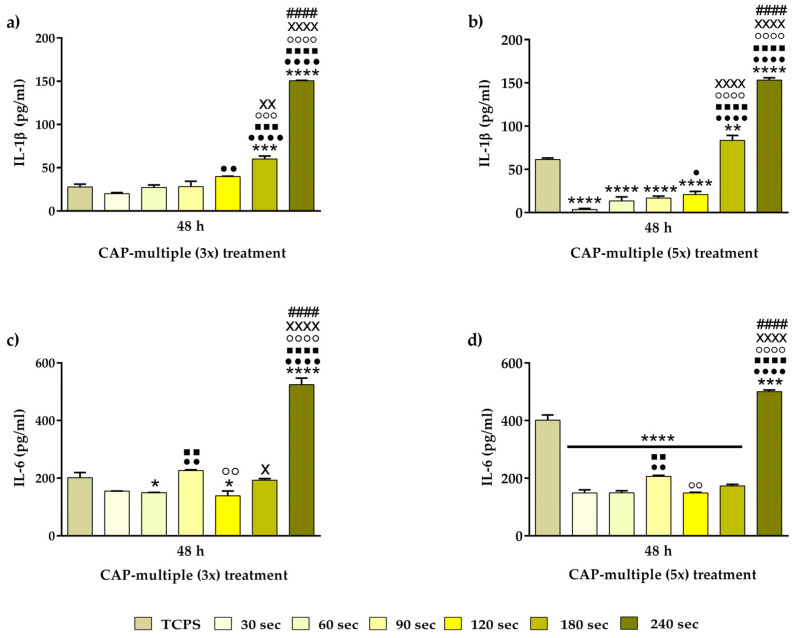
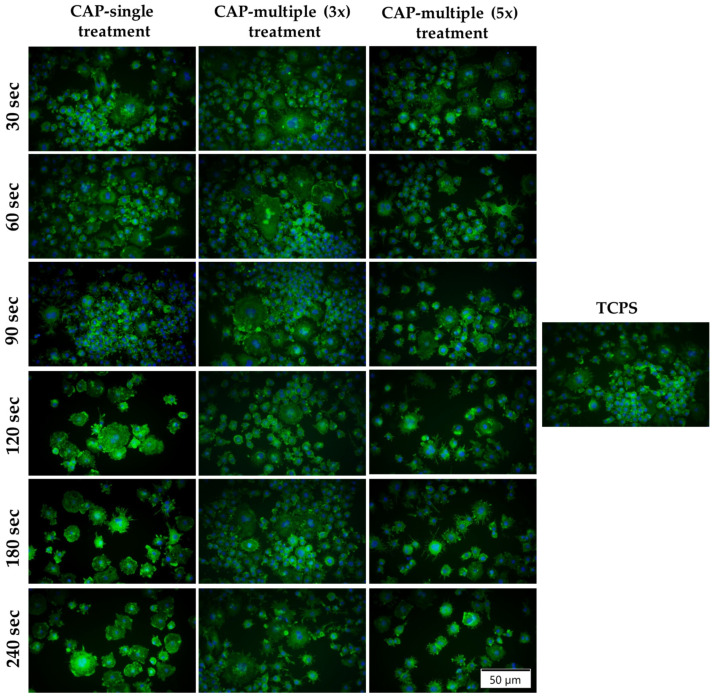
Due to its antimicrobial, anti-inflammatory and pro-healing properties, the application of cold atmospheric plasma (CAP) has emerged as a new and promising therapeutic strategy in various fields of medicine, including general medicine and dentistry. In this light, the aim of the present study was to investigate the effects of a homemade plasma jet on the cellular behaviour of two important cell types involved in gingivitis, namely gingival fibroblasts (HGF-1 cell line) and macrophages (RAW 264.7 cell line), by the direct application of CAP in different experimental conditions. The cellular behaviour of the HGF-1 cells was investigated in terms of viability/proliferation (LIVE/DEAD and CCK-8 assays), morphological features (immunofluorescent staining of the actin cytoskeleton) and fibronectin expression (immunocytochemical staining of the fibronectin network), while the macrophages' response was evaluated through the assessment of the cellular survival/proliferation rate (LIVE/DEAD and CCK-8 assays), morphological behaviour (immunofluorescent staining of the actin cytoskeleton) and inflammatory activity (pro-inflammatory cytokine secretion profile (ELISA assay) and foreign body giant cells (FBGCs) formation (immunofluorescent staining of the actin cytoskeleton and multinuclearity index determination)). The in vitro biological assessment revealed an upward trend dependent on treatment time and number of CAP applications, in terms of fibroblasts proliferation (p < 0.0001) and fibronectin expression (p < 0.0001). On the other hand, the macrophages exposed to five consecutive CAP applications for longer treatment times (over 120 s) exhibited a strong pro-inflammatory activity, as evinced by their altered morphology, pro-inflammatory cytokine profile (p < 0.0001) and FBGCs formation. Overall, our results demonstrate that CAP exposure, when used with appropriate operating parameters, has a beneficial effect on the cellular response of HGF-1 and RAW 264.7 cells, thus paving the way for further in vitro and in vivo investigations that will allow the translation of CAP treatment from research to clinic as an alternative therapy for gingivitis.

Keywords: cold atmospheric plasma; gingival fibroblasts; gingivitis; inflammation; macrophages; wound healing.


Conflict of interest statement

The authors declare no conflicts of interest.

Figures

Figure 1
Figure 1
CAP source during cell culture treatment.
Figure 2
Figure 2
The interpolation of the nitrogen second positive system.
Figure 3
Figure 3
The survival/proliferation potential of the HGF-1 cells exposed to single/multiple CAP applications, as assessed by (a) the LIVE/DEAD assay at 24 h after the final CAP treatment (live cells: green fluorescence; dead cells: red fluorescence). The size of the scale bar is 200 µm; (b) the CCK-8 technique results at the same time period of 24 h after the final CAP exposure. The results are expressed as means ± SD (n = 3, **** p < 0.0001, *** p < 0.001, ** p < 0.01 and * p < 0.05 vs. TCPS; ●●●● p < 0.0001, ●●● p < 0.001 and ●● p < 0.01 vs. 30 s; ■■■■ p < 0.0001 and ■ p < 0.05 vs. 60 s; ○○○○ p < 0.0001, ○○○ p < 0.001, ○○ p < 0.01 and ○ p < 0.05 vs. 90 s; X p < 0.05 vs. 120 s; # p < 0.05 vs. 180 s). The significance level between the three groups: ♦♦♦♦ p < 0.0001 vs. CAP single treatment; ^^^^ p < 0.0001 vs. CAP multiple (3x) treatment.
Figure 4
Figure 4
Effect of single (a)/multiple (b) CAP applications on the HGF-1 cells’ morphology, as assessed through the fluorescent labelling of the cytoskeletal proteins: actin (green fluorescence) and vinculin (red fluorescence). DAPI-labelled nuclei emit blue fluorescence. The size of the scale bar is 50 µm.
Figure 4
Figure 4
Effect of single (a)/multiple (b) CAP applications on the HGF-1 cells’ morphology, as assessed through the fluorescent labelling of the cytoskeletal proteins: actin (green fluorescence) and vinculin (red fluorescence). DAPI-labelled nuclei emit blue fluorescence. The size of the scale bar is 50 µm.
Figure 5
Figure 5
(a) Immunofluorescent labelling of the fibronectin network synthesised and organised by the HGF-1 cells exposed to either single or multiple CAP applications (fibronectin network—green fluorescence; nuclei—blue fluorescence). Scale bar represents 50 µm. (b) Fluorescence intensity measurement (n = 10, mean ± SD, **** p < 0.0001, *** p < 0.001, ** p < 0.01 and * p < 0.05 vs. TCPS; ●●●● p < 0.0001, ●●● p < 0.001, ●● p < 0.01 and ● p < 0.05 vs. 30 s; ■■■■ p < 0.0001, ■■ p < 0.01 and ■ p < 0.05 vs. 60 s). The significance level between the three groups: ♦♦♦♦ p < 0.0001 vs. CAP single treatment; ^^^^ p < 0.0001 vs. CAP multiple (3×) treatment.
Figure 6
Figure 6
The survival potential of the RAW 264.7 cells exposed to either single or multiple CAP applications, as assessed by the LIVE/DEAD assay at 24 h after the final CAP treatment (live cells—green fluorescence; dead cells—red fluorescence) in both experimental culture conditions: (a) standard culture (−LPS); (b) macrophage activation with 100 ng mL−1 LPS (+LPS). The size of the scale bar is 200 µm.
Figure 6
Figure 6
The survival potential of the RAW 264.7 cells exposed to either single or multiple CAP applications, as assessed by the LIVE/DEAD assay at 24 h after the final CAP treatment (live cells—green fluorescence; dead cells—red fluorescence) in both experimental culture conditions: (a) standard culture (−LPS); (b) macrophage activation with 100 ng mL−1 LPS (+LPS). The size of the scale bar is 200 µm.
Figure 7
Figure 7
The CCK-8 assay showing the proliferative status of the RAW 264.7 macrophages exposed to either single or multiple CAP applications under both standard (−LPS) and pro-inflammatory (+LPS) conditions (n = 3, mean ± SD, **** p < 0.0001 vs. TCPS; ●●●● p < 0.0001, ●● p < 0.01 and ● p < 0.05 vs. 30 s; ■■■■ p < 0.0001 and ■ p < 0.05 vs. 60 s; ○○○○ p < 0.0001 vs. 90 s; XXXX p < 0.0001 vs. 120 s). The significance level between the three groups: ♦♦♦♦ p < 0.0001 vs. CAP single treatment; ^^^^ p < 0.0001 vs. CAP multiple (3x) treatment.
Figure 8
Figure 8
The morphological features exhibited by the RAW 264.7 macrophages after CAP treatment under standard (−LPS) and pro-inflammatory (+LPS) culture conditions (green fluorescence—actin cytoskeleton). The size of the scale bar is 50 µm.
Figure 9
Figure 9
Quantification of the pro-inflammatory cytokines’ extracellular secretion by the LPS-stimulated RAW 264.7 macrophages (100 ng/mL LPS) subjected to CAP-exposure. ELISA measurement of (a) IL-1β—CAP multiple (3x) treatment (**** p < 0.0001 and *** p < 0.001 vs. TCPS; •••• p < 0.0001 and •• p < 0.01 vs. 30 s; ■■■■ p < 0.0001 and ■■■ p < 0.001 vs. 60 s; ○○○○ p < 0.0001 and ○○○ p < 0.001 vs.90 s; XXXX p < 0.0001 and XX p < 0.01 vs. 120 s; #### p < 0.0001 vs. 180 s). (b) IL-1β—CAP multiple (5x) treatment (**** p < 0.0001 and ** p < 0.01 vs. TCPS; •••• p < 0.0001 and • p < 0.05 vs. 30 s; ■■■■ p < 0.0001 vs. 60 s; ○○○○ p < 0.0001 vs. 90 s; XXXX p < 0.0001 vs. 120 s; #### p < 0.0001 vs. 180 s). (c) IL-6—CAP multiple (3x) treatment (**** p < 0.0001 and * p < 0.05 vs. TCPS; •••• p < 0.0001 and •• p < 0.01 vs. 30 s; ■■■■ p < 0.0001 and ■■ p < 0.05 vs. 60 s; ○○○○ p < 0.0001 and ○○ p < 0.01 vs. 90 s; XXXX p < 0.0001 and X p < 0.05 vs. 120 s; #### p < 0.0001 vs. 180 s). (d) IL-6—CAP multiple (5x) treatment (**** p < 0.0001 and *** p < 0.001 vs. TCPS; •••• p < 0.0001 and •• p < 0.0001 vs. 30 s; ■■■■ p < 0.0001 and ■■ p < 0.01 vs. 60 s; ○○○○ p < 0.0001 and ○○ p < 0.01 vs. 90 s; XXXX p < 0.0001 vs. 120 s; #### p < 0.0001 vs. 180 s). The results are expressed as means ± SD (n = 3).
Figure 10
Figure 10
Fluorescent images of the multinucleated FBGCs generated through the RAW 264.7 macrophage fusion process after CAP treatment under stimulation with LPS (green fluorescence—actin cytoskeleton; blue fluorescence—nuclei). The size of the scale bar is 50 µm.

Similar articles

References

    1. Gaton J.G., Armitage G., Berglundh T., Chapple I.L.C., Jepsen S., Kornman K.S., Mealey B.L., Papapanou P.N., Sanz M. A new classification scheme for periodontal and peri-implant diseases and conditions—Introduction and key changes from the 1999 classification. J. Periodontol. 2018;89:S1–S8. - PubMed
    1. Daleh M.H.A., Dias D.R., Kumar P. The economic and societal impact of periodontal and peri-implant diseases. Periodontol. 2000. 2024 Online ahead of print . - PubMed
    1. Pattamatta M., Chapple I., Listl S. The value-for money of preventing and managing periodontitis: Opportunities and challenges. Periodontol. 2000. 2024 doi: 10.1111/prd.12569. Online ahead of print . - DOI - PubMed
    1. Zhang X., Wang X., Wu J., Wang M., Hu B., Qu H., Zhang J., Li Q. The global burden of periodontal disease in 204 countries and territories from 1990 to 2019. Oral Dis. 2024;30:754–768. doi: 10.1111/odi.14436. - DOI - PubMed
    1. de Morais Gouvea Lima G., Borges A.C., Nishime T.M.C., de Fatima Santana-Melo G., Kostov K.G., Mayers M.P.A., Kogo-Ito C.Y. Cold Atmospheric Plasma Jet as A Possible Adjuvant Therapy for Periodontal Disease. Molecules. 2021;26:5590. doi: 10.3390/molecules26185590. - DOI - PMC - PubMed

LinkOut - more resources