

Alginate vs. Hyaluronic Acid as Carriers for Nucleus Pulposus Cells: A Study on Regenerative Outcomes in Disc Degeneration
- PMID: 39682732
- PMCID: PMC11639827
- DOI: 10.3390/cells13231984
Alginate vs. Hyaluronic Acid as Carriers for Nucleus Pulposus Cells: A Study on Regenerative Outcomes in Disc Degeneration
Abstract
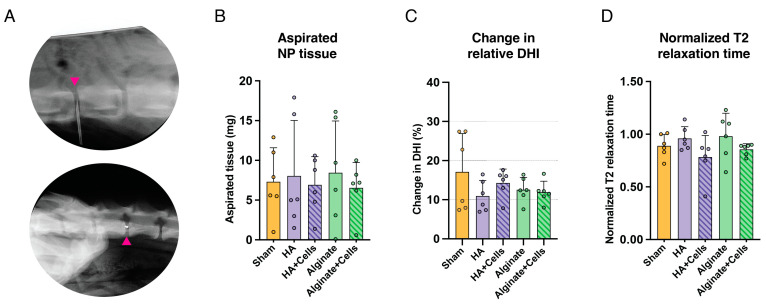
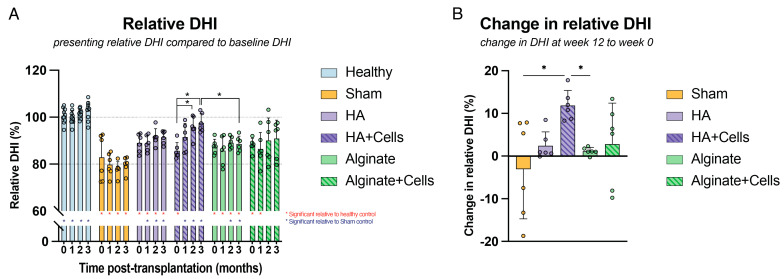
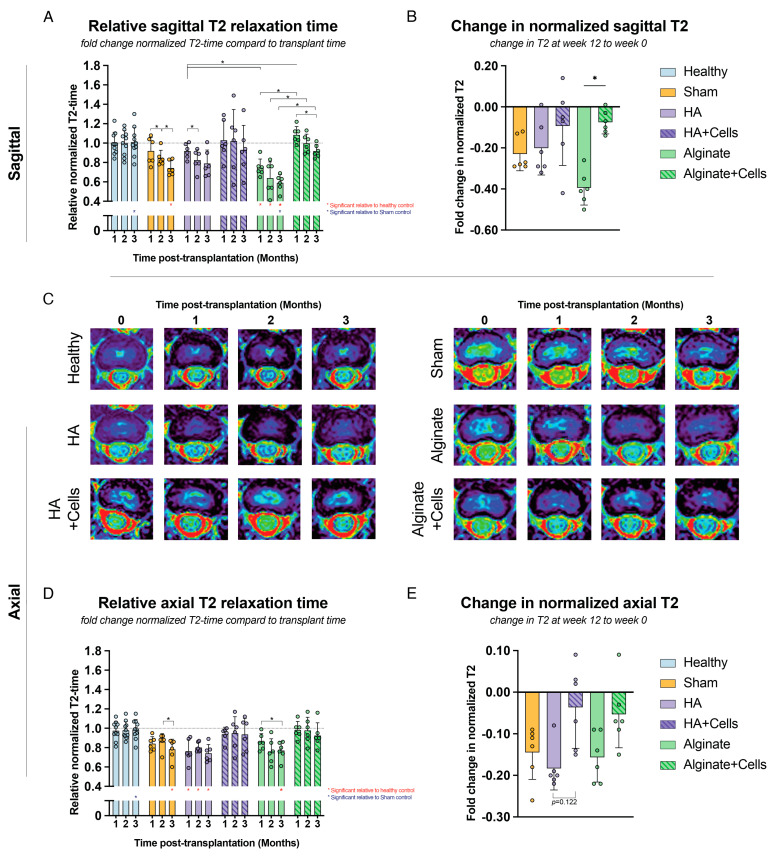
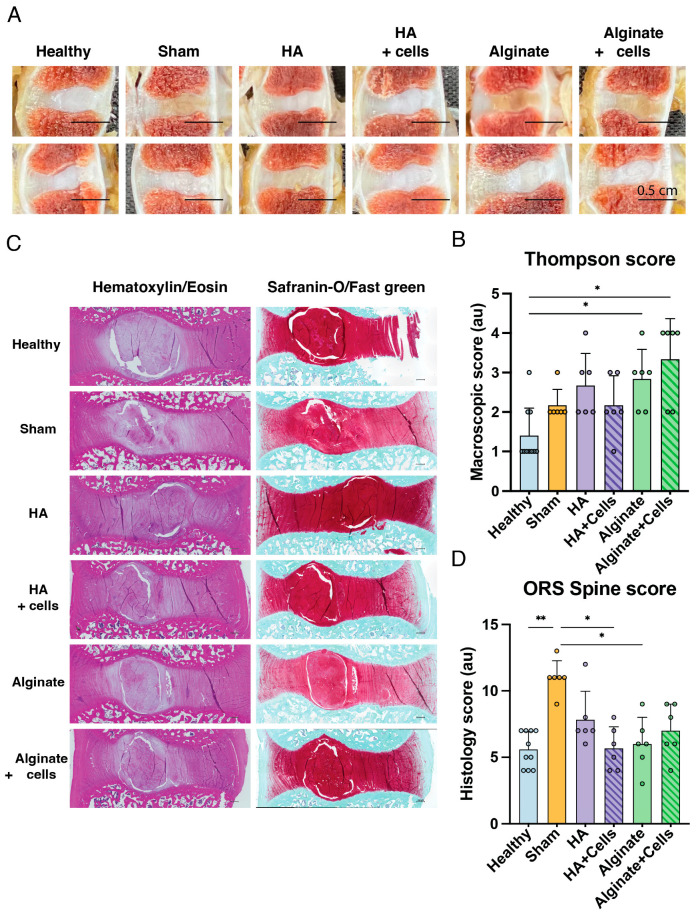
Intervertebral disc degeneration is a leading cause of chronic low back pain, affecting millions globally. Regenerative medicine, particularly cell-based therapies, presents a promising therapeutic strategy. This study evaluates the comparative efficacy of two biomaterials-hyaluronic acid (HA) and alginate-as carriers for nucleus pulposus (NP) cell transplantation in a beagle model of induced disc degeneration. NP cells were isolated, cultured, and injected with either HA or alginate into degenerated discs, with saline and non-cell-loaded carriers used as controls. Disc height index, T2-weighted MRI, and histological analyses were conducted over a 12-week follow-up period to assess reparative outcomes. Imaging revealed that both carrier and cell-loaded treatments improved outcomes compared to degenerative controls, with cell-loaded carriers consistently outperforming carrier-only treated discs. Histological assessments supported these findings, showing trends toward extracellular matrix restoration in both treatment groups. While both biomaterials demonstrated reparative potential, HA showed greater consistency in supporting NP cells in promoting disc regeneration. These results underscore HA's potential as a superior carrier for NP cell-based therapies in addressing disc degeneration.
Keywords: alginate; animal model; back pain; biomaterials; cell therapy; disc degeneration; hyaluronic acid; intervertebral disc.
Conflict of interest statement
D.S. served as a scientific advisor for TUNZ Pharma Co., Ltd. (Osaka, Japan), while T.W., Y.N., and H.S. are employees of the company. The remaining authors report no commercial or financial conflicts of interest related to this research. TUNZ Pharma did not participate in the study design, data analysis, interpretation, or in the writing and presentation of the manuscript.
Figures
Similar articles
-
Esterase-responsive kartogenin composite hydrogel microspheres boost nucleus pulposus regeneration in intervertebral disc degeneration.Acta Biomater. 2025 May 15;198:131-150. doi: 10.1016/j.actbio.2025.04.001. Epub 2025 Apr 2. Acta Biomater. 2025. PMID: 40180005
-
Genipin cross-linked type II collagen/chondroitin sulfate composite hydrogel-like cell delivery system induces differentiation of adipose-derived stem cells and regenerates degenerated nucleus pulposus.Acta Biomater. 2018 Apr 15;71:496-509. doi: 10.1016/j.actbio.2018.03.019. Epub 2018 Mar 16. Acta Biomater. 2018. PMID: 29555463
-
Regeneration of the intervertebral disc with nucleus pulposus cell-seeded collagen II/hyaluronan/chondroitin-6-sulfate tri-copolymer constructs in a rabbit disc degeneration model.Spine (Phila Pa 1976). 2011 Dec 15;36(26):2252-9. doi: 10.1097/BRS.0b013e318209fd85. Spine (Phila Pa 1976). 2011. PMID: 21358466
-
Differentiation of Pluripotent Stem Cells into Nucleus Pulposus Progenitor Cells for Intervertebral Disc Regeneration.Curr Stem Cell Res Ther. 2019;14(1):57-64. doi: 10.2174/1574888X13666180918095121. Curr Stem Cell Res Ther. 2019. PMID: 30227822 Review.
-
Intervertebral disc degeneration and regeneration: a motion segment perspective.Eur Cell Mater. 2021 Mar 24;41:370-380. doi: 10.22203/eCM.v041a24. Eur Cell Mater. 2021. PMID: 33763848 Free PMC article. Review.
Cited by
-
Innovative Approaches for the Treatment of Spinal Disorders: A Comprehensive Review.J Orthop Sports Med. 2025;7(1):144-161. doi: 10.26502/josm.511500190. Epub 2025 Mar 27. J Orthop Sports Med. 2025. PMID: 40303932 Free PMC article.
References
-
- Takahashi T., Donahue R.P., Nordberg R.C., Hu J.C., Currall S.C., Athanasiou K.A. Commercialization of regenerative-medicine therapies. Nat. Rev. Bioeng. 2023;1:906–929. doi: 10.1038/s44222-023-00095-9. - DOI
-
- Schol J., Tamagawa S., Volleman T.N.E., Ishijima M., Sakai D. A comprehensive review of cell transplantation and platelet-rich plasma therapy for the treatment of disc degeneration-related back and neck pain: A systematic evidence-based analysis. JOR Spine. 2024;7:e1348. doi: 10.1002/jsp2.1348. - DOI - PMC - PubMed
Publication types
MeSH terms
Substances
Grants and funding
LinkOut - more resources
Full Text Sources
Miscellaneous
