Comparative Study
. 2024 Dec 9;13(23):2030.
doi: 10.3390/cells13232030.

Gene-Silencing Therapeutic Approaches Targeting PI3K/Akt/mTOR Signaling in Degenerative Intervertebral Disk Cells: An In Vitro Comparative Study Between RNA Interference and CRISPR-Cas9

Affiliations
Comparative Study

Gene-Silencing Therapeutic Approaches Targeting PI3K/Akt/mTOR Signaling in Degenerative Intervertebral Disk Cells: An In Vitro Comparative Study Between RNA Interference and CRISPR-Cas9

Masao Ryu et al. Cells. .

Abstract

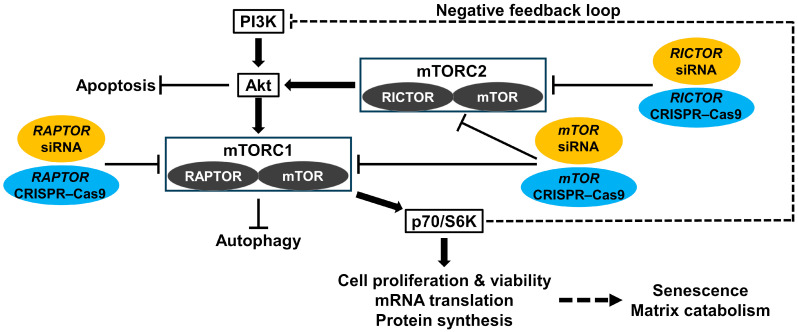
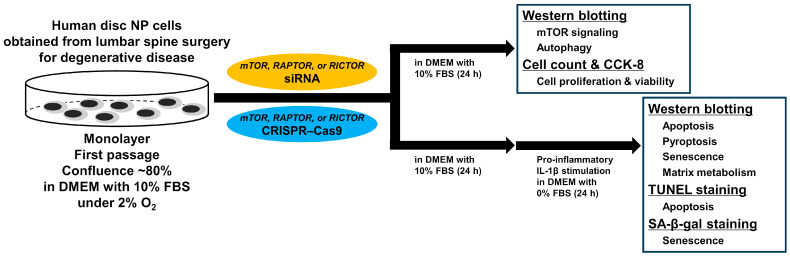
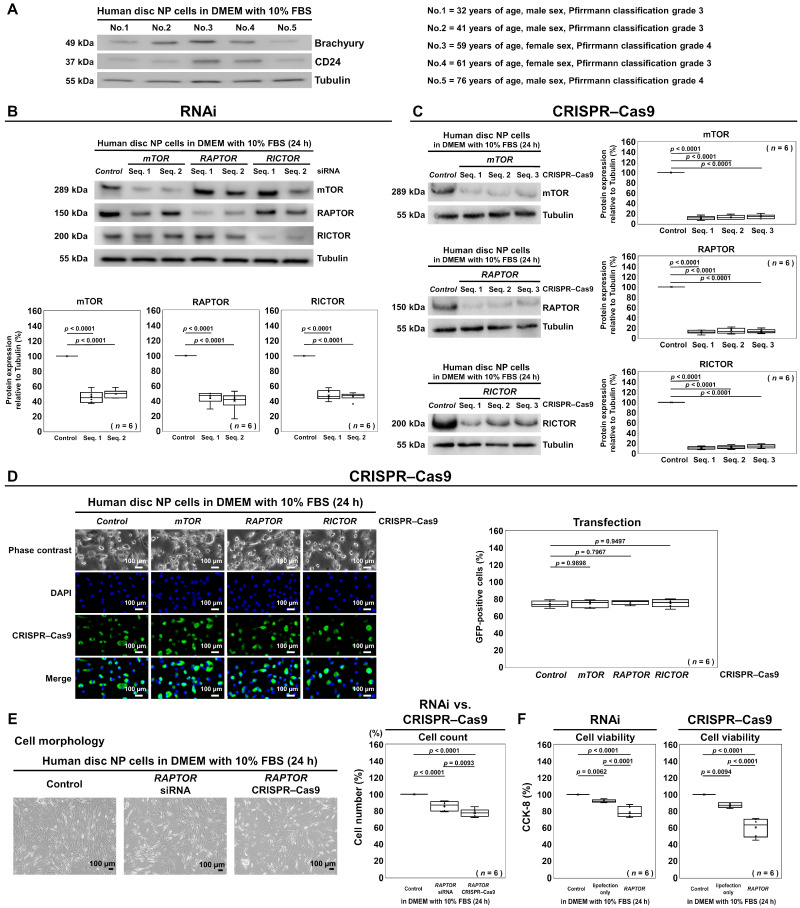
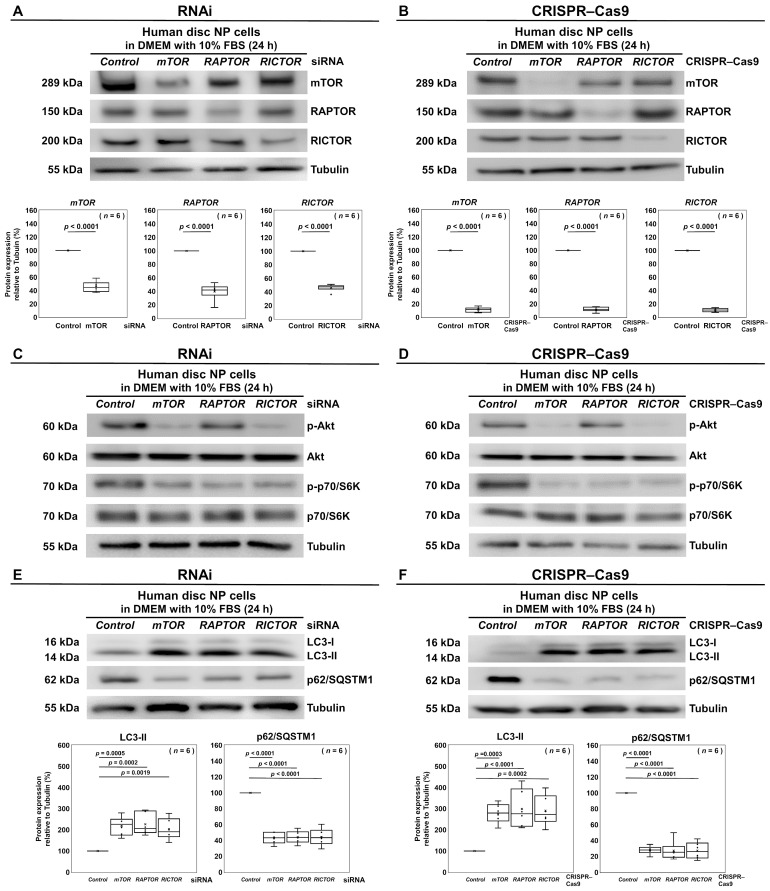
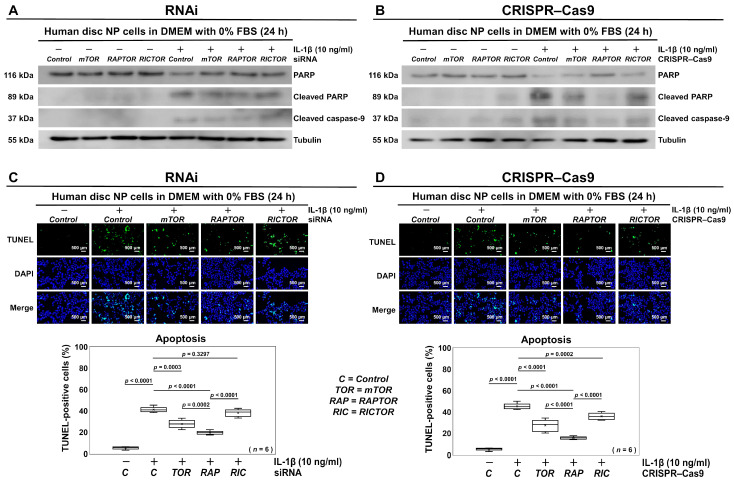
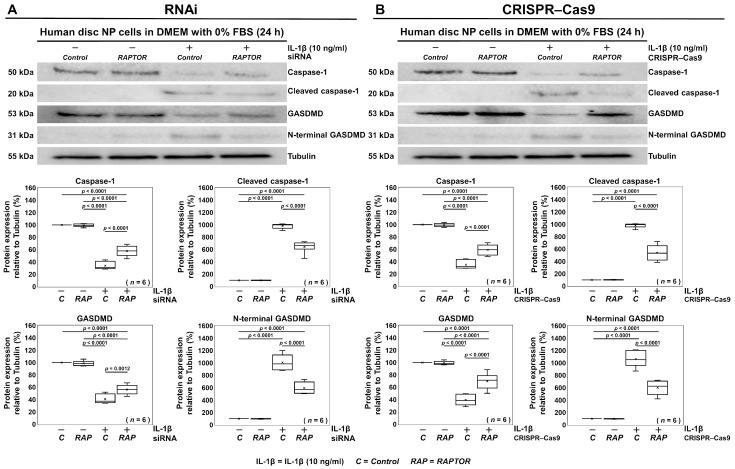
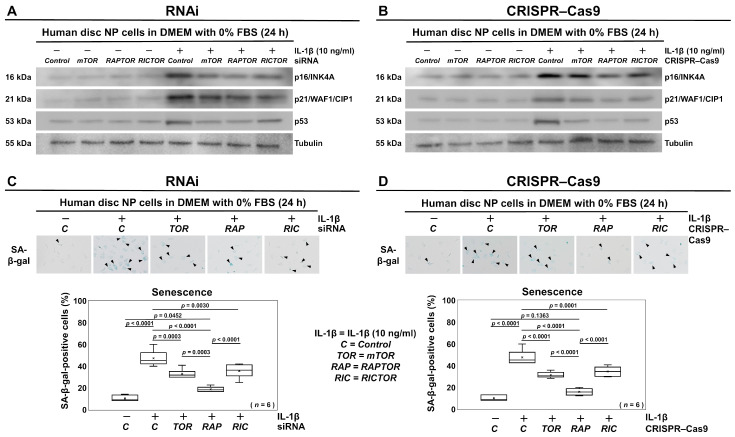
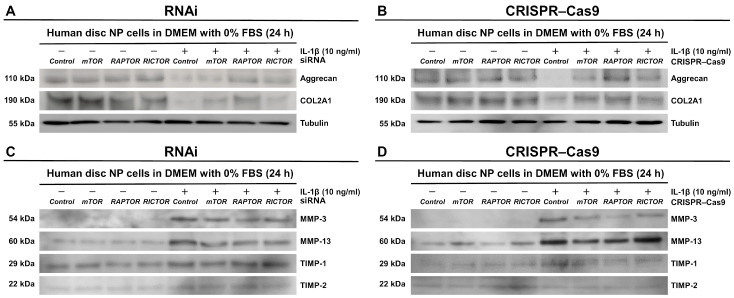
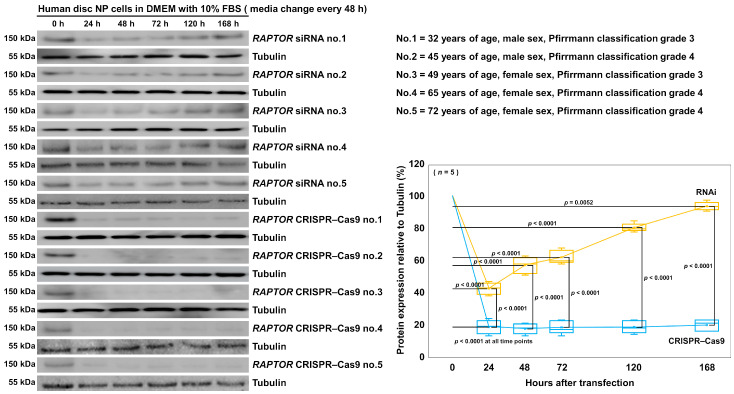
The mammalian target of rapamycin (mTOR), a serine/threonine kinase, promotes cell growth and inhibits autophagy. The following two complexes contain mTOR: mTORC1 with the regulatory associated protein of mTOR (RAPTOR) and mTORC2 with the rapamycin-insensitive companion of mTOR (RICTOR). The phosphatidylinositol 3-kinase (PI3K)/Akt/mTOR signaling pathway is important in the intervertebral disk, which is the largest avascular, hypoxic, low-nutrient organ in the body. To examine gene-silencing therapeutic approaches targeting PI3K/Akt/mTOR signaling in degenerative disk cells, an in vitro comparative study was designed between small interfering RNA (siRNA)-mediated RNA interference (RNAi) and clustered regularly interspaced short palindromic repeat (CRISPR)-CRISPR-associated protein 9 (Cas9) gene editing. Surgically obtained human disk nucleus pulposus cells were transfected with a siRNA or CRISPR-Cas9 plasmid targeting mTOR, RAPTOR, or RICTOR. Both of the approaches specifically suppressed target protein expression; however, the 24-h transfection efficiency differed by 53.8-60.3% for RNAi and 88.1-89.3% for CRISPR-Cas9 (p < 0.0001). Targeting mTOR, RAPTOR, and RICTOR all induced autophagy and inhibited apoptosis, senescence, pyroptosis, and matrix catabolism, with the most prominent effects observed with RAPTOR CRISPR-Cas9. In the time-course analysis, the 168-h suppression ratio of RAPTOR protein expression was 83.2% by CRISPR-Cas9 but only 8.8% by RNAi. While RNAi facilitates transient gene knockdown, CRISPR-Cas9 provides extensive gene knockout. Our findings suggest that RAPTOR/mTORC1 is a potential therapeutic target for degenerative disk disease.

Keywords: RNA interference (RNAi); autophagy; clustered regularly interspaced short palindromic repeat (CRISPR)–CRISPR-associated protein 9 (Cas9); disk degeneration; gene-silencing therapy; intervertebral disk; nucleus pulposus (NP) cells; phosphatidylinositol 3-kinase (PI3K)/Akt/mammalian target of rapamycin (mTOR) signaling; small interfering RNA (siRNA); spine.


Conflict of interest statement

The authors declare no conflict of interest.

Figures

Figure 1
Figure 1
Schematic illustration of human disk intracellular PI3K/Akt/mTOR signaling pathway. The mTOR is a serine/threonine kinase that integrates nutrient signals to promote drive cell growth and division. It operates within the following two primary complexes: mTORC1 and mTORC2, which include RAPTOR and RICTOR, respectively. The downstream effectors of mTORC1, such as p70/S6K, are involved in controlling cell proliferation, mRNA translation, and protein synthesis, also associated with senescence and matrix catabolism. Autophagy is tightly suppressed by mTORC1 as well. The regulation of mTORC1 is mediated by the upstream class-I PI3K, with Akt serving as a crucial pro-survival mediator that prevents apoptosis. Furthermore, the negative feedback loop between p70/S6K and the class-I PI3K exists. To analyze the cascade-dependent functions of PI3K/Akt/mTOR signaling, gene suppression was performed using both siRNA-mediated RNAi-based and CRISPR–Cas9-based methods to target mTOR for both mTORC1 and mTORC2, RAPTOR for mTORC1, and RICTOR for mTORC2.
Figure 2
Figure 2
Schematic illustration of the in vitro study design. Human degenerative intervertebral disk NP cells were surgically collected from patients who underwent lumbar discectomy or interbody fusion surgery. To retain the phenotype and replicate the physiologically hypoxic intervertebral disk environment, first-passage cells were cultured under 2% O2 until they reached ~80% confluence. Gene knockdown and knockout targeting mTOR, RAPTOR, and RICTOR were performed using both siRNA-mediated RNAi and CRISPR–Cas9, respectively. After the cells were transfected for 24 h, the suppression of mTOR, RAPTOR, and RICTOR and autophagy were evaluated by Western blotting. The cell number was counted. Cell viability was measured using the CCK-8 assay to evaluate the toxicity associated with RNAi and CRISPR–Cas9. Additionally, to mimic the clinically relevant low-nutrient and inflammatory disease conditions, following siRNA or CRISPR–Cas9 treatment for 24 h, the cells were stimulated with pro-inflammatory IL-1β in serum-free DMEM for an additional 24 h. Subsequent analyses included evaluating the apoptosis, pyroptosis, senescence, and matrix metabolism using Western blotting, TUNEL staining for apoptosis, and SA-β-gal staining for senescence.
Figure 3
Figure 3
RNAi and CRISPR–Cas9 enhance the selective suppression of mTOR, RAPTOR, and RICTOR in human disk NP cells. (A) Western blot analysis for brachyury, CD24, and tubulin in the total protein extracts from five different batches of human disk NP cells in DMEM with 10% FBS. (B) Western blot analysis for mTOR, RAPTOR, RICTOR, and tubulin in the total protein extracts of human disk NP cells 24 h post-transfection with mTOR, RAPTOR, RICTOR, or control siRNA with each of two different sequences (Seq. 1 and Seq. 2) in DMEM with 10% FBS to assess the expression levels of the target protein relative to tubulin. (C) Western blot analysis for mTOR, RAPTOR, RICTOR, and tubulin in the total protein extracts of human disk NP cells 24 h after transfection with mTOR, RAPTOR, RICTOR, or control CRISPR–Cas9 plasmid with each of the three different guide RNA sequences (Seq. 1, Seq. 2, and Seq. 3) in DMEM with 10% FBS to assess the expression levels of the target protein relative to tubulin. (D) Fluorescence for phase contrast (gray), GFP (green), DAPI (blue), and merged signals in human disk NP cells 24 h post-transfection with mTOR, RAPTOR, RICTOR, or control siRNA containing a GFP sequence in DMEM with 10% FBS to assess the transfection efficiency of the GFP-positive cells relative to the total DAPI-positive cells. (E) Morphological appearance of human disk NP cells 24 h post-transfection with RAPTOR siRNA or RAPTOR CRISPR–Cas9 plasmid in DMEM with 10% FBS to assess the number of adherent cells treated relative to the control. (F) CCK-8 assay in human disk NP cells 24 h post-transfection with control siRNA, control CRISPR–Cas9 plasmid, lipofection only, RAPTOR siRNA, or RAPTOR CRISPR–Cas9 plasmid in DMEM with 10% FBS to assess the viability of the cells treated relative to the control. Cells were counted in duplicated five random low-power fields (100×). Statistical analysis was performed using one-way repeated measures ANOVA with the Tukey–Kramer post hoc test. Data are presented with dot and box plots (n = 6). In (A), the immunoblots shown are all results from experiments with similar outcomes (n = 5). In (BE), the immunoblots and cellular images shown represent typical results from the experiments with similar outcomes (n = 6).
Figure 4
Figure 4
Selective suppression of RAPTOR/mTORC1 inhibits autophagy and p70/S6K but differentially induces Akt activation in human disk NP cells. (A) Western blot analysis for mTOR, RAPTOR, RICTOR, and tubulin in total protein extracts of human disk NP cells 24 h post-transfection with mTOR, RAPTOR, RICTOR, or control siRNA with the sequence showing the highest suppression efficiency in DMEM with 10% FBS to assess the expression levels of the target protein relative to tubulin. (B) Western blot analysis for mTOR, RAPTOR, RICTOR, and tubulin in total protein extracts of human disk NP cells 24 h after transfection with mTOR, RAPTOR, RICTOR, or control CRISPR–Cas9 plasmid with the sequence presenting the highest suppression efficiency in DMEM with 10% FBS to assess the expression levels of the target protein relative to tubulin. (C) Western blot analysis for Akt, phosphorylated Akt (p-Akt), p70/S6K, phosphorylated p70/S6K (p-p70/S6K), and tubulin in the total protein extracts of human disk NP cells 24 h post-transfection with mTOR, RAPTOR, RICTOR, or control siRNA in DMEM with 10% FBS. (D) Western blot analysis for Akt, p-Akt, p70/S6K, p-p70/S6K, and tubulin in the total protein extracts of human disk NP cells 24 h post-transfection with mTOR, RAPTOR, RICTOR, or control CRISPR–Cas9 plasmid in DMEM with 10% FBS. (E) Western blot analysis for LC3, p62/SQSTM1, and tubulin in the total protein extracts of human disk NP cells 24 h post-transfection with mTOR, RAPTOR, RICTOR, or control siRNA in DMEM with 10% FBS to assess the expression levels of the target protein relative to tubulin. (F) Western blot analysis for LC3, p62/SQSTM1, and tubulin in the total protein extracts of human disk NP cells 24 h after transfection with mTOR, RAPTOR, RICTOR, or control CRISPR–Cas9 plasmid in DMEM with 10% FBS to assess the expression levels of the target protein relative to tubulin. Statistical analysis was performed using the paired t-test or one-way repeated measures ANOVA with the Tukey–Kramer post hoc test. Data are presented with dot and box plots (n = 6). The immunoblots shown represent the typical results from experiments with similar outcomes (n = 6).
Figure 5
Figure 5
Selective suppression of RAPTOR/mTORC1 inhibits apoptosis in human disk NP cells. (A) Western blot analysis for PARP, cleaved PARP, cleaved caspase-9, and tubulin in the total protein extracts of human disk NP cells 24 h post-transfection with mTOR, RAPTOR, RICTOR, or control siRNA in 10 ng/mL IL-1β-supplemented DMEM with 0% FBS. (B) Western blot analysis for PARP, cleaved PARP, cleaved caspase-9, and tubulin in the total protein extracts of human disk NP cells 24 h after transfection with mTOR, RAPTOR, RICTOR, or control CRISPR–Cas9 plasmid in 10 ng/mL IL-1β-supplemented DMEM with 0% FBS. (C) Fluorescence for TUNEL (green), DAPI (blue), and merged signals in human disk NP cells 24 h post-transfection with mTOR, RAPTOR, RICTOR, or control siRNA in 10 ng/mL IL-1β-supplemented DMEM with 0% FBS to assess the ratio of TUNEL-positive cells relative to the total DAPI-positive cells. (D) Fluorescence for TUNEL (green), DAPI (blue), and merged signals in human disk NP cells 24 h after transfection with mTOR, RAPTOR, RICTOR, or control CRISPR–Cas9 plasmid in 10 ng/mL IL-1β-supplemented DMEM with 0% FBS to assess the ratio of TUNEL-positive cells relative to the total DAPI-positive cells. Cells were counted in duplicated five random low-power fields (100×). Statistical analysis was performed using one-way repeated measures ANOVA with the Tukey–Kramer post hoc test. Data are presented with dot and box plots (n = 6). The immunoblots and cellular images shown represent typical results from the experiments with similar outcomes (n = 6).
Figure 6
Figure 6
Selective suppression of RAPTOR/mTORC1 inhibits pyroptosis in human disk NP cells. (A) Western blot analysis for caspase-1, cleaved caspase-1, GSDMD, N-terminal GSDMD, and tubulin in the total protein extracts of human disk NP cells 24 h post-transfection with mTOR, RAPTOR, RICTOR, or control siRNA in 10 ng/mL IL-1β-supplemented DMEM with 0% FBS to assess the expression levels of the target protein relative to tubulin. (B) Western blot analysis for caspase-1, cleaved caspase-1, GSDMD, N-terminal GSDMD, and tubulin in the total protein extracts of human disk NP cells 24 h post-transfection with mTOR, RAPTOR, RICTOR, or control CRISPR–Cas9 plasmid in 10 ng/mL IL-1β-supplemented DMEM with 0% FBS to assess the expression levels of the target protein relative to tubulin. Statistical analysis was performed using one-way repeated measures ANOVA with the Tukey–Kramer post hoc test. Data are presented with dot and box plots (n = 6). The immunoblots shown represent typical results from the experiments with similar outcomes (n = 6).
Figure 7
Figure 7
Selective suppression of RAPTOR/mTORC1 inhibits senescence in human disk NP cells. (A) Western blot analysis for p16/INK4A, p21/WAF1/CIP1, p53, and tubulin in the total protein extracts of human disk NP cells 24 h post-transfection with mTOR, RAPTOR, RICTOR, or control siRNA in 10 ng/mL IL-1β-supplemented DMEM with 0% FBS. (B) Western blot analysis for p16/INK4A, p21/WAF1/CIP1, p53, and tubulin in the total protein extracts of human disk NP cells 24 h after transfection with mTOR, RAPTOR, RICTOR, or control CRISPR–Cas9 plasmid in 10 ng/mL IL-1β-supplemented DMEM with 0% FBS. (C) Colorimetric assay for the SA-β-gal signals (blue, indicated by black arrowheads) in human disk NP cells 24 h post-transfection with mTOR, RAPTOR, RICTOR, or control siRNA in 10 ng/mL IL-1β-supplemented DMEM with 0% FBS to assess the ratio of SA-β-gal-positive cells relative to the total cells. (D) Colorimetric assay for the SA-β-gal signals (blue, indicated by black arrowheads) in human disk NP cells 24 h post-transfection with mTOR, RAPTOR, RICTOR, or control CRISPR–Cas9 plasmid in 10 ng/mL IL-1β-supplemented DMEM with 0% FBS to assess the ratio of SA-β-gal-positive cells relative to the total cells. Cells were counted in duplicated five random low-power fields (100×). Statistical analysis was performed using one-way repeated measures ANOVA with the Tukey–Kramer post hoc test. Data are presented with dot and box plots (n = 6). The immunoblots and cellular images shown represent typical results from the experiments with similar outcomes (n = 6).
Figure 8
Figure 8
Selective suppression of RAPTOR/mTORC1 increases matrix anabolism through decreased catabolic enzymes in human disk NP cells. (A) Western blot analysis for aggrecan, COL2A1, and tubulin in the total protein extracts of human disk NP cells 24 h post-transfection with mTOR, RAPTOR, RICTOR, or control siRNA in 10 ng/mL IL-1β-supplemented DMEM with 0% FBS. (B) Western blot analysis for aggrecan, COL2A1, and tubulin in the total protein extracts of human disk NP cells 24 h post-transfection with mTOR, RAPTOR, RICTOR, or control CRISPR–Cas9 plasmid in 10 ng/mL IL-1β-supplemented DMEM with 0% FBS. (C) Western blot analysis for MMP-3, MMP-13, TIMP-1, and TIMP-2 in the supernatant protein extracts of human disk NP cells 24 h post-transfection with mTOR, RAPTOR, RICTOR, or control siRNA in 10 ng/mL IL-1β-supplemented DMEM with 0% FBS. (D) Western blot analysis for MMP-3, MMP-13, TIMP-1, and TIMP-2 in the supernatant protein extracts of human disk NP cells 24 h post-transfection with mTOR, RAPTOR, RICTOR, or control CRISPR–Cas9 plasmid in 10 ng/mL IL-1β-supplemented DMEM with 0% FBS. The immunoblots shown represent typical results from the experiments with similar outcomes (n = 6).
Figure 9
Figure 9
RNAi facilitates transient RAPTOR gene knockdown but CRISPR–Cas9 provides extensive RAPTOR gene knockout in human disk NP cells. Western blot analysis for RAPTOR and tubulin in the total protein extracts from five different batches of human disk NP cells at 0, 24, 48, 72, 120, and 168 h post-transfection with RAPTOR siRNA or CRISPR–Cas9 plasmid in 10% FBS-supplemented DMEM with a media change every 48 h to assess the time-course expression levels of the RAPTOR protein relative to tubulin. Statistical analysis was performed using two-way repeated measures ANOVA with the Tukey–Kramer post hoc test. Data are represented as the mean ± standard deviation (n = 5). The immunoblots shown are all results from the experiments with similar outcomes (n = 5).

Similar articles

Cited by

References

    1. Andersson G.B. Epidemiological features of chronic low-back pain. Lancet. 1999;354:581–585. doi: 10.1016/S0140-6736(99)01312-4. - DOI - PubMed
    1. Katz J.N. Lumbar disc disorders and low-back pain: Socioeconomic factors and consequences. J. Bone Jt. Surg. Am. 2006;88((Suppl. S2)):21–24. doi: 10.2106/00004623-200604002-00005. - DOI - PubMed
    1. Livshits G., Popham M., Malkin I., Sambrook P.N., Macgregor A.J., Spector T., Williams F.M. Lumbar disc degeneration and genetic factors are the main risk factors for low back pain in women: The UK Twin Spine Study. Ann. Rheum. Dis. 2011;70:1740–1745. doi: 10.1136/ard.2010.137836. - DOI - PMC - PubMed
    1. Urban J.P., Roberts S. Degeneration of the intervertebral disc. Arthritis Res. Ther. 2003;5:120–130. doi: 10.1186/ar629. - DOI - PMC - PubMed
    1. Urban J.P., Smith S., Fairbank J.C. Nutrition of the intervertebral disc. Spine. 2004;29:2700–2709. doi: 10.1097/01.brs.0000146499.97948.52. - DOI - PubMed

Publication types

MeSH terms

Substances

LinkOut - more resources