. 2024 Dec 9;13(23):2032.
doi: 10.3390/cells13232032.

The p.R66W Variant in RAC3 Causes Severe Fetopathy Through Variant-Specific Mechanisms

Affiliations

The p.R66W Variant in RAC3 Causes Severe Fetopathy Through Variant-Specific Mechanisms

Ryota Sugawara et al. Cells. .

Abstract

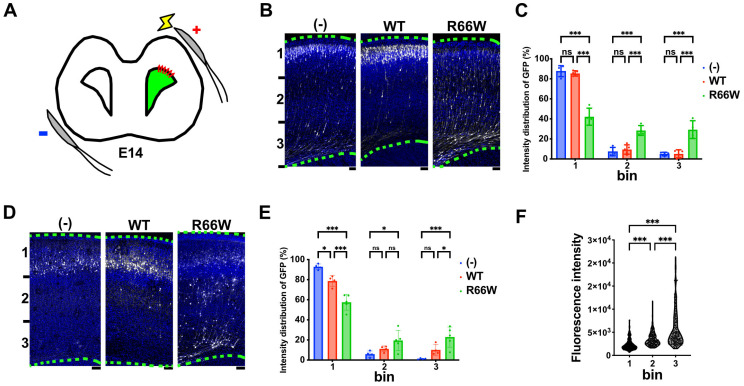
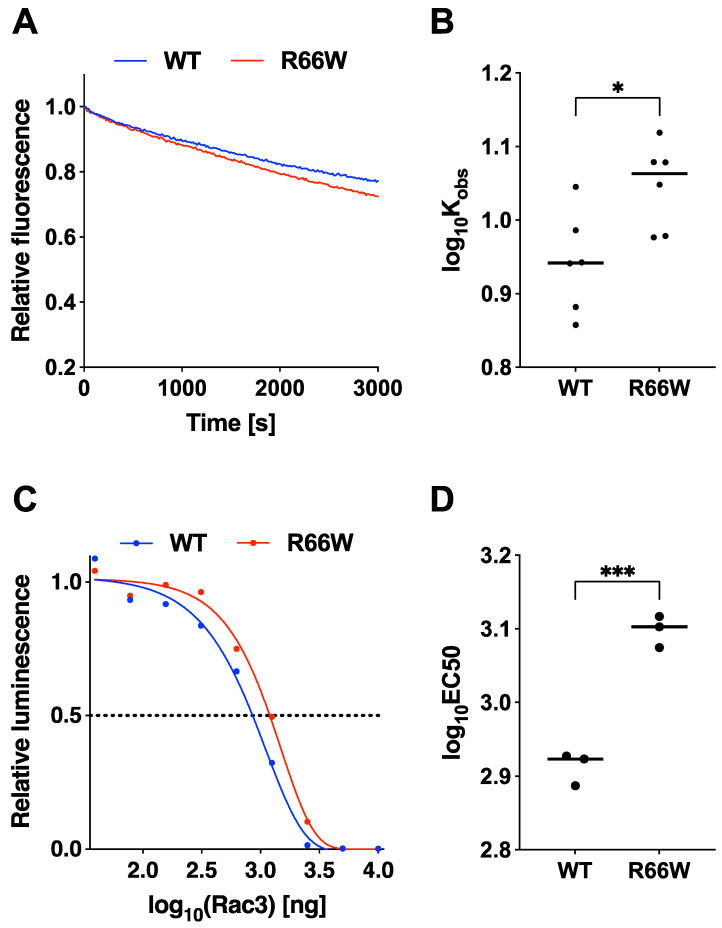
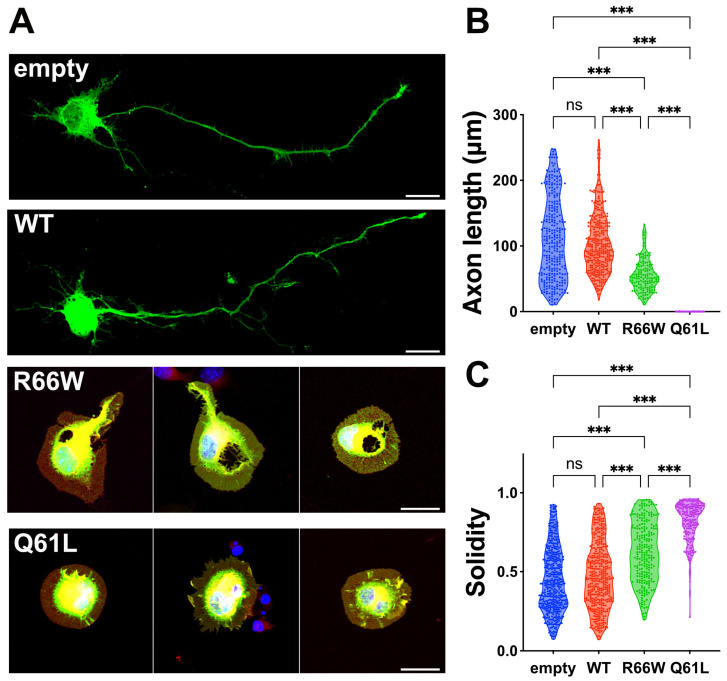
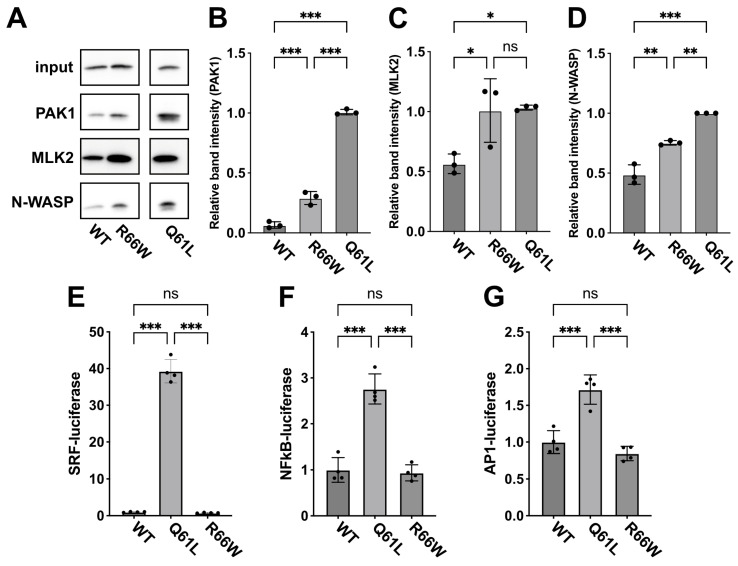
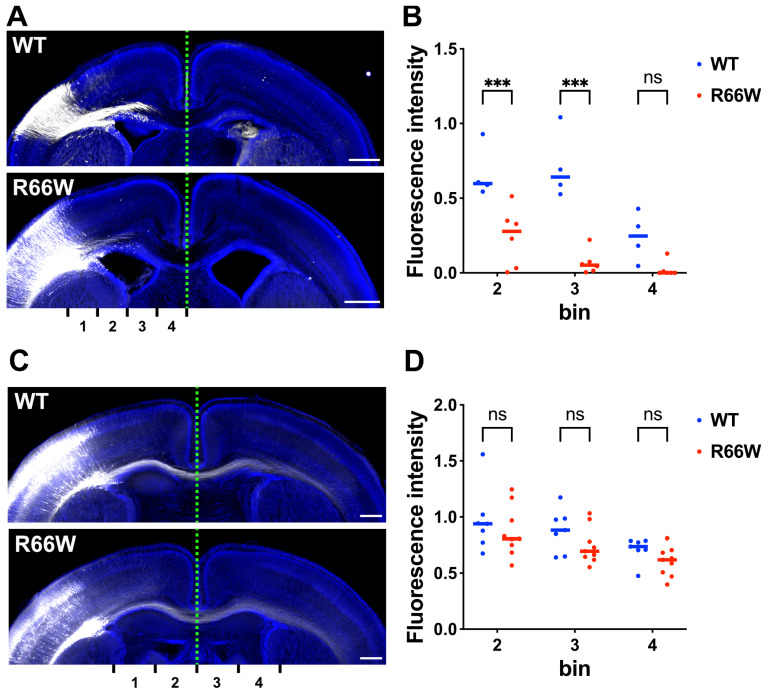
RAC3 encodes a small GTPase of the Rho family that plays a critical role in actin cytoskeleton remodeling and intracellular signaling regulation. Pathogenic variants in RAC3, all of which reported thus far affect conserved residues within its functional domains, have been linked to neurodevelopmental disorders characterized by diverse phenotypic features, including structural brain anomalies and facial dysmorphism (NEDBAF). Recently, a novel de novo RAC3 variant (NM_005052.3): c.196C>T, p.R66W was identified in a prenatal case with fetal akinesia deformation sequence (a spectrum of conditions that interfere with the fetus's ability to move), and complex brain malformations featuring corpus callosum agenesis, diencephalosynapsis, kinked brainstem, and vermian hypoplasia. To investigate the mechanisms underlying the association between RAC3 deficiency and this unique, distinct clinical phenotype, we explored the pathophysiological significance of the p.R66W variant in brain development. Biochemical assays revealed a modest enhancement in intrinsic GDP/GTP exchange activity and an inhibitory effect on GTP hydrolysis. Transient expression studies in COS7 cells demonstrated that RAC3-R66W interacts with the downstream effectors PAK1, MLK2, and N-WASP but fails to activate SRF-, AP1-, and NFkB-mediated transcription. Additionally, overexpression of RAC3-R66W significantly impaired differentiation in primary cultured hippocampal neurons. Acute expression of RAC3-R66W in vivo by in utero electroporation resulted in impairments in cortical neuron migration and axonal elongation during corticogenesis. Collectively, these findings suggest that the p.R66W variant may function as an activated version in specific signaling pathways, leading to a distinctive and severe prenatal phenotype through variant-specific mechanisms.

Keywords: RAC3; axon extension; corticogenesis; neurodevelopmental disorder; neuronal migration; small GTPase.


Conflict of interest statement

All authors declare no conflicts of interest.

Figures

Figure 4
Figure 4
Effects of the p.R66W variant on excitatory neuron migration during corticogenesis. (A) Diagram illustrating in utero electroporation performed at E14. (B,D) Migration defects of neurons expressing the p.R66W variant. pCAG-GFP (0.5 μg) was co-electroporated in utero with pCAG-Myc (-), pCAG-Myc-RAC3 (WT), or -RAC3-R66W (0.1 μg each) into the VZ progenitor cells at E14.5. Coronal sections were prepared at P0 (B) or P7 (D). Coronal slices were double-stained with anti-GFP (white) and DAPI (blue). Scale bars, (B) 50 μm, (D) 100 μm. (C,E) Quantification of the distribution of GFP-positive neurons in distinct regions of the cerebral cortex (bin 1–3) at P0 (C) and P7 (E). Number of replicates, N ≥ 4. Statistical significance between WT and each variant was determined using two-way ANOVA followed by Dunnett’s post hoc test and shown with interleaved scatter with bars. (C) (bin 1) (-) vs. WT, p = 0.82; (-) vs. R66W, p < 0.001; WT vs. R66W, p < 0.001. (bin 2) (-) vs. WT, p = 0.84; (-) vs. R66W, p < 0.001; WT vs. R66W, p < 0.001. (bin 3) (-) vs. WT, p = 0.99; (-) vs. R66W, p < 0.001; WT vs. R66W, p < 0.001. (E) (bin 1) (-) vs. WT, p = 0.01; (-) vs. R66W, p < 0.001; WT vs. R66W, p < 0.001. (bin 2) (-) vs. WT, p = 0.51; (-) vs. R66W, p = 0.01; WT vs. R66W, p = 0.16. (bin 3) (-) vs. WT, p = 0.15; (-) vs. R66W, p < 0.001; WT vs. R66W, p < 0.02. (F) GFP intensity in individual cells expressing Rac3-R66W in bin 1–3 at P0. Number, N ≥ 149. Statistical significance was determined using one-way ANOVA with Tukey’s post hoc test (p < 0.033). bin 1 vs. bin 2, p < 0.001; bin 2 vs. bin 3, p < 0.001; bin 2 vs. bin 3, p < 0.001. * p < 0.033, *** p < 0.001. ns, not significant.
Figure 1
Figure 1
Effects of the p.R66W variant on GDP/GTP-exchange and GTP-hydrolysis activities of RAC3. (A) GDP/GTP-exchange activity: Recombinant His-tagged RAC3 (WT) and RAC3-R66W (R66W) proteins were preloaded with fluorescent mantGDP and incubated with non-hydrolysable GTP analog, monitoring relative fluorescence over time. (B) mantGDP-dissociation rates: Dissociation rates of WT and R66W were determined as observed rate constants (Kobs [×10−5 s−1]) based on the data in (A). Samples sizes: WT, N = 6; R66W, N = 6. Different letters above boxes denote statistically significant differences (p < 0.033) by Tukey’s test. R66W vs. WT, p = 0.02. * p < 0.05. (C) GTP-hydrolysis activity: GTPase activity of His-RAC3 (WT) and -RAC3-R66W (R66W) was measured by tracking GTP concentration changes using a GTPase-Glo assay kit. (D) EC50 values: Half maximal effective concentration (EC50) values were derived from the sigmoidal fitting curve in (C). Sample sizes: WT, N = 3; R66W, N = 3. Statistical significance was calculated as in (B), with R66W vs. WT at p = 0.0005. *** p < 0.001.
Figure 2
Figure 2
Effects of the p.R66W variant on neuron morphology in vitro. (A) Primary hippocampal neurons harvested from E16 embryos were co-electroporated with pCAG-GFP (0.1 μg) along with pCAG-Myc (-), pCAG-Myc-RAC3 (WT), RAC3-R66W, or RAC3-Q61L (0.3 μg each). After 3 days in vitro, the cells were fixed and co-stained with anti-GFP (green), rhodamine phalloidin (red) and DAPI (blue). Scale bars, 10 μm. (B,C) Quantification of neuron morphology from (A). (B) Length of axon (the longest neurite) of GFP-positive neurons shown as violin plots with dots. The number of neurons was as follows: (–), N = 280; WT, N = 324; R66W, N = 145; Q61L, N = 133. Statistical significance was determined using one-way ANOVA with Tukey’s post hoc test (p < 0.033). (-) vs. WT, p = 0.3; (-) vs. R66W, p < 0.001; (-) vs. Q61L, p < 0.001; WT vs. R66W, p < 0.001; WT vs. Q61L, p < 0.001; R66W vs. Q61L, p < 0.001. (C) Cell solidity of GFP-positive neurons was shown in violin plots with boxplots. “Solidity” is the ratio of the area of a cell to the area of a convex hull of the cell [16]. The number of neurons was as follows: (–), N = 4825; WT, N = 392; R66W, N = 231; Q61L, N = 205. Statistical significance was determined using one-way ANOVA with Tukey’s post hoc test (p < 0.033). (-) vs. WT, p = 0.26; (-) vs. R66W, p < 0.001; (-) vs. Q61L, p < 0.001; WT vs. R66W, p < 0.001; WT vs. Q61L, p < 0.001; R66W vs. Q61L, p < 0.001. *** p < 0.001. ns, not significant.
Figure 3
Figure 3
Effects of the p.R66W variant on RAC3 interactions with downstream signaling pathways. (A) Evaluation of binding to the PBD of PAK1, MLK2, and N-WASP. COS7 cells were transfected with pCAG-Myc-RAC3 (WT) or -RAC3-R66W (R66W) (0.3 μg each). Pull-down assays utilizing GST-PAK1-PBD, -MLK2, or -N-WASP (5 μg each) were performed as detailed in the “Materials and methods”. Bound RAC3 was detected by western blotting with anti-Myc, and total cell lysates were also probed with anti-Myc to ensure proper normalization (Input). Uncropped blotting data are shown in Supplementary Figure S1. (BD) Quantification of RAC3 bound to GST-PBD-PAK1 (B), GST-PBD-MLK2 (C), or GST-PBD-N-WASP (D) was carried out. The relative intensity of the bands is displayed, with RAC3-Q61L set to a reference value of 1.0. N = 3 replicates. Statistical significance was determined using one-way ANOVA with Tukey’s post hoc test (p < 0.033). (B) WT vs. R66W, p < 0.001; WT vs. Q61L, p < 0.001; R66W vs. Q61L, p < 0.001. (C) WT vs. R66W, p = 0.03; WT vs. Q61L, p = 0.03; R66W vs. Q61L, p = 0.98. (D) WT vs. R66W, p = 0.001; WT vs. Q61L, p < 0.001; R66W vs. Q61L, p < 0.002. * p < 0.033, ** p < 0.002, *** p < 0.001. (EG) Effects of the p.R66W variant on SRF-, NFkB- and AP1-dependent gene transcription. COS7 cells were co-transfected with pCAG-Myc, -Myc-RAC3-WT, and -RAC3-R66W (0.1 μg each/well) in various combinations, along with luciferase reporter plasmids for SRF, NFkB, or AP1 (0.05 μg each/well). The Luciferase activity from the wild-type control was defined as 1.0, with relative activities presented as scatter plots with bars. N = 4 replicates. Statistical significance was determined using one-way ANOVA with Tukey’s post hoc test (p < 0.033). (E) WT vs. Q61L, p < 0.001; WT vs. R66W, p = 0.98; Q61L vs. R66W, p < 0.001. (F) WT vs. Q61L, p < 0.001; WT vs. R66W, p = 0.94; Q61L vs. R66W, p < 0.001. (G) WT vs. Q61L, p < 0.001; WT vs. R66W, p = 0.39; Q61L vs. R66W, p < 0.001. ns, not significant.
Figure 5
Figure 5
Effects of the p.R66W variant on axonal extension during cortical development in vivo. (A,C) pCAG-GFP was co-electroporated at E14 with either pCAG-Myc-RAC3 (WT) or -RAC3-R66W (0.1 μg each). Coronal sections were prepared at P0 (A) or P7 (C) and visualized using GFP (white). DAPI staining (blue) of a slice is also shown. Scale bars, 500 μm (A,C). (B,D) The GFP intensity of the callosal axon was measured at P0 (B) or P7 (D) in different regions (bin 1–4), and then the relative intensities of bins were normalized with bin 1 as 1.0. Statistical significance between WT and each variant was determined using two-way ANOVA and shown with interleaved scatter with bars. (B) The number of brains was as follows: WT, N = 4; R66W, N = 6. bin 2, p < 0.001; bin 3, p < 0.001; bin 4, p = 0.11. (D) The number of brains was as follows: WT, N = 7; R66W, N = 9. bin 2, p = 0.66; bin 3, p = 0.42; bin 4, p = 0.59. *** p < 0.001. ns, not significant.

Similar articles

References

    1. Aspenström P., Fransson Å., Saras J. Rho GTPases Have Diverse Effects on the Organization of the Actin Filament System. Biochem. J. 2004;377:327–337. doi: 10.1042/bj20031041. - DOI - PMC - PubMed
    1. Wennerberg K., Der C.J. Rho-Family GTPases: It’s Not Only Rac and Rho (and I like It) J. Cell Sci. 2004;117:1301–1312. doi: 10.1242/jcs.01118. - DOI - PubMed
    1. Burridge K., Wennerberg K. Rho and Rac Take Center Stage. Cell. 2004;116:167–179. doi: 10.1016/S0092-8674(04)00003-0. - DOI - PubMed
    1. Stankiewicz T.R., Linseman D.A. Rho Family GTPases: Key Players in Neuronal Development, Neuronal Survival, and Neurodegeneration. Front. Cell. Neurosci. 2014;8:314. doi: 10.3389/fncel.2014.00314. - DOI - PMC - PubMed
    1. Hall A. Rho GTPases and the Actin Cytoskeleton. Science. 1998;279:509–514. doi: 10.1126/science.279.5350.509. - DOI - PubMed

Publication types

Substances

LinkOut - more resources