. 2024 Nov 26;13(23):3309.
doi: 10.3390/plants13233309.

An Integrative Analysis of the Transcriptome and Proteome of Rice Grain Chalkiness Formation Under High Temperature

Affiliations

An Integrative Analysis of the Transcriptome and Proteome of Rice Grain Chalkiness Formation Under High Temperature

Shaolu Zhao et al. Plants (Basel). .

Abstract

Exposure to high temperatures can impair the grain-filling process in rice (Oryza sativa L.), potentially leading to the formation of chalky endosperm, but the molecular regulation mechanism remains largely elusive. Here, we reported that high-temperature (HT) stress (day/night, 35 °C/30 °C) reduces both the grain-filling rate and grain weight of Ningjing 1 variety compared to normal temperatures (NT, day/night, 28 °C/23 °C). Grains under HT stress exhibited an opaque, milky-white appearance, alongside significant alterations in starch physicochemical properties. An integrated transcriptomic analysis of grains under HT revealed up-regulation of genes related to defense mechanisms and oxidoreductase activity, while genes involved in sucrose and starch synthesis were down-regulated, and α-amylase genes were up-regulated. Proteomic analysis of grains under HT echoed this pattern. These results demonstrate that high temperature during the grain-filling stage significantly increases rice chalkiness by down-regulating genes related to sucrose and starch synthesis, while up-regulating those involved in starch degradation.

Keywords: high temperature; proteome; rice quality; starch biosynthesis; transcriptome.


Conflict of interest statement

The authors declare no conflicts of interest.

Figures

Figure 1
Figure 1
Characterization of cv. NJ1 under normal-temperature (NT) and high-temperature (HT) treatment. (A) Dry brown grains of NJ1 under NT (above) and HT (below) at various stages of development. (B) Weight of dry brown grains of NJ1 under NT and HT at various stages of grain filling. DAF, days after fertilization. (C) Grain length, width, and thickness of NJ1 under NT and HT. (D) Comparison of phenotype of cross-sections of NJ1 mature brown grains between NT and HT; scale bar, 5 mm. (E) Phenotypic comparison of the NJ1 brown grains between NT and HT; scale bar, 5 mm. (F) Scanning electron microscopy (SEM) images of transverse sections of NJ1 endosperm under NT and HT; scale bar, 10 µΜ. Data in (B,C) are presented as mean from three replicates. Asterisks indicate statistical significance between NT and HT determined by Student’s t-tests (* p < 0.05; ** p < 0.01).
Figure 2
Figure 2
Physicochemical characteristics of NJ1 starch in NT and HT. (AC) Contents of total starch (A), amylose and (B) protein (C) per grain in NT and HT. (D) Difference in amylopectin chain length distribution of NJ1 starch between NT and HT. (E) Pasting properties of NJ1 endosperm starch in NT and HT. Black line indicates temperature changes during measurement. (F) Gelatinization temperature of endosperm starch in NT and HT. TO, TP, TC, and △H represent onset, peak, conclusion gelatinization temperature, and enthalpy, respectively. (G) Urea dissolving properties of starch in NT and HT. Starch powder was mixed with different concentrations (1 to 9 M) of urea solution. Asterisks indicate starch in HT is more difficult to gelatinize in 6–9 M urea solution than that of NT. All data are presented as mean = ±SD from three replicates. Asterisks indicate statistical significance between NT and HT determined by Student’s t-tests (* p < 0.05; ** p < 0.01).
Figure 3
Figure 3
Differentially expressed genes and proteins in HT as compared to those in NT. (A) Numbers in columns are numbers of genes/proteins. (B) Volcano plot of transcripts. Red points indicating up-regulated genes, blue ones indicating down-regulated genes. Genes in starch-synthesis pathway are labeled. (C) KEGG enrichment of both different expression genes (left) and proteins (right) with p value < 0.05. Pathways enriched in both genes and proteins were marked as red.
Figure 4
Figure 4
GO and KEGG analyses of gene and protein responses to high temperature. Differentially expressed genes/proteins are shown in letters with red and green backgrounds, respectively, to indicate either a rise or a fall in abundance. Full forms of the abbreviated ID’s are given in Table S5.
Figure 5
Figure 5
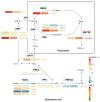
The differences of gene expression or protein abundance related to starch or sucrose metabolic pathways involved in response to high temperature. The red and green backgrounds indicate either a rise or a fall in abundance (grey indicates no significant differences). lg(FPKM + 1) of genes are shown as heatmaps. The asterisks on the right of heatmaps indicate the significant differences on genes expressed level (p < 0.05). The labels beside heatmaps indicate corresponding proteins, and its color indicates the log2(fold-change) of proteins, the asterisks beside the labels indicate significant differences of proteins abundance (p < 0.05).
Figure 6
Figure 6
The confirmation of the differential abundance of genes and proteins obtained by, respectively, Western blot and qRT-PCR analysis. (A) The Western blot analysis of the differentially expressed proteins related to starch metabolism. (B) The qRT-PCR analysis of differential abundance of genes in HT as compared to those in NT. Values are means ± SD (n = 3); the asterisks indicate statistical significance between the HT and NT, as determined by Student’s t-test (** p ≤ 0.01). The rice genes Actin and Ubiquitin were used as the reference sequences.

Similar articles

References

    1. Yang W., Liang J., Hao Q., Luan X., Tan Q., Lin S., Zhu H., Liu G., Liu Z., Bu S., et al. Fine mapping of two grain chalkiness QTLs sensitive to high temperature in rice. Rice. 2021;14:33. doi: 10.1186/s12284-021-00476-x. - DOI - PMC - PubMed
    1. Liao J.L., Zhou H.W., Peng Q., Zhong P.A., Zhang H.Y., He C., Huang Y.J. Transcriptome changes in rice (Oryza sativa L.) in response to high night temperature stress at the early milky stage. BMC Genom. 2015;16:18. doi: 10.1186/s12864-015-1222-0. - DOI - PMC - PubMed
    1. Peng S., Huang J., Sheehy J.E., Laza R.C., Visperas R.M., Zhong X., Centeno G.S., Khush G.S., Cassman K.G. Rice yields decline with higher night temperature from global warming. Proc. Natl. Acad. Sci. USA. 2004;101:9971–9975. doi: 10.1073/pnas.0403720101. - DOI - PMC - PubMed
    1. Zhao D., Zhang C., Li Q., Liu Q. Genetic control of grain appearance quality in rice. Biotechnol. Adv. 2022;60:108014. doi: 10.1016/j.biotechadv.2022.108014. - DOI - PubMed
    1. Nevame A.Y.M., Emon R.M., Malek M.A., Hasan M.M., Alam A., Muharam F.M., Aslani F., Rafii M.Y., Ismail M.R. Relationship between High Temperature and Formation of Chalkiness and Their Effects on Quality of Rice. Biomed. Res. Int. 2018;2018:1653721. doi: 10.1155/2018/1653721. - DOI - PMC - PubMed

LinkOut - more resources