. 2024 Nov 30;13(23):3377.
doi: 10.3390/plants13233377.

Genome-Wide Identification, Classification, Expression Analysis, and Screening of Drought and Heat Resistance-Related Candidates of the Rboh Gene Family in Wheat

Affiliations

Genome-Wide Identification, Classification, Expression Analysis, and Screening of Drought and Heat Resistance-Related Candidates of the Rboh Gene Family in Wheat

Miyuan Cao et al. Plants (Basel). .

Abstract

Plant respiratory burst oxidase homologs (Rbohs) are key enzymes that produce reactive oxygen species (ROS), which serve as signaling molecules regulating plant growth and stress responses. In this study, 39 TaRboh genes (TaRboh01-TaRboh39) were identified. These genes were distributed unevenly among the wheat genome's fourteen chromosomes, with the exception of homoeologous group 2 and 7 and chromosomes 4A, as well as one unidentified linkage group (Un). TaRbohs were classified into ten distinct clades, each sharing similar motif compositions and gene structures. The promoter regions of TaRbohs contained cis-elements related to hormones, growth and development, and stresses. Furthermore, five TaRboh genes (TaRboh26, TaRboh27, TaRboh31, TaRboh32, and TaRboh34) exhibited strong evolutionary conservation. Additionally, a Ka/Ks analysis confirmed that purifying selection was the predominant force driving the evolution of these genes. Expression profiling and qPCR results further indicated differential expression patterns of TaRboh genes between heat and drought stresses. TaRboh11, TaRboh20, TaRboh22, TaRboh24, TaRboh29, and TaRboh34 were significantly upregulated under multiple stress conditions, whereas TaRboh30 was only elevated in response to drought stress. Collectively, our findings provide a systematic analysis of the wheat Rboh gene family and establish a theoretical framework for our future research on the role of Rboh genes in response to heat and drought stress.

Keywords: Rbohs; Triticum aestivum; abiotic stress; expression patterns; reactive oxygen species.


Conflict of interest statement

The authors declare no conflicts of interest.

Figures
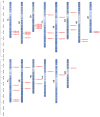
Figure 1
Figure 1
Locations of 39 TaRboh genes in the wheat genome. The color variation on the chromosomes represents gene density, ranging from low (white) to high (blue).
Figure 2
Figure 2
Rboh gene family in wheat, Arabidopsis, and rice. (A) The phylogenetic tree constructed for Rhoh sequences from wheat, Arabidopsis, and rice using MEGA-X based on the neighbor-joining (NJ) method with the p-distance substitution model (gamma = 1) and 1000 bootstrap replicates. The Rboh proteins of wheat are denoted by red circles. The Rboh proteins of rice are denoted by green squares. The Rboh proteins of Arabidopsis are denoted by purple pentagrams. (B) The number of Rboh genes belonging to different groups in wheat, Arabidopsis, and rice, respectively.
Figure 3
Figure 3
Evolutionary relationships, conserved motifs, and gene structures of TaRboh genes. (A) Phylogenetic tree of TaRboh genes constructed using MEGA-X with the Maximum Likelihood (ML) method. (B) Conserved motifs in TaRboh proteins, with fifteen distinct motifs identified. (C) Structures of TaRboh genes, where green rectangles represent untranslated regions (UTRs), yellow rectangles denote exons, and short lines indicate introns.
Figure 4
Figure 4
Distribution of cis-elements in the promoter regions of the TaRboh genes. The color and number of grids represent the quantity of cis-elements in each of the TaRboh genes.
Figure 5
Figure 5
Collinearity analysis of TaRboh genes in wheat. Red lines indicate the segmentally duplicated TaRboh gene pairs in wheat. Gray lines indicate other gene pairs, excluding TaRboh genes. Chromosome lengths (Mb) are marked on the scale bar.
Figure 6
Figure 6
Synteny analysis of TaRboh genes between wheat and six other plant species (maize, rice, Brachypodium, Glycine, Arabidopsis, and Aegilops) based on the species’ evolutionary tree on the left. (A) Evolutionary relationships among the seven species predicted based on their whole genomes. Node numbers represent the estimated divergence times. (B) Collinearity relationships among the seven plant species based on the TaRboh genes in wheat. Gray lines in the background indicate syntenic blocks between adjacent species, while the blue lines highlight the linked genes identified.
Figure 7
Figure 7
Protein–protein interaction network and miRNA target analysis of TaRbohs. (A) Red represents 13 TaRboh proteins with a high degree of 26. Blue represents 26 TaRboh proteins with a low degree of 12. (B) Sankey diagram depicting relationships of TaRboh transcripts targeted by miRNAs. The three columns represent miRNA, TaRboh, and the inhibition effect. Different colors are used to distinguish different mirnas, different TaRbohs, and different the inhibition effects.
Figure 8
Figure 8
Expression profiles of TaRboh genes under different stress conditions. (A) Heatmap showing expression of TaRbohs under different treatments. Gene expression is expressed in log2(TPM+1). Relative expression levels under three different abiotic stress conditions (control (CK), drought stress for 1 h (DS-1), drought stress for 6 h (DS-6), heat stress for 1 h (HS-1), heat stress for 6 h (HS-6), combined drought and heat stress for 1 h (DHS-1), combined drought and heat stress for 6 h (DHS-6)). CK: control. DS-1 (6): drought stress for 1 (6) h; HS-1 (6): heat stress for 1 (6) h; DHS-1 (6): combined drought and heat stress for 1 (6) h. (B) Quantitative expression of nine TaRboh genes in response to abiotic treatments including drought, heat and drought, and heat at 1 h and 6 h following treatments. The error bars indicate the standard deviations and the values in plots corresponding to the mean ± standard deviation (SD) of three independent biological replicates (* p < 0.05; ** p < 0.01; *** p < 0.001; **** p < 0.0001).

Similar articles

References

    1. Torres M.A., Dangl J.L. Functions of the Respiratory Burst Oxidase in Biotic Interactions, Abiotic Stress and Development. Curr. Opin. Plant Biol. 2005;8:397–403. doi: 10.1016/j.pbi.2005.05.014. - DOI - PubMed
    1. Sagi M., Fluhr R. Production of Reactive Oxygen Species by Plant NADPH Oxidases. Plant Physiol. 2006;141:336–340. doi: 10.1104/pp.106.078089. - DOI - PMC - PubMed
    1. Marino D., Dunand C., Puppo A., Pauly N. A Burst of Plant NADPH Oxidases. Trends Plant Sci. 2012;17:9–15. doi: 10.1016/j.tplants.2011.10.001. - DOI - PubMed
    1. Suzuki N., Koussevitzky S., Mittler R., Miller G. ROS and Redox Signalling in the Response of Plants to Abiotic Stress. Plant Cell Environ. 2012;35:259–270. doi: 10.1111/j.1365-3040.2011.02336.x. - DOI - PubMed
    1. Yu S., Kakar K.U., Yang Z., Nawaz Z., Lin S., Guo Y., Ren X.-L., Baloch A.A., Han D. Systematic Study of the Stress-Responsive Rboh Gene Family in Nicotiana Tabacum: Genome-Wide Identification, Evolution and Role in Disease Resistance. Genomics. 2020;112:1404–1418. doi: 10.1016/j.ygeno.2019.08.010. - DOI - PubMed

LinkOut - more resources