. 2024 Dec 9;13(23):3453.
doi: 10.3390/plants13233453.

Physiological and Biochemical Responses of Pseudocereals with C3 and C4 Photosynthetic Metabolism in an Environment with Elevated CO2

Affiliations

Physiological and Biochemical Responses of Pseudocereals with C3 and C4 Photosynthetic Metabolism in an Environment with Elevated CO2

Bruna Evelyn Paschoal Silva et al. Plants (Basel). .

Abstract

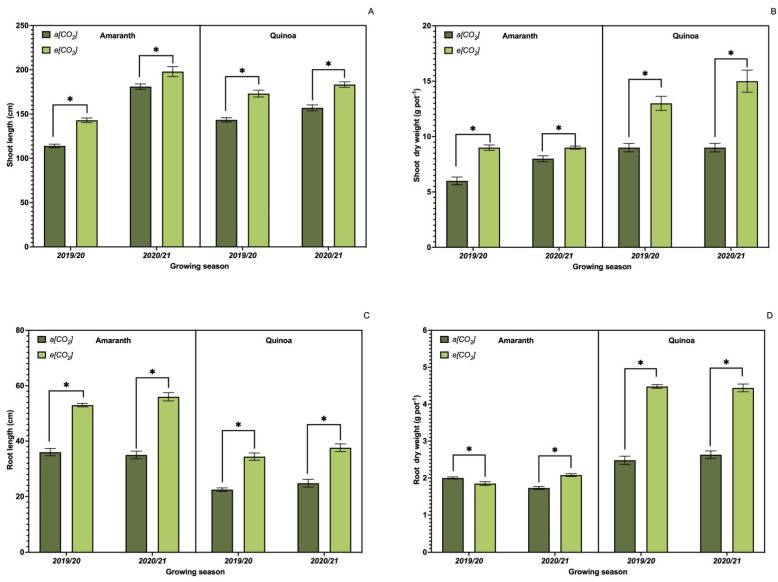
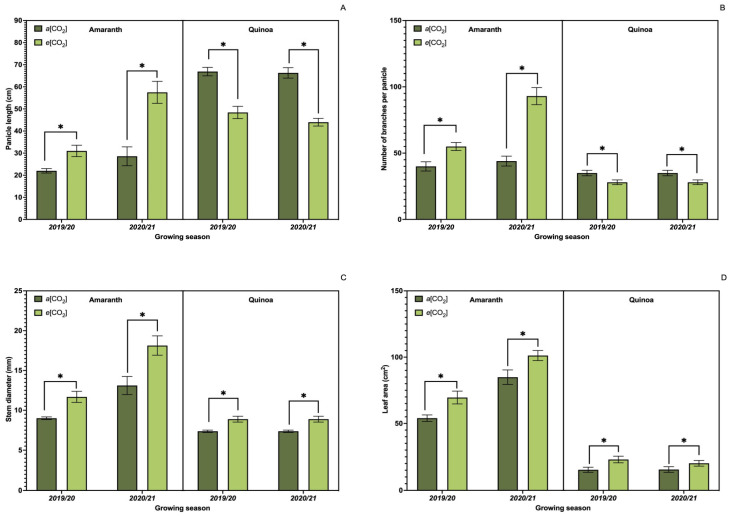
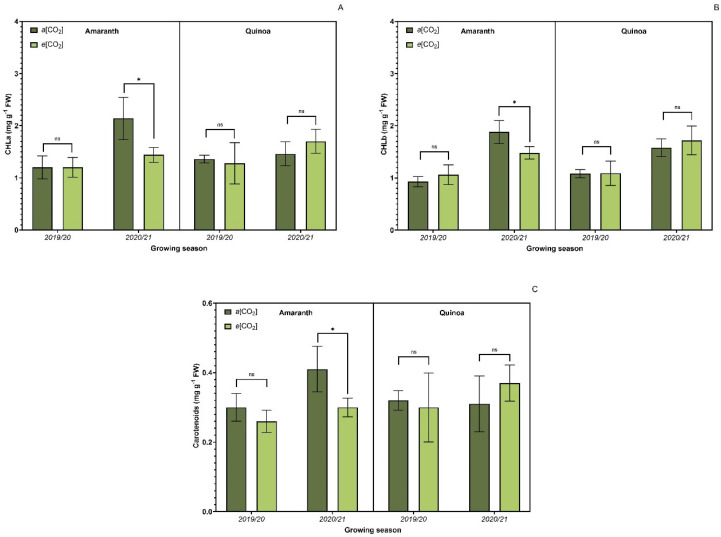
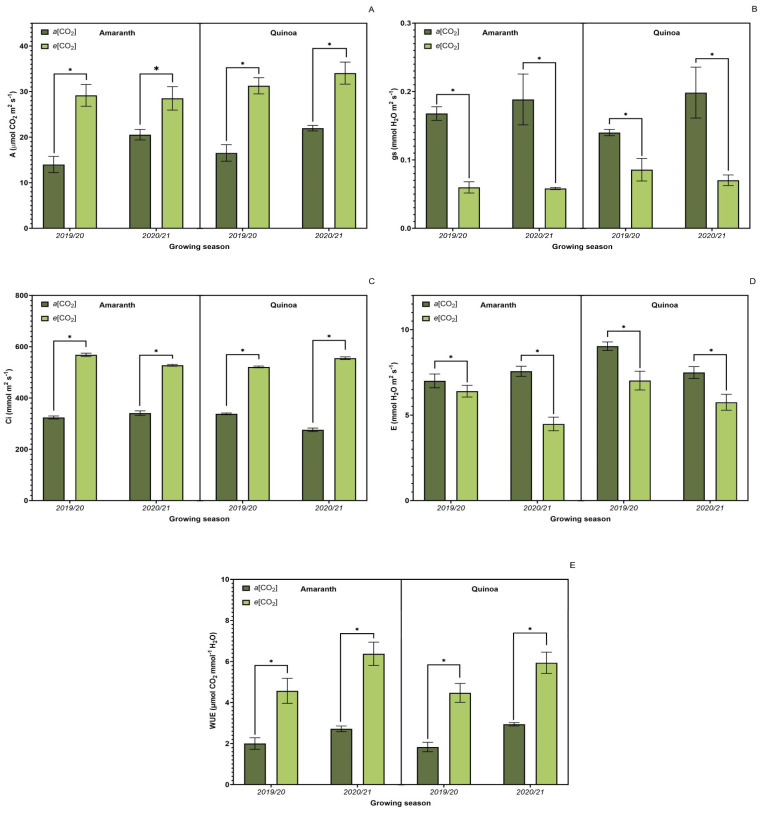
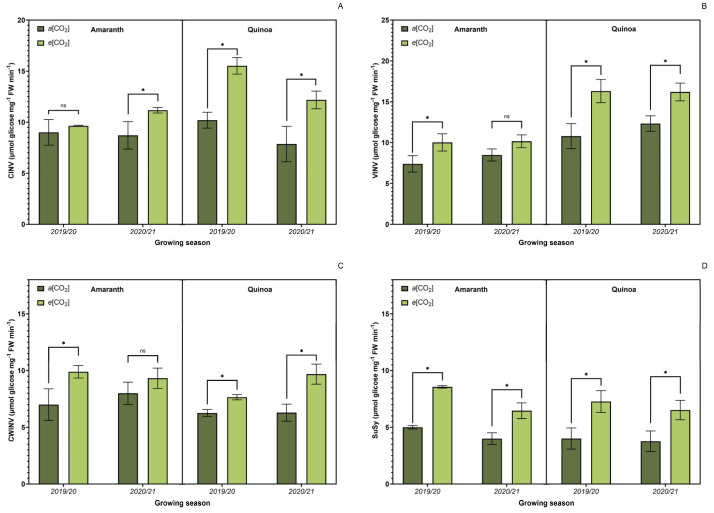
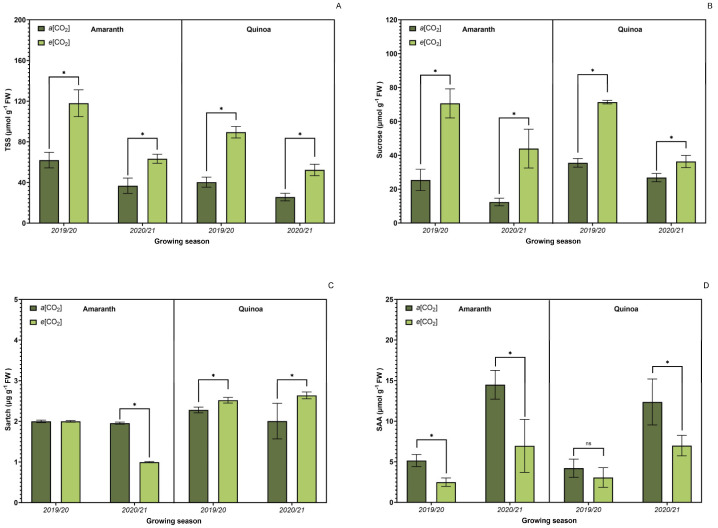
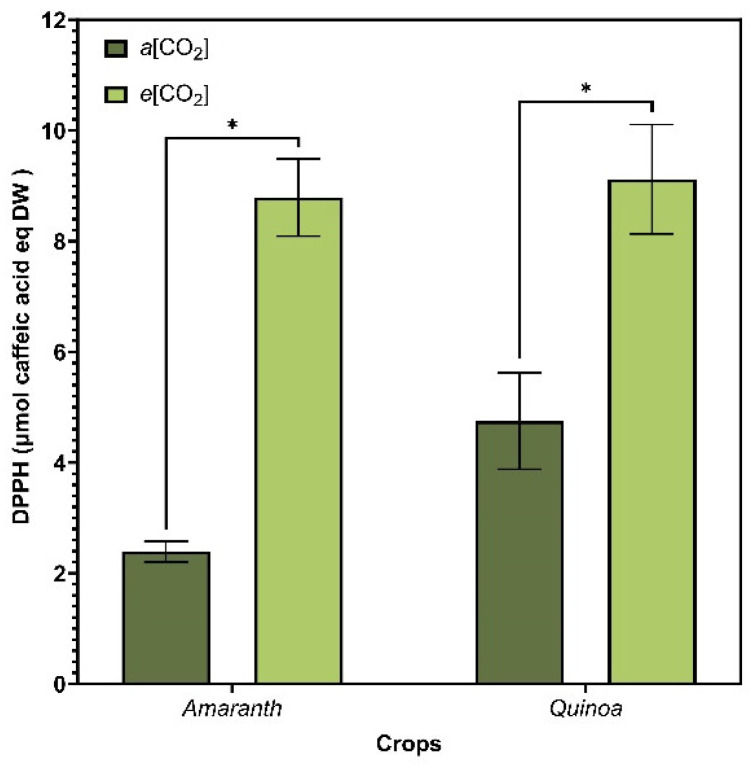
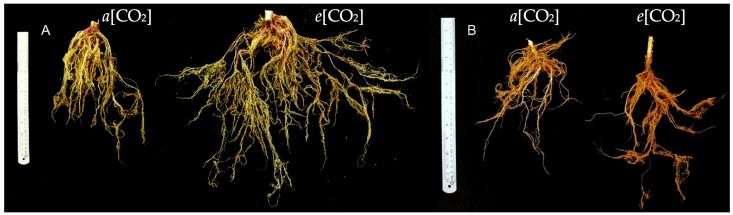
The present work aimed to investigate the effect of increasing CO2 concentration on the growth, productivity, grain quality, and biochemical changes in quinoa and amaranth plants. An experiment was conducted in open chambers (OTCs) to evaluate the responses of these species to different levels of CO2 {a[CO2] = 400 ± 50 μmol mol-1 CO2 for ambient CO2 concentration, e[CO2] = 700 ± 50 μmol mol-1 CO2 for the elevated CO2 concentration}. Growth parameters and photosynthetic pigments reflected changes in gas exchange, saccharolytic enzymes, and carbohydrate metabolism when plants were grown under e[CO2]. Furthermore, both species maintained most of the parameters related to gas exchange, demonstrating that the antioxidant system was efficient in supporting the primary metabolism of plants under e[CO2] conditions. Both species were taller and had longer roots and a greater dry weight of roots and shoots when under e[CO2]. On the other hand, the panicle was shorter under the same situation, indicating that the plants invested energy, nutrients, and all mechanisms in their growth to mitigate stress in expense of yield. This led to a reduction on panicle size and, ultimately, reducing quinoa grain yield. Although e[CO2] altered the plant's metabolic parameters for amaranth, the plants managed to maintain their development without affecting grain yield. Protein levels in grains were reduced in both species under e[CO2] in the average of two harvests. Therefore, for amaranth, the increase in CO2 mainly contributes to lowering the protein content of the grains. As for quinoa, its yield performance is also affected, in addition to its protein content. These findings provide new insights into how plants C3 (amaranth) and C4 (quinoa) respond to e[CO2], significantly increasing photosynthesis and its growth but ultimately reducing yield for quinoa and protein content in both species. This result ultimately underscore the critical need to breed plants that can adapt to e[CO2] as means to mitigate its negative effects and to ensure sustainable and nutritious crop production in future environmental conditions.

Keywords: Amaranthus spp.; Chenopodium quinoa (Willd); carbohydrate metabolism; climate change; photosynthetic parameters.


Conflict of interest statement

The authors declare no conflicts of interest.

Figures

Figure 1
Figure 1
Effect of CO2 on plant growth parameters. Shoot length (A); shoot dry matter (B); root length (C); root system dry matter (D) of amaranth and quinoa plants. a[CO2] = plants grown in OTC with 400 ± 50 μmol mol−1 CO2; e[CO2] = plants grown in OTC with 700 ± 50 μmol mol−1 CO2. The experiment was conducted during the 2019/2020 and 2020/2021 growing seasons. Error bars correspond to the 95% confidence interval of the mean. * Indicates significant difference between CO2 concentration (t test p ≤ 0.05, n = 10).
Figure 2
Figure 2
Effect of CO2 on growth parameters. Panicle length (A); number of branches per panicle (B); stem diameter (C); leaf area (D) of amaranth and quinoa plants. a[CO2] = plants grown in OTC with 400 ± 50 μmol mol−1 CO2; e[CO2] = plants grown in OTC with 700 ± 50 μmol mol−1 CO2. The experiment was conducted during the 2019/2020 and 2020/2021 growing seasons. Error bars correspond to the 95% confidence interval. * Indicates significant difference between CO2 concentration (t test p ≤ 0.05, n = 10).
Figure 3
Figure 3
Effect of CO2 concentration on photosynthetic pigments. Chlorophyll-a (CHLa) (A); chlorophyll-b (CHLb) (B); carotenoids (C) of amaranth and quinoa plants in transition stadium between vegetative and flowering. a[CO2] = plants grown in OTC with 400 ± 50 μmol mol−1 CO2; e[CO2] = plants grown in OTC with 700 ± 50 μmol mol−1 CO2. The experiment was conducted during the 2019/2020 and 2020/2021 growing seasons. Error bars correspond to the 95% confidence interval. * Indicates significant difference between CO2 concentration (t test p ≤ 0.05, n = 10). ns indicates non-significant differences (t test p ≤ 0.05, n = 10).
Figure 4
Figure 4
Effect of CO2 on leaf gas exchange. Net CO2 assimilation (A); stomatal conductance (B); internal concentration of CO2 (C); transpiration rate (D); water use efficiency (WUE) (E) of amaranth and quinoa plants in transition stadium between vegetative and flowering. a[CO2] = plants grown in OTC with 400 ± 50 μmol mol−1 CO2; e[CO2] = plants grown in OTC with 700 ± 50 μmol mol−1 CO2. The experiment was conducted during the 2019/2020 and 2020/2021 growing seasons. Error bars correspond to the 95% confidence interval. * Indicates significant difference between CO2 concentration (t test p ≤ 0.05, n = 10).
Figure 5
Figure 5
Effect of CO2 on sucrose metabolism-related enzyme activity in leaves: soluble neutral invertases of cytosol (CINV) (A); soluble acid invertases of the vacuole (VINV) (B); cell wall acid invertase (CWINV) (C); and sucrose synthase (SuSy) (D) activity. a[CO2] = plants grown in OTC with 400 ± 50 μmol mol−1 CO2; e[CO2] = plants grown in OTC with 700 ± 50 μmol mol−1 CO2. The experiment was conducted during the 2019/2020 and 2020/2021 growing seasons. Error bars correspond to the 95% confidence interval. *Indicates significant difference between CO2 concentration (t test p ≤ 0.05, n = 4). ns indicates non-significant.
Figure 6
Figure 6
Effect of CO2 on carbohydrate metabolism: total content of soluble sugars (A), sucrose-SUC (B), starch (C), and total soluble amino acids (D) on amaranth and quinoa leaves in transition stadium between vegetative and flowering. a[CO2] = plants grown in OTC with 400 ± 50 μmol mol−1 CO2; e[CO2] = plants grown in OTC with 700 ± 50 μmol mol−1 CO2. The experiment was conducted during the 2019/2020 and 2020/2021 growing seasons. Error bars correspond to the 95% confidence interval. * Indicates significant difference between CO2 concentration (t test p ≤ 0.05, n = 4). ns indicates non-significant.
Figure 7
Figure 7
Antioxidant capacity evaluated by DPPH from amaranth and quinoa in transition stadium between vegetative and flowering, grown in the presence of different CO2 concentrations (400 and 700 μmol mol−1 CO2). The extracts evaluated were obtained using the growing season 19/20 and 2020/2021. a[CO2] = plants grown in OTC with 400 ± 50 μmol mol−1 CO2; e[CO2] = plants grown in OTC with 700 ± 50 μmol mol−1 CO2. The experiment was conducted during the 2019/2020 and 2020/2021 growing seasons. Error bars correspond to the 95% confidence interval. * Indicates significant difference between CO2 concentration (t test p ≤ 0.05, n = 10).
Figure 8
Figure 8
Effects of CO2 concentration on roots of amaranth (A) and quinoa (B) collected after grain maturation. a[CO2] = plants grown in OTC with 400 ± 50 μmol mol−1 CO2; e[CO2] = plants grown in OTC with 700 ± 50 μmol mol−1 CO2.

Similar articles

References

    1. Hannah L. Climate Change Biology. 3rd ed. Academic Press; London, UK: 2021.
    1. IPCC . Climate Change: Impacts, Adaptation, and Vulnerability. IPCC; Geneva, Switzerland: 2022.
    1. Letcher T.M. Global warming-a complex situation. Clim. Change Obs. Impacts Planet Earth Third Ed. 2021:3–17. doi: 10.1016/B978-0-12-821575-3.00001-3. - DOI
    1. Leakey A.D.B., Ainsworth E.A., Bernacchi C.J., Rogers A., Long S.P., Ort D.R. Elevated CO2 effects on plant carbon, nitrogen, and water relations: Six important lessons from FACE. J. Exp. Bot. 2009;60:2859–2876. doi: 10.1093/jxb/erp096. - DOI - PubMed
    1. Kimball B.A. Crop responses to elevated CO2 and interactions with H2O, N, and temperature. Curr. Opin. Plant Biol. 2016;31:36–43. doi: 10.1016/j.pbi.2016.03.006. - DOI - PubMed

LinkOut - more resources