Dose-Response Associations Between Diet and Risk of Rheumatoid Arthritis: A Meta-Analysis of Prospective Cohort Studies
- PMID: 39683447
- PMCID: PMC11644016
- DOI: 10.3390/nu16234050
Dose-Response Associations Between Diet and Risk of Rheumatoid Arthritis: A Meta-Analysis of Prospective Cohort Studies
Abstract
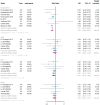
To provide a systematic and quantitative summary of dietary factors and rheumatoid arthritis (RA) risk. A systematic review and meta-analysis included prospective cohort studies from 2000 to 2024 reporting relative risks (RRs) with 95% confidence intervals (CIs) for RA incidence relating to 32 different dietary exposures. Linear and non-linear dose-response analyses were conducted. Thirty studies were included, involving 2,986,747 participants with 9,677 RA cases. Linear dose-response analysis suggested that each 2-unit per week increase in total alcohol intake was linked to 4% risk reduction (RR (95%-CI), heterogeneity (I2), NutriGrade score: 0.96 (0.94, 0.98), 58%, moderate certainty), and beer consumption was associated with a 10% reduction per 2 units/week increase (0.90 (0.84, 0.97), 0%, very low certainty). Each 2-unit/week increase in total alcohol intake was associated with a 3% decrease in seropositive RA risk (0.97 (0.96, 0.99), 28%, moderate certainty). Increased intakes of fruit (per 80 g/day) and cereals (per 30 g/day) were associated with 5% (0.95 (0.92, 0.99), 57%, moderate certainty) and 3% (0.97 (0.96, 0.99), 20%, moderate certainty) reduced risk, respectively. Conversely, tea consumption showed a 4% increased risk per additional cup/day (1.04 (1.02, 1.05), 0%, moderate certainty). Non-linear associations were observed for total coffee, vegetables, oily fish, and vitamin D supplementation. Data on dietary patterns and specific micronutrients were limited. The findings suggest that moderate alcohol consumption and a higher intake of fruits, oily fish, and cereals are associated with a reduced risk of RA, while tea and coffee may be linked to an increased risk. Optimising dietary intake of certain food components may reduce RA risk, despite moderate-quality evidence.
Keywords: diet; dose–response; meta-analysis; nutrient intake; rheumatoid arthritis.
Conflict of interest statement
The authors declare that they have no competing interests.
Figures


References
Publication types
MeSH terms
Substances
Grants and funding
LinkOut - more resources
Full Text Sources
Medical

