. 2024 Dec 1;16(23):4179.
doi: 10.3390/nu16234179.

Mechanisms Mediating Tart Cherry and Fish Oil Metabolic Effects in Diet-Induced (C57BL/6J) and Genetically (TALYHO/Jng) Obese Mice

Affiliations

Mechanisms Mediating Tart Cherry and Fish Oil Metabolic Effects in Diet-Induced (C57BL/6J) and Genetically (TALYHO/Jng) Obese Mice

Maryam Seifishahpar et al. Nutrients. .

Abstract

Background/objectives: Obesity is a major public health concern that increases the risk of chronic diseases. In obesity, adipose tissue undergoes remodeling, which is associated with chronic low-grade inflammation and disruption of its homeostatic mechanisms including endoplasmic reticulum (ER) function and autophagy. Fish oil (FO) and tart cherry (TC) have known anti-inflammatory properties. We hypothesized that while TC and FO individually decrease inflammation, their combined effects will be greater and will be either synergistic or additive in regulating inflammation and other adipose tissue functions.

Methods: Here, we conducted gene expression analyses, using qRT-PCR, on gonadal white adipose tissues from a previous study where male and female C57BL/6J (B6) and TALLYHO/Jng (TH) mice were fed low fat (LF), high fat (HF), or HF diets supplemented with TC, FO, or TC + FO for 14 weeks from weaning. Data was statistically analyzed by one or two-way ANOVA, using GraphPad Prism.

Results: HF diet increased adiposity and upregulated markers of inflammation, ER stress, and autophagy compared to the LF diet in both mouse models. While both TC and FO supplementation individually reduced the expression of inflammatory, ER stress, and autophagy markers on HF diet, their combination showed no consistent additive or synergistic effects.

Conclusions: Overall, our findings suggest that although TC and FO effectively mitigate inflammation in white adipose tissue, their combined use did not result in synergistic or additive effects of the two interventions.

Keywords: fish oil; inflammation; obesity; tart cherry; white adipose tissue.


Conflict of interest statement

The authors declare no conflicts of interest. The funders had no role in the design of the study; in the collection, analyses, or interpretation of data; in the writing of the manuscript; or in the decision to publish the results.

Figures

Figure 1
Figure 1
Study design.
Figure 2
Figure 2
Adiposity index. (a) Male and female C57BL/6J (B6), (b) male and female TALLYHO/Jng (TH) mice. Data are expressed as mean ± SEM. LF, low fat, HF, high fat. Different letters indicate significant differences between groups. p < 0.05; n = 6 mice per group.
Figure 3
Figure 3
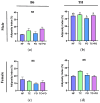
Adiposity index. (a,c) Male and female C57BL/6J (B6), (b,d) male and female TALLYHO/Jng (TH) mice. Data are expressed as mean ± SEM. HF, high fat (HF) diets and HF diets supplemented with tart cherry (TC), fish oil (FO), and their combination (TC + FO). Different letters indicate significant differences between groups. p < 0.05; n = 6 mice per group.
Figure 4
Figure 4
Expression of inflammation-related genes in white adipose tissue (WAT). WAT inflammatory marker genes include (a,e) interleukin 6 (Il6), (b,f) tumor necrosis factor alpha (Tnfα), (c,g) monocyte chemoattractant protein1 (Mcp1), and (d,h) toll-like receptor 4 (Tlr4). Data are expressed as mean ± SEM. LF, low fat, HF, high fat. Different letters indicate significant differences between groups. p < 0.05; n = 6 mice per group.
Figure 5
Figure 5
Expression of macrophage marker genes in white adipose tissue (WAT). M1 type markers include (a,d) Il1β, (b,e) Cd80, M2 type markers include (c,f) Arginase 1 (Arg1). Data are expressed as mean ± SEM. LF, low fat, HF, high fat. Different letters indicate significant differences between groups. p < 0.05; n = 6 mice per group.
Figure 6
Figure 6
Gene expression levels of (a,d,g,j) Mcp1, (b,e,h,k) Tlr4, (c,f,i,l) Il1β in WAT of mice fed high fat (HF) diets and HF diets supplemented with tart cherry (TC), fish oil (FO), and their combination (TC + FO). Group means labeled with different letters are significantly different p < 0.05; n = 6 mice per group.
Figure 7
Figure 7
Expression of fat metabolism genes in white adipose tissue (WAT). Fat metabolism markers include (a,d) Fatty Acid Synthase (Fasn), (b,e) Acetyl-CoA Carboxylase Alpha (Acaca), and (c,f) Carnitine Palmitoyl transferase 1 (Cpt1). Data are expressed as mean ± SEM. LF, low fat, HF, high fat. Different letters indicate significant differences between groups. p < 0.05; n = 6 mice per group.
Figure 8
Figure 8
Expression of ER stress-related genes in white adipose tissue (WAT). ER stress markers include (a,e) Total X-box-binding protein-1 (TXbp1), (b,f) Binding Immunoglobulin Protein (Bip), (c,g) C/EBP Homologous Protein (Chop) and (d,h) Activating Transcription Factor 4 (Atf4). Data are expressed as mean ± SEM. LF, low fat, HF, high fat. Different letters indicate significant differences between groups. p < 0.05; n = 6 mice per group.
Figure 9
Figure 9
Gene expression levels of (a,d,g,j) Bip, (b,e,h,k) Chop, (c,f,i,l) TXbp1 in WAT of mice fed high fat (HF) diets and HF diets supplemented with tart cherry (TC), fish oil (FO), and their combination (TC + FO). Different letters indicate significant differences between groups.
Figure 10
Figure 10
Expression of autophagy-related genes in white adipose tissue (WAT). Autophagy markers include (a,d) Autophagy Related Gene 5 (Atg5), (b,e) Autophagy Related Gene12 (Atg12), and (c,f) Beclin1. Data are expressed as mean ± SEM. LF, low fat, HF, high fat. Different letters indicate significant differences between groups. p < 0.05; n = 6 mice per group.
Figure 11
Figure 11
Gene expression levels of (a,d,g,j) Beclin1, (b,e,h,k) Atg5, (c,f,i,l) Atg12 in WAT of mice fed high fat (HF) diets and HF diets supplemented with tart cherry (TC), fish oil (FO), and their combination (TC + FO). Group means labeled with different letters are significantly different p < 0.05; n = 6 mice per group.

References

    1. Blüher M. Obesity: Global epidemiology and pathogenesis. Nat. Rev. Endocrinol. 2019;15:288–298. doi: 10.1038/s41574-019-0176-8. - DOI - PubMed
    1. Abdelaal M., le Roux C.W., Docherty N.G. Morbidity and mortality associated with obesity. Ann. Transl. Med. 2017;5:161. doi: 10.21037/atm.2017.03.107. - DOI - PMC - PubMed
    1. Pigeyre M., Yazdi F.T., Kaur Y., Meyre D. Recent progress in genetics, epigenetics and metagenomics unveils the pathophysiology of human obesity. Clin. Sci. 2016;130:943–986. doi: 10.1042/CS20160136. - DOI - PubMed
    1. Masood B., Moorthy M. Causes of obesity: A review. Clin. Med. 2023;23:284–291. doi: 10.7861/clinmed.2023-0168. - DOI - PMC - PubMed
    1. Hagberg C.E., Spalding K.L. White adipocyte dysfunction and obesity-associated pathologies in humans. Nat. Rev. Mol. Cell Biol. 2024;25:270–289. doi: 10.1038/s41580-023-00680-1. - DOI - PubMed