. 2024 Dec 4;16(23):4189.
doi: 10.3390/nu16234189.

An 8-Week Very Low-Calorie Ketogenic Diet (VLCKD) Alters the Landscape of Obese-Derived Small Extracellular Vesicles (sEVs), Redefining Hepatic Cell Phenotypes

Affiliations

An 8-Week Very Low-Calorie Ketogenic Diet (VLCKD) Alters the Landscape of Obese-Derived Small Extracellular Vesicles (sEVs), Redefining Hepatic Cell Phenotypes

Francesco Balestra et al. Nutrients. .

Abstract

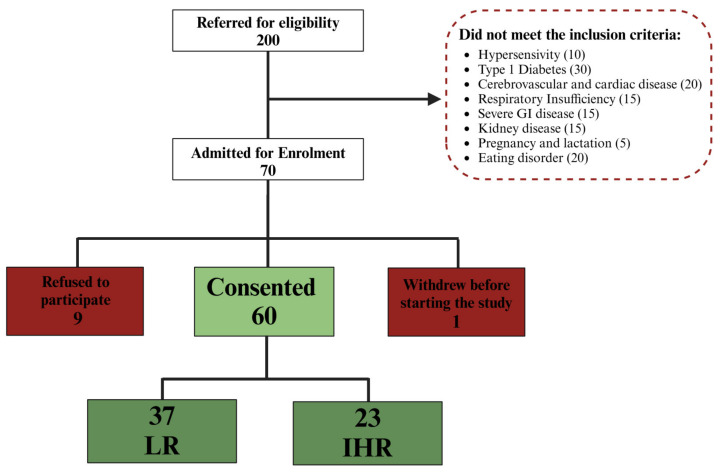
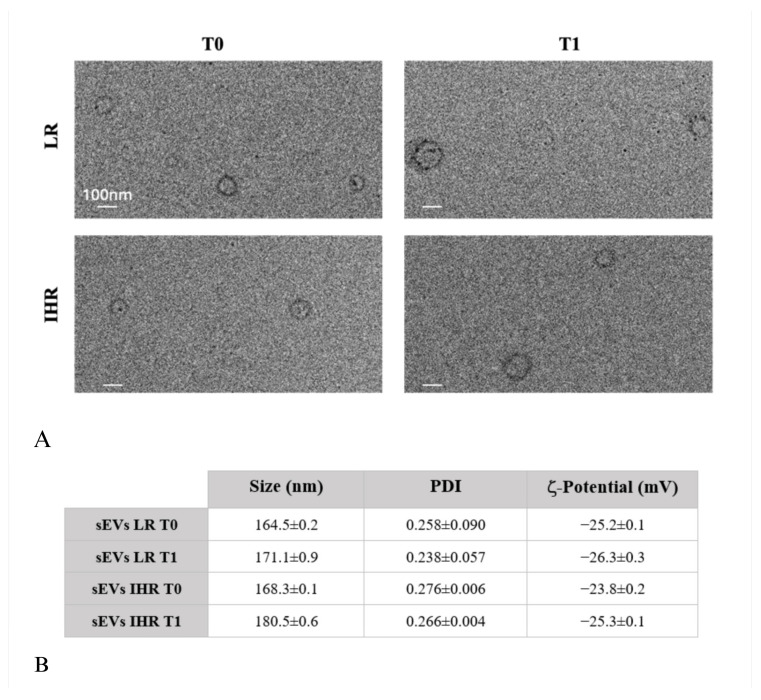
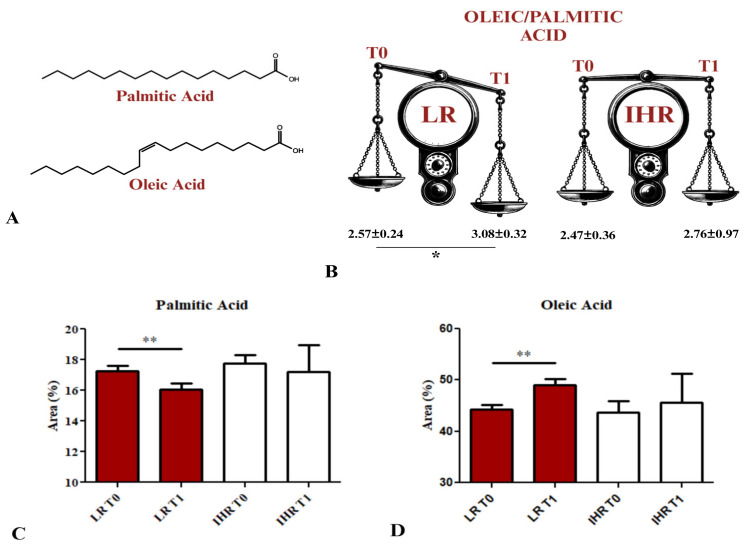
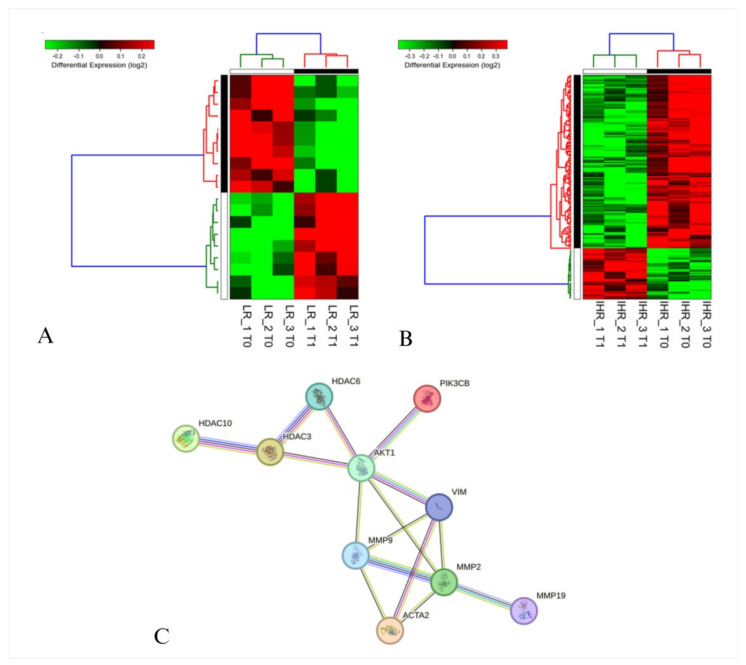
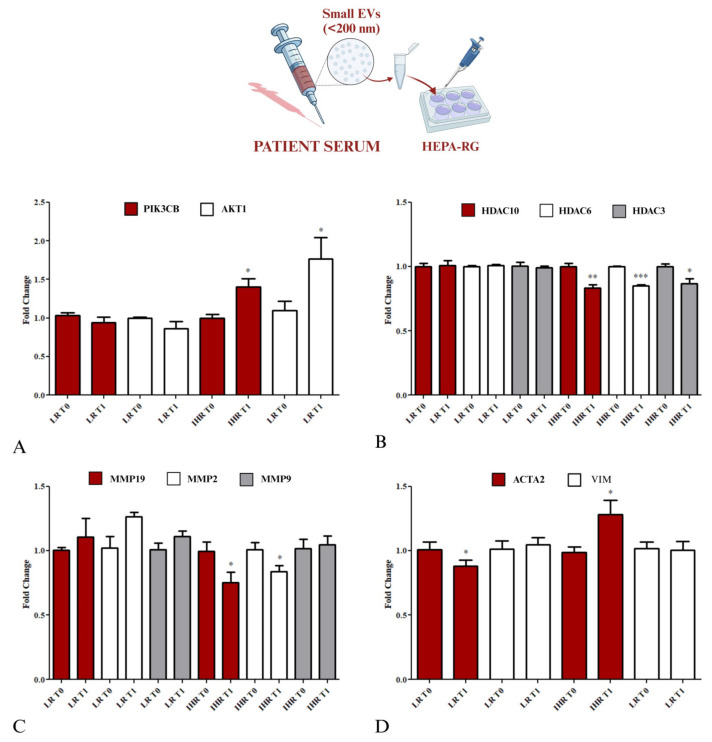
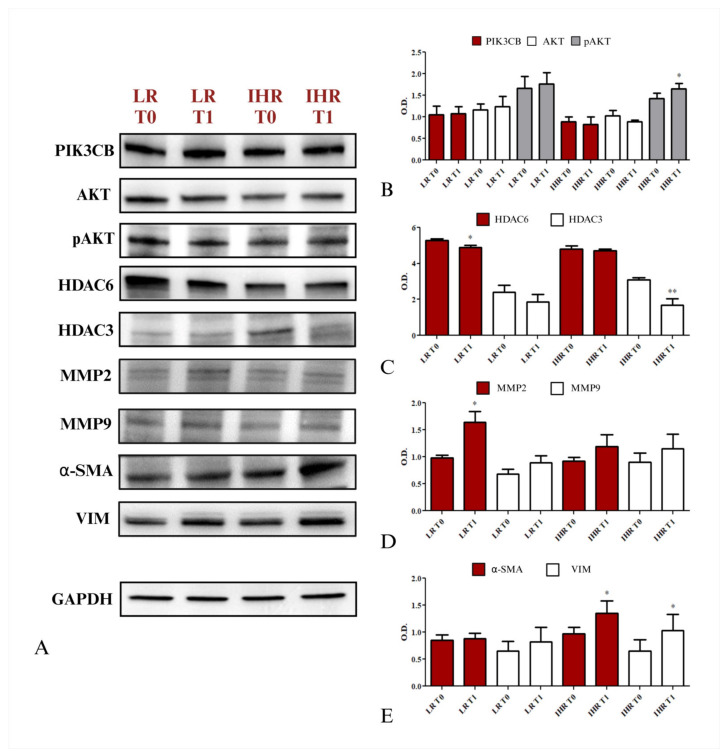
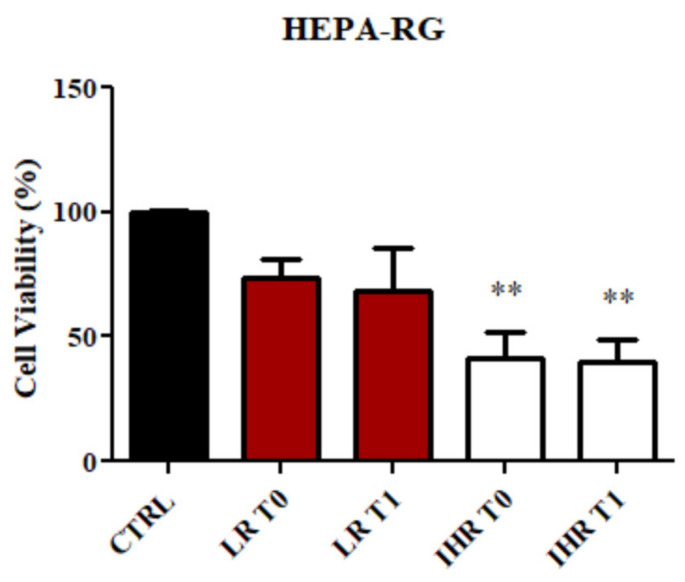
Background. Very low-calorie ketogenic diets (VLCKD) are an effective weight-loss strategy for obese individuals, reducing risks of liver conditions such as non-alcoholic steatohepatitis and fibrosis. Small extracellular vesicles (sEVs) are implicated in liver fibrosis by influencing hepatic cell phenotypes and contributing to liver damage. This study investigates sEVs derived from serum of 60 obese adults categorized into low fibrosis risk (LR) and intermediate/high fibrosis risk (IHR) groups based on FibroScan elastography (FIB E scores, limit value 8 kPa) and all participants underwent an 8-week VLCKD intervention. Methods. The study examines the impact of these sEVs on fibrosis markers, inflammation, and autophagy in a hepatocyte cell line (HEPA-RG) using bioinformatics, RNA sequencing, lipidomics, RT-PCR, and Western blotting before (T0) and after (T1) VLCKD. Results. sEVs from LR patients post-VLCKD reduced fibrosis related gene expression (e.g., ACTA2) and enhanced proteins associated with regeneration and inflammation (e.g., HDAC6). Conversely, sEVs from IHR patients increased fibrosis and inflammation related gene expression (PIK3CB, AKT1, ACTA2) in hepatocytes, raising concerns about VLCKD suitability for IHR patients. IHR sEVs also decreased expression of HDAC10, HDAC6, HDAC3, MMP19, and MMP2, while increasing modulation of p-AKT, α-SMA, and VIM. Conclusion. These findings underscore the critical role of sEVs in regulating inflammation, remodeling, and hepatic stress responses, particularly in IHR patients, and suggest sEVs could complement instrumental evaluations like FibroScan in fibrosis assessment.

Keywords: VLCKD; fibrosis; liver disease; obesity; small extracellular vesicles.


Conflict of interest statement

The authors declare no conflicts of interest.

Figures

Figure 1
Figure 1
Flow diagram of patients enrolment. Of 200 potential participants, 70 met the inclusion criteria. Of these, 9 declined to participate, and another 1 withdrew at the beginning after the start of the treatment. In the end, 60 patients, 37 patients were classified as LR and 23 as IHR, were enrolled and successfully completed the treatment.
Figure 2
Figure 2
sEVs were isolated from plasma of LR and IHR patients, prior to the dietary intervention (T0) and following 8 weeks of VLCKD (T1): TEM micrographs, scale bar 100 nm (A) and table reporting the intensity-weighted average hydrodynamic diameter and corresponding polydispersity index (PDI) obtained by DLS analysis, along with ζ-potential values (B).
Figure 3
Figure 3
Lipidomic evaluation. Chemical structures of palmitic and oleic acid (A). Comparison of oleic/palmitic acid ratio obtained by GC-FID chromatography of fatty acid extracted from cell membranes of HEPA-RG treated with sEVs from patients with LR and patients with IHR prior to the dietary intervention (T0) and following 8 weeks of VLCKD (T1) (B) (* p < 0.05). Area % of palmitic acid and oleic acid determined by GC-FID chromatography in cell membranes of HEPA-RG treated with sEVs from patients with LR and patients with IHR (C,D) (** p < 0.001).
Figure 4
Figure 4
Gene expression analysis of HEPA-RG after stimulation with patient-derived sEVs before (T0) and after (T1) treatment for 8 weeks of VLCKD, using samples from both LR (A) and IHR (B) patients. Each row represents a gene, while each column corresponds to a sample. Relative expression levels are depicted using a color-coded scale, with red indicating high expression and green indicating low expression, as shown in the scale provided at the top. An interaction network (C) was constructed using the Search Tool for the Retrieval of Interacting Genes/Proteins (STRING). In this network, nodes represent proteins, and edges indicate predicted functional associations based on seven distinct sources of evidence: fusion events, neighborhood relationships, co-occurrence, experimental data, text mining, database information, and co-expression patterns. The color scheme is as follows: light blue indicates curated databases; light pink denotes experimentally determined interactions; gray represents co-expression; yellow signifies gene neighborhood; orange indicates gene fusions; blue denotes gene co-occurrence; green represents text mining; and purple indicates protein homology.
Figure 5
Figure 5
Gene expression of PIK3CB, AKT1, HDAC10, HDAC6, HDAC3, MMP19, MMP2, MMP9, ACTA2, and VIM in HEPA–RG cells treated with serum-derived sEVs from obese patients after VLCKD for 8 weeks. Patients with LR and patients with IHR at T0 (before the VLCKD) and after 8 weeks of VLCKD (T1). For the HEPA-RG expression, the fold change values for PIK3CB and AKT1 are reported in (A). The fold change values for HDAC 10, HDAC 6, and HDAC 3 are reported in (B). The fold change values for MMP19, MMP9, and MMP3 are reported in (C). The fold change values for VIM and ACTA2 are reported in (D). (* p < 0.05, ** p < 0.001, and *** p < 0.0001 for T1 vs. T0).
Figure 6
Figure 6
Evaluation of proteins regulating hepatocyte degeneration and liver fibrosis was conducted in HEPA-RG cell lines treated with sEVs isolated from patients with LR and patients with IHR, both before (T0) and after (T1) 8 weeks of VLCKD. Representative Western blots of various proteins (PIK3CB, AKT, pAKT, HDAC3, HDAC6, α-SMA, and VIM) and the housekeeping protein GAPDH (A). A semi-quantitative evaluation of protein expression levels was performed using video-densitometry analysis of PIK3CB, AKT, and pAKT1 (B), HDAC6 and HDAC3 (C), MMP2 and MMP9 (D), and α-SMA and VIM (E) bands on the Western blots. The GAPDH protein band was used to normalize the protein bands for each subject. (* p < 0.05 and ** p < 0.001 for T1 vs. T0).
Figure 7
Figure 7
HEPA-RG cells line viability evaluation. Cell viability was evaluated by MTS assay, after incubation with sEVs derived from patients with LR and patients with IHR before (T0) and after (T1) 8 weeks of VLCKD. Negative controls were untreated cells (CTRL). (** p < 0.001 IHR vs. CTRL).

References

    1. Kramer J.R., Lin M., Feng H., Chayanupatkul M., Yu. X., Mapakshi S.R., Desiderio R., Li L., Thrift A.P., El-Serag H.B., et al. Absolute Risk of Hepatocellular Carcinoma in a Large, Geographically and Ethnically Diverse Cohort of Patients with Non-Alcholic Fatty Liver Disease. Gastroenterology. 2017;152:S683. doi: 10.1016/S0016-5085(17)32398-3. - DOI
    1. Caprio S., Perry R., Kursawe R. Adolescent Obesity and Insulin Resistance: Roles of Ectopic Fat Accumulation and Adipose Inflammation. Gastroenterology. 2017;152:1638–1646. doi: 10.1053/j.gastro.2016.12.051. - DOI - PMC - PubMed
    1. Marchesini G., Petta S., Dalle Grave R. Diet, Weight Loss, and Liver Health in Nonalcoholic Fatty Liver Disease: Pathophysiology, Evidence, and Practice. Hepatology. 2016;63:2032–2043. doi: 10.1002/hep.28392. - DOI - PubMed
    1. Younossi Z.M., Otgonsuren M., Henry L., Venkatesan C., Mishra A., Erario M., Hunt S. Association of Nonalcoholic Fatty Liver Disease (NAFLD) with Hepatocellular Carcinoma (HCC) in the United States from 2004 to 2009. Hepatology. 2015;62:1723–1730. doi: 10.1002/hep.28123. - DOI - PubMed
    1. Berzigotti A. Non-Invasive Assessment of Non-Alcoholic Fatty Liver Disease: Ultrasound and Transient Elastography. Rev. Recent. Clin. Trials. 2015;9:170–177. doi: 10.2174/1574887109666141216101630. - DOI - PubMed