. 2024 Dec 6;29(23):5773.
doi: 10.3390/molecules29235773.

Optimization of Combined Ultrasound and Microwave-Assisted Extraction for Enhanced Bioactive Compounds Recovery from Four Medicinal Plants: Oregano, Rosemary, Hypericum, and Chamomile

Affiliations

Optimization of Combined Ultrasound and Microwave-Assisted Extraction for Enhanced Bioactive Compounds Recovery from Four Medicinal Plants: Oregano, Rosemary, Hypericum, and Chamomile

Konstantina Theodora Laina et al. Molecules. .

Abstract

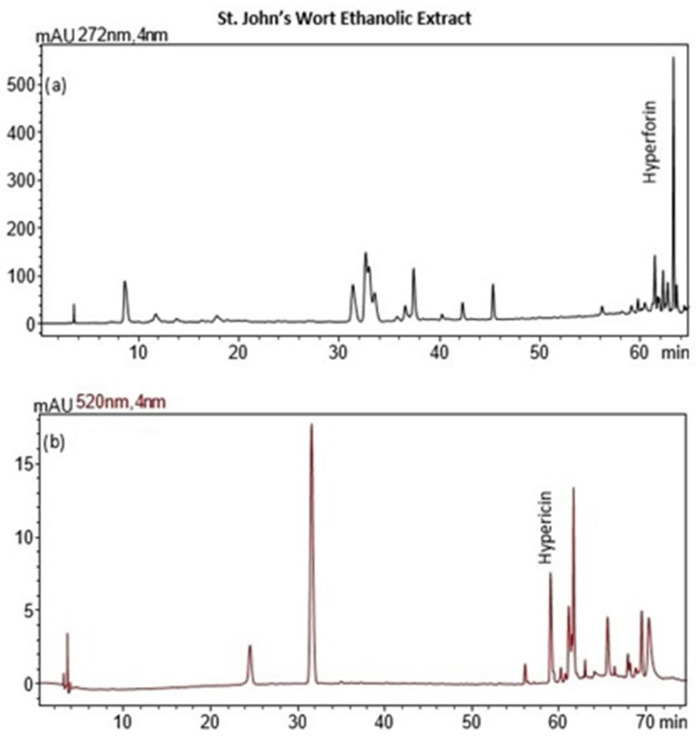
This study presents the synergistic application of ultrasound- and microwave-assisted extraction (UAE-MAE) as a novel and efficient method for recovering bioactive compounds from the medicinal plants oregano, rosemary, Hypericum perforatum, and chamomile. Extraction parameters, including microwave (MW) power, ultrasound (US) power, and extraction time, were optimized using the response surface methodology (RSM), with ethanol as the solvent. Extracts were evaluated for total phenolic content (TPC) via the Folin-Ciocalteu method and antioxidant activity (IC50) using the DPPH assay. High-performance liquid chromatography with diode array detection (HPLC-DAD) identified the main bioactive compounds contributing to their antioxidant and therapeutic potential. The optimized UAE-MAE conditions enhanced phenolic recovery and antioxidant potential across all plants. Notably, Hypericum perforatum exhibited the highest TPC (53.7 mg GAE/g) and strongest antioxidant activity (IC50 29.8 mg extract/g) under 200 W MW, 450 W US, and 12 min, yielding 14.5%. Rosemary achieved the highest yield (23.36%) with a TPC of 26.35 mg GAE/g and an IC50 of 40.75 mg extract/g at 200 W MW, 700 W US, and 8 min. Oregano's optimal conditions (500 W MW, 700 W US, 12 min) produced a TPC of 34.99 mg GAE/g and an IC50 of 50.31 mg extract/g. Chamomile extracts demonstrated lower phenolic content and antioxidant activity but achieved significant yields under 500 W MW, 700 W US, and 5 min. This study highlights UAE-MAE's superior efficiency, showcasing its potential to maximize phenolic recovery sustainably, making it a promising technique for industrial and therapeutic applications.

Keywords: antioxidant activity; bioactive compounds; extraction optimization; hypericum; medicinal plants; microwave-assisted extraction (MAE); oregano; phenolic compounds; rosemary; ultrasound-assisted extraction (UAE).


Conflict of interest statement

The authors declare no conflicts of interest.

Figures

Figure 1
Figure 1
Plots of predicted versus actual values for the Y (%) of oregano extracts.
Figure 2
Figure 2
Plots of predicted versus actual values for the IC50 (mg extract/g raw material) of UAE of oregano extracts.
Figure 3
Figure 3
Plots of predicted versus actual values for the TPC (mg GAE/g raw material) of oregano extracts.
Figure 4
Figure 4
Response surface and contour plots showing the effects of MW power, US power, extraction time on the extraction yield (%) of oregano extracts. (a) MW power vs. US power (extraction time: 8 min); (b) MW power vs. extraction time (US power: 450 W); (c) US power vs. extraction time (MW power: 200 W).
Figure 5
Figure 5
Response surface and contour plots showing the effects of MW power, US power, extraction time on IC50 (mg extract/g raw material) values of oregano extracts. (a) MW power vs. US power (extraction time: 8 min); (b) MW power vs. extraction time (US power: 450 W).
Figure 6
Figure 6
Response surface and contour plots showing the effects of MW power, US power, extraction time on TPC (mg GAE/g raw material) values of oregano extracts. (a) MW power vs. US power (extraction time: 8 min); (b) MW power vs. extraction time (US power: 450 W).
Figure 7
Figure 7
Plots of predicted versus actual values for the Y (%) of rosemary extracts.
Figure 8
Figure 8
Plots of predicted versus actual values for the IC50 (mg extract/g raw material) of UAE of rosemary extracts.
Figure 9
Figure 9
Plots of predicted versus actual values for the TPC (mg GAE/g raw material) of rosemary extracts.
Figure 10
Figure 10
Response surface and contour plots showing the effects of MW power, US power, extraction time on IC50 (mg extract/g raw material) values of rosemary extracts. (a) MW power vs. US power (extraction time: 8 min); (b) MW power vs. extraction time (US power: 450 W); (c) US power vs. extraction time (MW power: 200 W).
Figure 11
Figure 11
Response surface and contour plots showing the effects of MW power and US power on TPC (mg GAE/g raw material) values of rosemary extracts.
Figure 12
Figure 12
Plots of predicted versus actual values for the Y (%) of hypericum extracts.
Figure 13
Figure 13
Plots of predicted versus actual values for the IC50 (mg extract/g raw material) of UAE of hypericum extracts.
Figure 14
Figure 14
Plots of predicted versus actual values for the TPC (mg GAE/g raw material) of hypericum extracts.
Figure 15
Figure 15
Response surface and contour plots showing the effects of MW power and US power on the extraction yield (%) of hypericum extracts.
Figure 16
Figure 16
Response surface and contour plots showing the effects of MW power, US power, extraction time on IC50 (mg extract/g raw material) values of hypericum extracts. (a) MW power vs. US power (extraction time: 8 min); (b) MW power vs. extraction time (US power: 450 W); (c) US power vs. extraction time (MW power: 200 W).
Figure 17
Figure 17
Response surface and contour plots showing the effects of MW power and US power on TPC (mg GAE/g raw material) values of hypericum extracts.
Figure 18
Figure 18
Plots of predicted versus actual values for the Y (%) of chamomile extracts.
Figure 19
Figure 19
Plots of predicted versus actual values for the IC50 (mg extract/g raw material) of UAE of chamomile extracts.
Figure 20
Figure 20
Plots of predicted versus actual values for the TPC (mg GAE/g raw material) of chamomile extracts.
Figure 21
Figure 21
Response surface and contour plots showing the effects of MW power and US power on the extraction yield (%) of chamomile extracts.
Figure 22
Figure 22
Response surface and contour plots showing the effects of MW power, US power, extraction time on IC50 (mg extract/g raw material) values of chamomile extracts. (a) MW power vs. US power (extraction time: 8 min); (b) MW power vs. extraction time (US power: 450 W).
Figure 23
Figure 23
Response surface and contour plots showing the effects of MW power and US power on TPC (mg GAE/g raw material) values of chamomile extracts.
Figure 24
Figure 24
HPLC chromatograms of oregano extract recorded at 280 nm (for detection of rosmarinic acid and carvacrol).
Figure 25
Figure 25
HPLC chromatograms of rosemary extract recorded at 280 nm (for detection of rosmarinic acid, carnosol, and carnosic acid).
Figure 26
Figure 26
HPLC chromatograms of hypericum extract recorded at: (a) 272 nm (for detection of hyperforin), and (b) 520 nm (for detection of hypericin).
Figure 27
Figure 27
HPLC chromatogram of chamomile extract recorded at 360 nm (for detection of rutin and quercetin).

References

    1. Nasri H., Baradaran A., Shirzad H., Rafieian-Kopaei M. New concepts in nutraceuticals as alternative for pharmaceuticals. Int. J. Prev. Med. 2014;5:1487–1499. - PMC - PubMed
    1. Sorrenti V., Burò I., Consoli V., Vanella L. Recent Advances in Health Benefits of Bioactive Compounds from Food Wastes and By-Products: Biochemical Aspects. Int. J. Mol. Sci. 2023;24:2019. doi: 10.3390/ijms24032019. - DOI - PMC - PubMed
    1. da Costa J.P. A current look at nutraceuticals—Key concepts and future prospects. Trends Food Sci. Technol. 2017;62:68–78. doi: 10.1016/j.tifs.2017.02.010. - DOI
    1. Marrelli M. Medicinal Plants. Plants. 2021;10:1355. doi: 10.3390/plants10071355. - DOI - PMC - PubMed
    1. Riaz M., Khalid R., Afzal M., Anjum F., Fatima H., Zia S., Rasool G., Egbuna C., Mtewa A.G., Uche C.Z., et al. Phytobioactive compounds as therapeutic agents for human diseases: A review. Food Sci. Nutr. 2023;11:2500–2529. doi: 10.1002/fsn3.3308. - DOI - PMC - PubMed

MeSH terms

LinkOut - more resources