. 2024 Nov 21;25(23):12515.
doi: 10.3390/ijms252312515.

Umbilical Cord Mesenchymal Stem Cell Secretome: A Potential Regulator of B Cells in Systemic Lupus Erythematosus

Affiliations

Umbilical Cord Mesenchymal Stem Cell Secretome: A Potential Regulator of B Cells in Systemic Lupus Erythematosus

Adelina Yordanova et al. Int J Mol Sci. .

Abstract

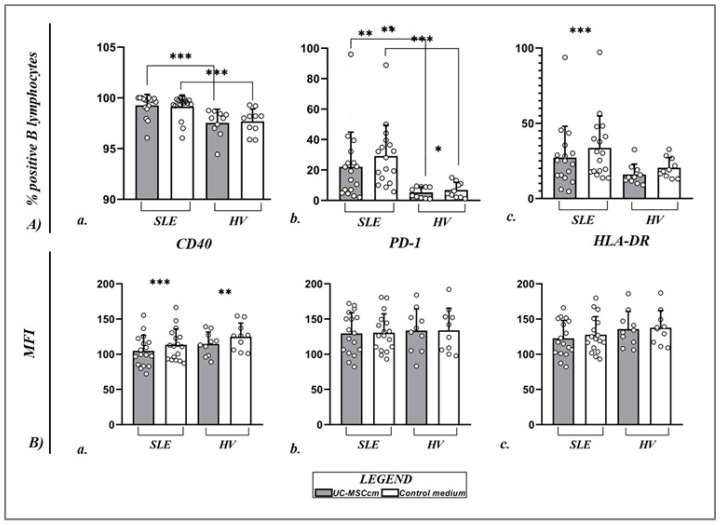
Autoimmune diseases represent a severe personal and healthcare problem that seeks novel therapeutic solutions. Mesenchymal stem cells (MSCs) are multipotent cells with interesting cell biology and promising therapeutic potential. The immunoregulatory effects of secretory factors produced by umbilical cord mesenchymal stem cells (UC-MSCs) were assessed on B lymphocytes from 17 patients with systemic lupus erythematosus (SLE), as defined by the 2019 European Alliance of Associations for Rheumatology (EULAR)/American College of Rheumatology (ACR) classification criteria for SLE, and 10 healthy volunteers (HVs). Peripheral blood mononuclear cells (PBMCs) from patients and HVs were cultured in a UC-MSC-conditioned medium (UC-MSCcm) and a control medium. Flow cytometry was used to detect the surface expression of CD80, CD86, BR3, CD40, PD-1, and HLA-DR on CD19+ B cells and assess the percentage of B cells in early and late apoptosis. An enzyme-linked immunosorbent assay (ELISA) quantified the production of BAFF, IDO, and PGE2 in PBMCs and UC-MSCs. Under UC-MSCcm influence, the percentage and mean fluorescence intensity (MFI) of CD19+BR3+ cells were reduced in both SLE patients and HVs. Regarding the effects of the MSC secretome on B cells in lupus patients, we observed a decrease in CD40 MFI and a reduced percentage of CD19+PD-1+ and CD19+HLA-DR+ cells. In contrast, in the B cells of healthy participants, we found an increased percentage of CD19+CD80+ cells and decreased CD80 MFI, along with a decrease in CD40 MFI and the percentage of CD19+PD-1+ cells. The UC-MSCcm had a minimal effect on B-cell apoptosis. The incubation of patients' PBMCs with the UC-MSCcm increased PGE2 levels compared to the control medium. This study provides new insights into the impact of the MSC secretome on the key molecules involved in B-cell activation and antigen presentation and survival, potentially guiding the development of future SLE treatments.

Keywords: B lymphocytes; B-cell activating factor receptor; mesenchymal stem cells; systemic lupus erythematosus.


Conflict of interest statement

The authors declare no conflicts of interest.

Figures

Figure 1
Figure 1
Characterization of the isolated umbilical cord mesenchymal stem cells (UC-MSCs). MSCs isolated from the umbilical cord on day 1 (A) show visible fibroblast-like morphology (400×, phase contrast). After reaching 80% confluency (B), the conditioned medium was successfully received (400×, phase contrast). Flow cytometric histograms representing the expression of markers CD90, CD73, and CD105, as well as the absence of markers characteristic of hematopoietic lineage, are shown (C) together with light microscopic photo (100×) that shows the degree of confluency (100%) of the cells at which the analysis was performed (D). The graph represents the mean values of the percentages (Mean ± SD) for each marker examined (data are mean of seven experiments) (E). Representative light microscopic images of adipogenic (F) and osteogenic (Von Kossa staining (G) and Alizarin red S staining (H)) differentiated cells are shown. Lowercase letters on the microscopic images represent cells cultured in adipogenic differentiation medium ((a) (400×)), osteogenic differentiation medium ((c,e) (50×)), and in control medium ((b,d,f) (50×)).
Figure 2
Figure 2
Phase contrast images (100×) of systemic lupus erythematosus (SLE) patients’ peripheral blood mononuclear cells (PBMCs) after 72 h of culture. (A) PBMCs, cultured in a control medium and (B) PBMCs cultured in a conditioned medium of umbilical cord MSCs (UC-MSCcm), with a significantly higher degree of cell cluster formation.
Figure 3
Figure 3
Scatter plots displaying the changes in percentage values (A) of CD19+CD80+ B cells ((A)(a)), CD19+CD86+ B cells ((A)(b)), and CD19+CD268+ (BR3) B cells ((A)(c)) and MFI (B) of CD80 ((B)(a)), CD86 ((B)(b)), and CD268 ((B)(c)) on the membrane of B lymphocytes of SLE patients (n = 17) and healthy volunteers (HVs) (n = 10). Data are expressed as mean ± SD, and significant differences are presented after performing the Wilcoxon signed-rank test and Mann–Whitney U test (** p ≤ 0.01; **** p ≤ 0.0001).
Figure 4
Figure 4
Flow cytometric dot plots of CD19+ B lymphocytes expressing the BR3 receptor from the pool of PBMCs cultured in (A) control medium and (B) UC-MSCcm. The red represents the formation of a homogeneous population of B lymphocytes with reduced expression of the BR3 receptor, influenced by the secretome of MSCs. A representative patient with SLE is shown in the figure.
Figure 5
Figure 5
Scatter plots displaying the changes in percentage values (A) of CD19+CD40+ B cells ((A)(a)), CD19+CD279 (PD-1)+ B cells ((A)(b)), and CD19+HLA-DR+ B cells ((A)(c)) and MFI (B) of CD40 ((B)(a)), PD-1 ((B)(b)), and HLA-DR ((B)(c)) on the membrane of B lymphocytes of SLE patients (n = 17) and HVs (n = 10). Data are expressed as mean ± SD, and significant differences are presented after performing Wilcoxon test and Mann–Whitney U test (* p ≤ 0.05; ** p ≤ 0.01; *** p ≤ 0.001). Black lines represent significant differences between the two groups of participants.
Figure 6
Figure 6
Scatter plots display the percentage value alterations of CD19+Annexin V+ cells (A) and CD19+PI+ cells (B). Data are expressed as mean ± SD, and significant differences are presented after performing Wilcoxon sign-rank test (** p ≤ 0.01; *** p ≤ 0.001).
Figure 7
Figure 7
A scatter plot displays the changes in PGE2 levels (pg/mL) after culturing PBMCs in a UC-MSCcm and control medium. Data are expressed as mean ± SD, and significant differences are presented using Wilcoxon sign-rank test (* p ≤ 0.05).

Similar articles

Cited by

References

    1. Siegel C.H., Sammaritano L.R. Systemic lupus erythematosus. JAMA. 2024;331:1480. doi: 10.1001/jama.2024.2315. - DOI - PubMed
    1. Horowitz D.L., Furie R. Belimumab is approved by the FDA: What more do we need to know to optimize decision making? Curr. Rheumatol. Rep. 2012;14:318–323. doi: 10.1007/s11926-012-0256-4. - DOI - PubMed
    1. Burki T.K. FDA approval for anifrolumab in patients with lupus. Lancet Rheumatol. 2021;3:e689. doi: 10.1016/S2665-9913(21)00291-5. - DOI
    1. Smulski C.R., Eibel H. BAFF and BAFF-Receptor in B cell selection and survival. Front. Immunol. 2018;9:2285. doi: 10.3389/fimmu.2018.02285. - DOI - PMC - PubMed
    1. Moisini I., Davidson A. BAFF: A local and systemic target in autoimmune diseases. Clin. Exp. Immunol. 2009;158:155–163. doi: 10.1111/j.1365-2249.2009.04007.x. - DOI - PMC - PubMed

MeSH terms

Substances

LinkOut - more resources