. 2024 Nov 22;25(23):12553.
doi: 10.3390/ijms252312553.

Effect of Long-Term Cisplatin Exposure on the Proliferative Potential of Immortalized Renal Progenitor Cells

Affiliations

Effect of Long-Term Cisplatin Exposure on the Proliferative Potential of Immortalized Renal Progenitor Cells

Eloho Ighofose et al. Int J Mol Sci. .

Abstract

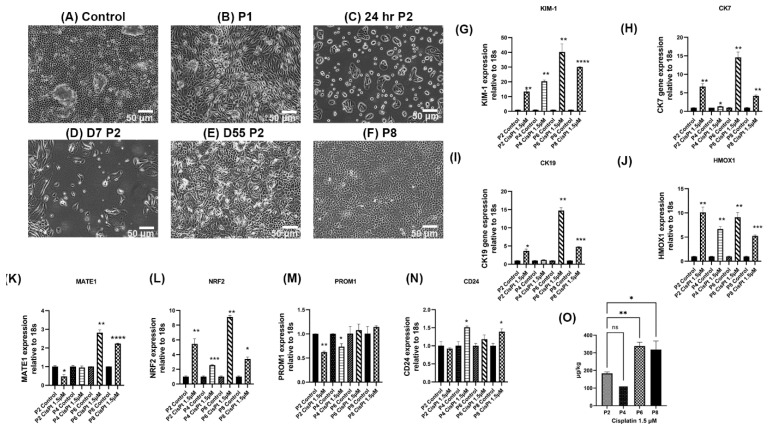
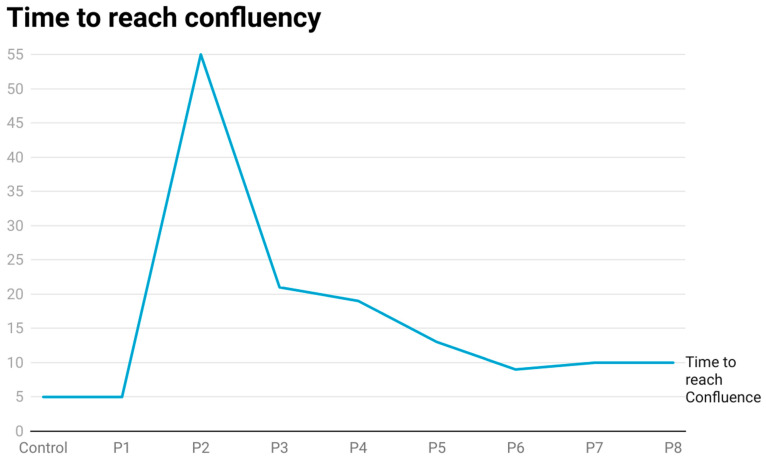
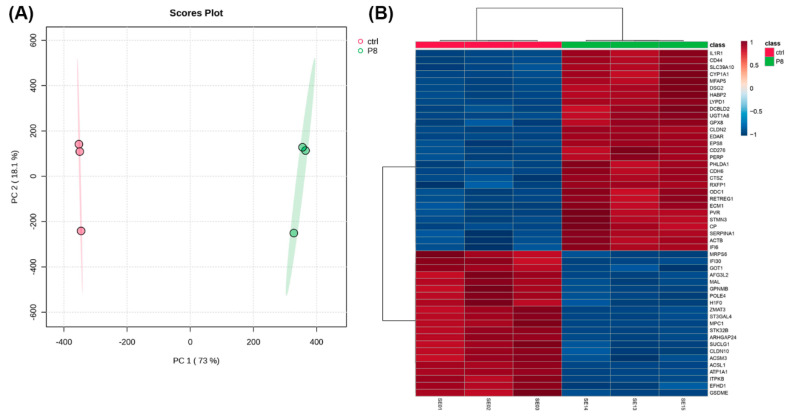
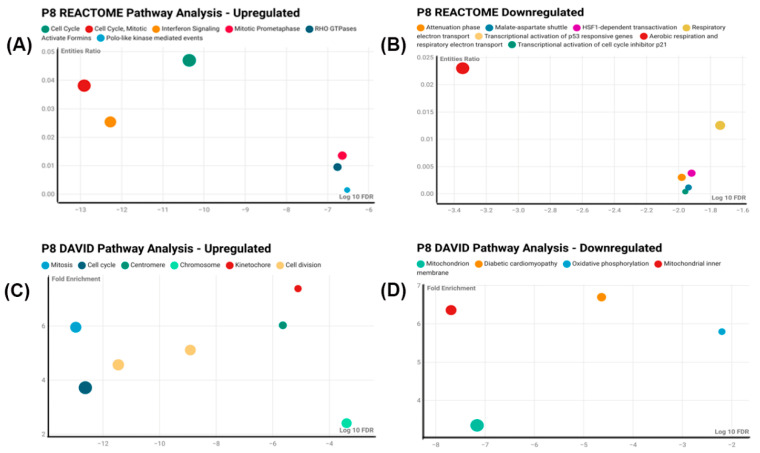
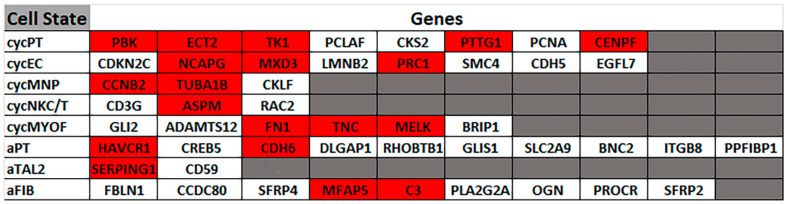
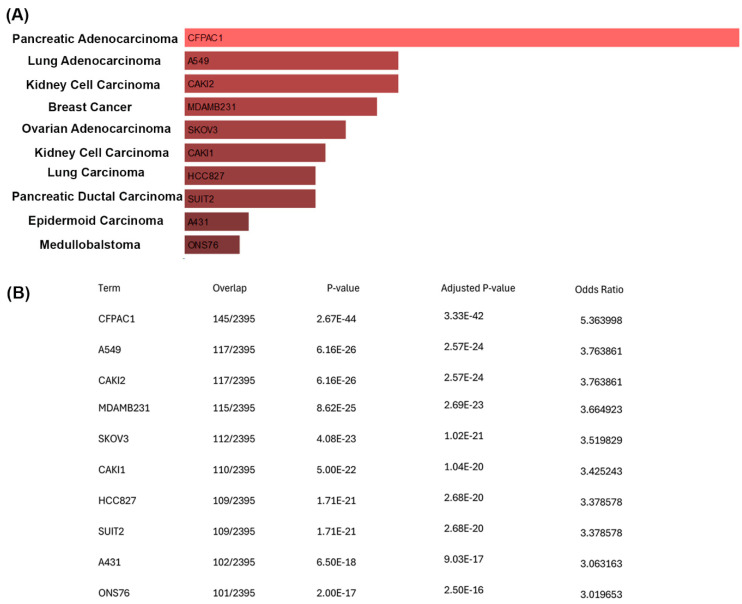
Cisplatin (CisPt) is a widely used chemotherapeutic agent. However, its nephrotoxic effects pose significant risks, particularly for the development of acute kidney injury (AKI) and potential progression to chronic kidney disease (CKD). The present study investigates the impact of non-lethal exposure of CisPt to immortalized human renal epithelial precursor TERT cells (HRTPT cells) that co-express PROM1 and CD24, markers characteristic of renal progenitor cells. Over eight serial passages, HRTPT cells were exposed to 1.5 µM CisPt, leading to an initial growth arrest, followed by a gradual recovery of proliferative capacity. Despite maintaining intracellular platinum (Pt) levels, the cells exhibited normal morphology by passage eight (P8), with elevated expression of renal stress and damage markers. However, the ability to form domes was not restored. RNA-seq analysis revealed 516 differentially expressed genes between CisPt-exposed and control cells, with significant correlations to cell cycle and adaptive processes, as determined by the Reactome, DAVID, and Panther analysis programs. The progenitor cells treated with CisPt displayed no identity, or close identity, with cells of the normal human nephron. Additionally, several upregulated genes in P8 cells were linked to cancer cell lines, suggesting a complex interaction between CisPt exposure and cellular repair mechanisms. In conclusion, our study demonstrates that renal progenitor cells can recover from CisPt exposure and regain proliferative potential in the continued presence of both extracellular CisPt and intracellular Pt.

Keywords: HRTPT; cell cycle; cisplatin; proximal tubule; renal progenitor cells.


Conflict of interest statement

The authors declare no conflicts of interest.

Figures

Figure 1
Figure 1
Long-term exposure of HRTPT to 1.5 µM CisPt. Confluent cultures of HRTPT cells were cultured in the presence of 1.5 µM CisPt for eight serial passages. (AF) Morphology of the HRTPT cells as visualized by light microscopy. (A) Morphology of control cells. (B) Morphology of confluent cells at P1. (C) Morphology of HRTPT cells treated with 1.5 µM CisPt at P2 after 24 h. (D) Morphology of HRTPT cells treated with 1.5 µM CisPt at P2 after seven days. (E) Morphology of confluent HRTPT cells treated with 1.5 µM CisPt at P2 (D55). (F) Morphology of confluent HRTPT cells treated with 1.5 µM CisPt at P8. (GN) Real-time qPCR analysis of the expression of KIM-1 (G), CK-7 (H), CK19 (I), HMOX1 (J), MATE1 (K), NRF2 (L), PROM1 (M), and CD24 (N). (O) Accumulation of Pt in HRTPT cells cultured in the presence of 1.5 µM CisPt for eight serial passages. ****; ***; **; * indicate significant differences in gene expression level compared to the control at p-value of ≤0.0001; ≤0.001; ≤0.01; ≤0.05, ns: p > 0.05, respectively. (O) Accumulation of Pt in HRTPT cells cultured in the presence of 1.5 µM CisPt for eight serial passages.
Figure 2
Figure 2
Time to reach confluency for cells treated with cisplatin.
Figure 3
Figure 3
Heatmap and PCA analysis of HRTPT cells exposed to 1.5 µM cisplatin. (A) The PCA score plot displays the results of a principal component analysis (PCA) performed on the RNA sequencing dataset. The plot shows the distribution of different samples across the first two principal components, which account for 73% and 18.1% of the variance, respectively. Labels on the points denote individual sample IDs. (B) Heatmap of average gene expression for the top 50 differentially expressed genes identified through ANOVA analysis for the different passage conditions. The color bar shows the average expression level.
Figure 4
Figure 4
Pathway analysis with DAVID and REACTOME: The scatter plot displays pathways upregulated and downregulated at P8 as analyzed using DAVID and REACTOME. The vertical axis represents the fold enrichment/entities ratio, while the horizontal axis shows the -Log10 false discovery rate (FDR). Each bubble corresponds to a specific pathway, with the size of the bubble indicating the count of genes involved in that pathway. Larger bubbles represent pathways with a greater number of associated genes.
Figure 5
Figure 5
CisPt-treated HRTPT kidney progenitor cells upregulate genes associated with cycling and adaptive/maladaptive/repair states. Clustergram showing the correlation of the upregulated genes in progenitor cells treated with CisPt P8 with known gene markers of various kidney cell types identified in acutely and chronically injured human kidneys, including, cycling proximal tubular cells (cycPT), cycling mononuclear polymorph cells (cycMNP), cycling endothelial cells (cycEC), cycling natural killer and T cells (cycNKC/T), cyclic myofibroblast (cycMYOF), adaptive proximal tubular cells (aPT), adaptive thick ascending limb cells (aTAL2), and adaptive fibroblasts (aFIB). The cell states are arranged in the first column and genes are arranged in rows with the positively corelated genes in red color. The genes that do not correlate are indicated by the white color.
Figure 6
Figure 6
Chronic CisPt treatment in progenitor cells upregulates genes enriched in cancer cells. (A) Bar graph demonstrating the correlation between differentially expressed genes in CisPt-treated progenitor cells at P8 and cancer cells identified in ARCHS4 cell line datasets. The length of each bar represents the significance of a specific gene set. Additionally, the brighter the color, the more significant the gene set is. (B) A raw data table showing the ratio of differentially expressed genes in CisPt-treated progenitor cells that overlap with the enriched genes of each cancer cell line identified in the ARCHS4 dataset, along with the p-value, adjusted p-value, and odds ratio.

Similar articles

References

    1. Aldossary S.A. Review on Pharmacology of Cisplatin: Clinical Use, Toxicity and Mechanism of Resistance of Cisplatin. Biomed. Pharmacol. J. 2019;12:7–15. doi: 10.13005/bpj/1608. - DOI
    1. Florea A.-M., Büsselberg D. Cisplatin as an Anti-Tumor Drug: Cellular Mechanisms of Activity, Drug Resistance and Induced Side Effects. Cancers. 2011;3:1351–1371. doi: 10.3390/cancers3011351. - DOI - PMC - PubMed
    1. Bucher-Johannessen C., Page C.M., Haugen T.B., Wojewodzic M.W., Fosså S.D., Grotmol T., Haugnes H.S., Rounge T.B. Cisplatin treatment of testicular cancer patients introduces long-term changes in the epigenome. Clin. Epigenet. 2019;11:179. doi: 10.1186/s13148-019-0764-4. - DOI - PMC - PubMed
    1. Miller R.P., Tadagavadi R.K., Ramesh G., Reeves W.B. Mechanisms of Cisplatin Nephrotoxicity. Toxins. 2010;2:2490–2518. doi: 10.3390/toxins2112490. - DOI - PMC - PubMed
    1. McSweeney K.R., Gadanec L.K., Qaradakhi T., Ali B.A., Zulli A., Apostolopoulos V. Mechanisms of Cisplatin-Induced Acute Kidney Injury: Pathological Mechanisms, Pharmacological Interventions, and Genetic Mitigations. Cancers. 2021;13:1572. doi: 10.3390/cancers13071572. - DOI - PMC - PubMed

LinkOut - more resources