. 2024 Nov 23;25(23):12593.
doi: 10.3390/ijms252312593.

Rhamnolipid-Enriched PA3 Fraction from Pseudomonas aeruginosa SWUC02 Primes Chili Plant Defense Against Anthracnose

Affiliations

Rhamnolipid-Enriched PA3 Fraction from Pseudomonas aeruginosa SWUC02 Primes Chili Plant Defense Against Anthracnose

Natthida Sudyoung et al. Int J Mol Sci. .

Abstract

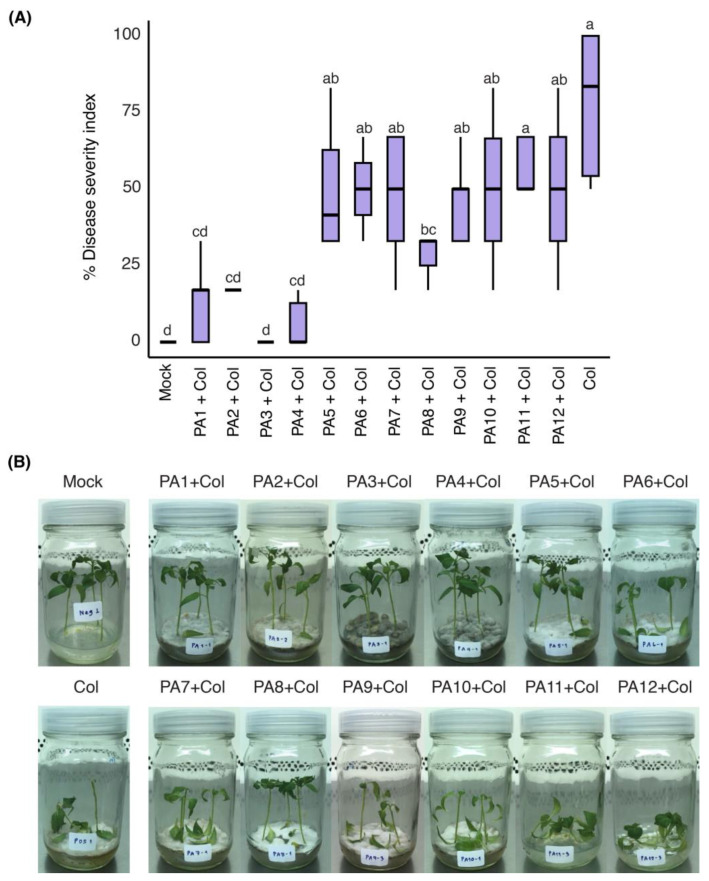
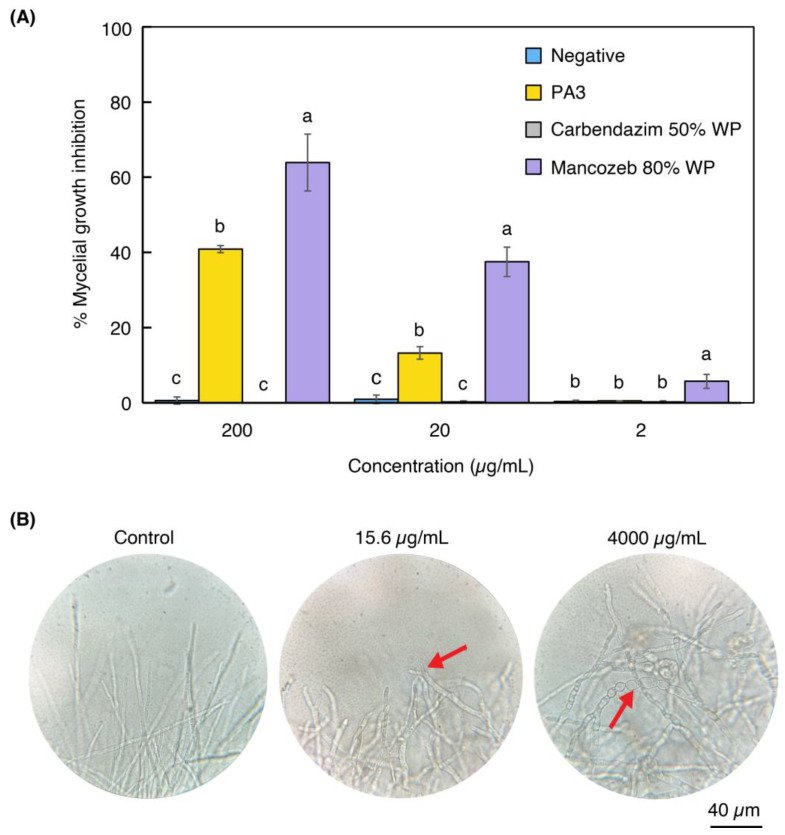
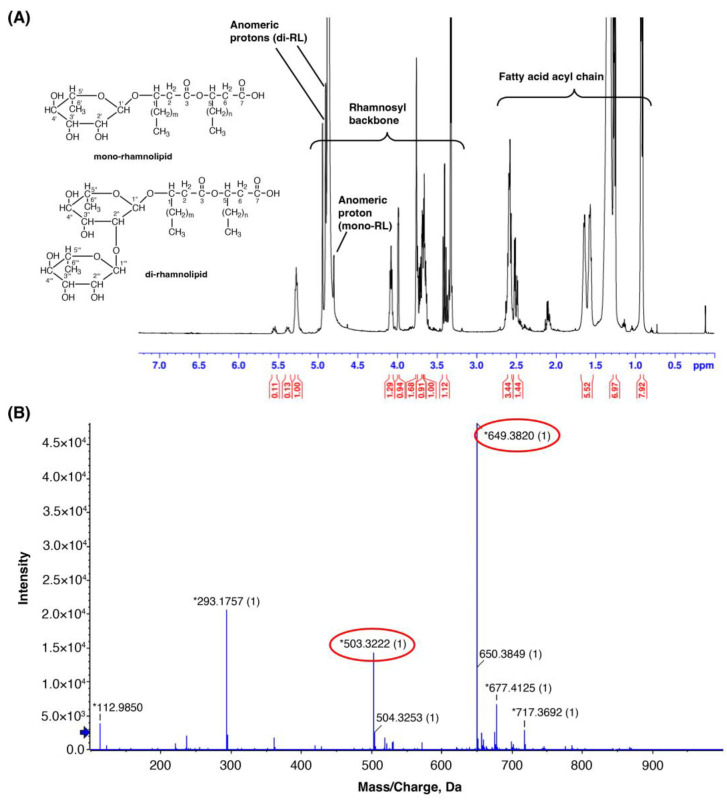
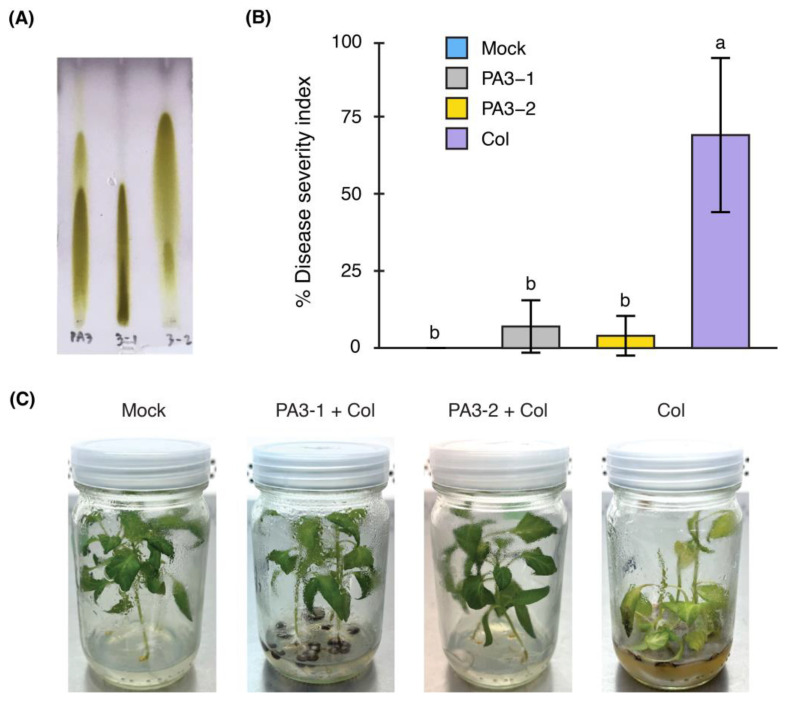
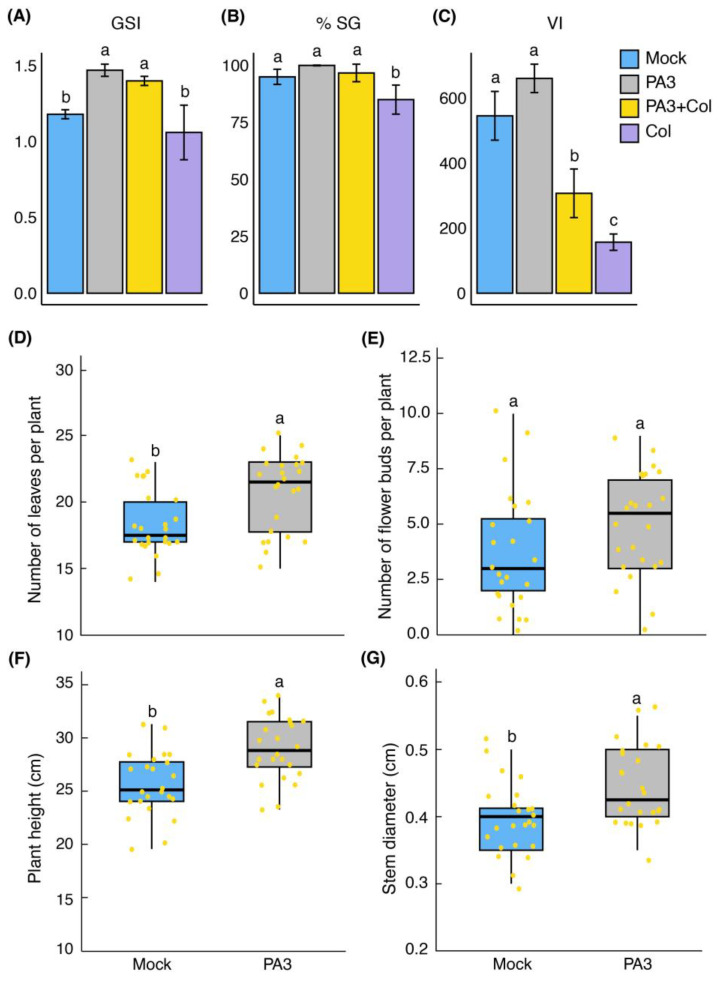
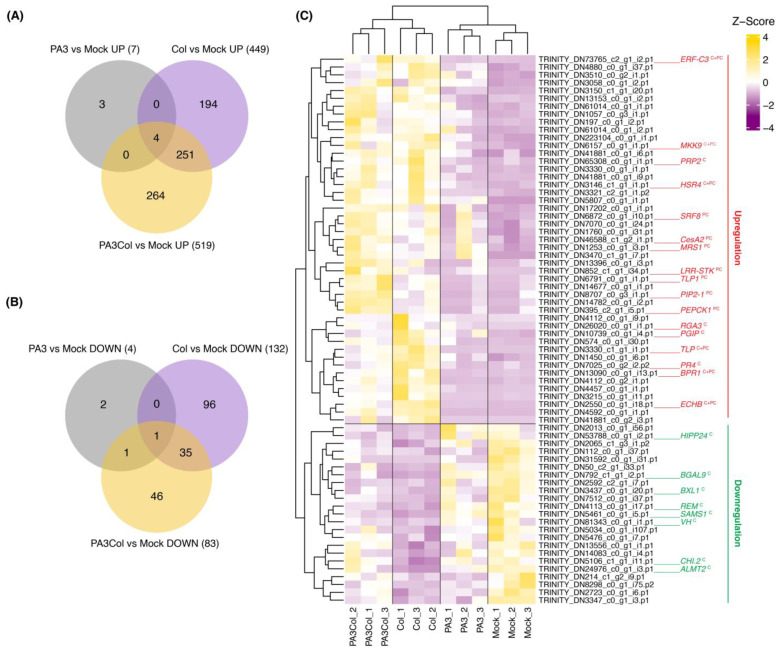
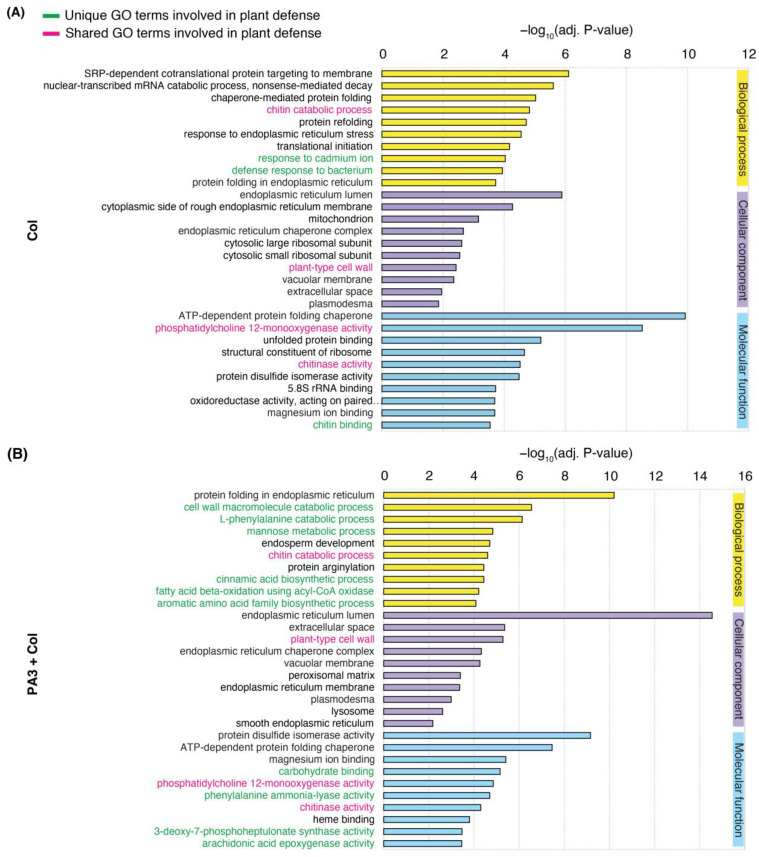
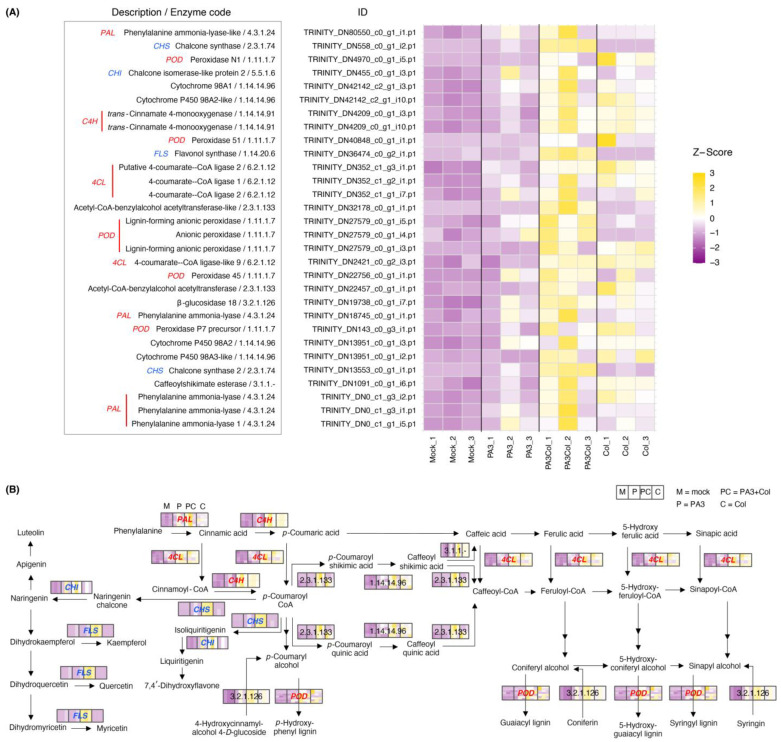
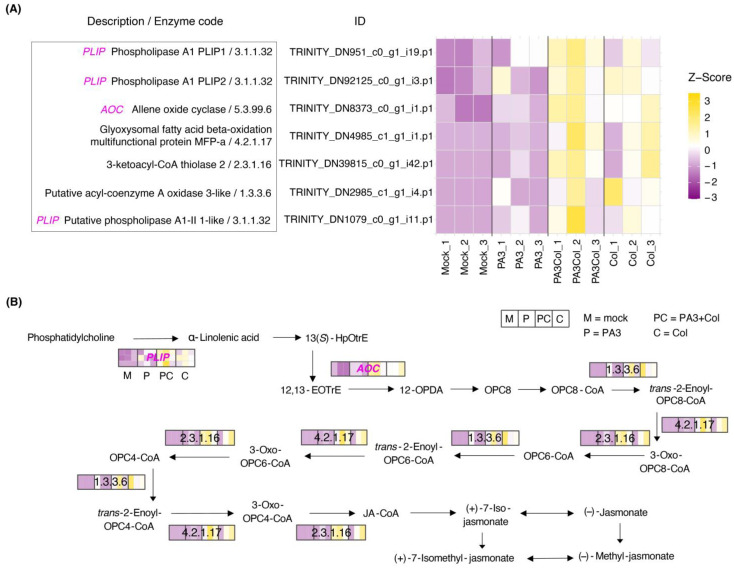
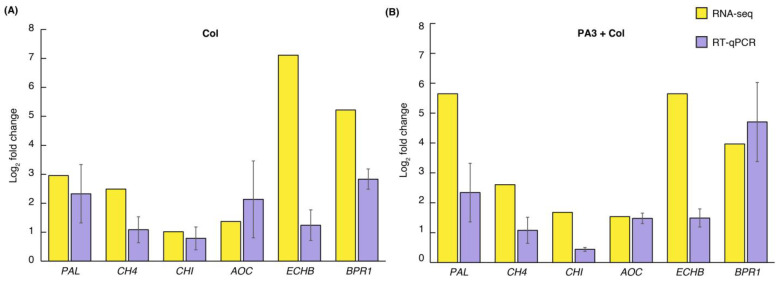
Chili anthracnose, caused by Colletotrichum truncatum, causes significant yield loss in chili production. In this study, we investigated the elicitor properties of a rhamnolipid (RL)-enriched PA3 fraction derived from Pseudomonas aeruginosa SWUC02 in inducing systemic resistance in yellow chili seedlings and antifungal activity against C. truncatum CFPL01 (Col). Fractionation of the ethyl acetate extract yielded 12 fractions, with PA3 demonstrating the most effective disease suppression, reducing the disease severity index to 4 ± 7.35% at 7 days post-inoculation compared with Col inoculation alone (83 ± 23.57%). PA3 also exhibited direct antifungal activity, inhibiting Col mycelial growth by 41 ± 0.96% at 200 µg/mL. Subfractionation revealed PA3 as a mixture of mono- and di-RLs, confirmed by 1H nuclear magnetic resonance and electrospray ionization mass spectrometry data. Additionally, PA3 enhanced seed germination and promoted plant growth without causing phytotoxicity. Transcriptomics revealed that PA3 pre-treatment prior to Col infection primed the defense response, upregulating defense-related genes involved in the phenylpropanoid, flavonoid, and jasmonic acid biosynthesis pathways, as well as those associated with cell wall reinforcement. Our findings highlight the potential of RL-enriched PA3 as both an antifungal agent and a plant defense elicitor, with transcriptome data providing new insights into defense priming and resistance pathways in chili, offering an eco-friendly solution for sustainable anthracnose management.

Keywords: Colletotrichum; Pseudomonas; anthracnose; biocontrol; chili plant; elicitor; induced systemic resistance; rhamnolipid; sustainable agriculture; transcriptome.


Conflict of interest statement

The authors declare no conflicts of interest.

Figures

Figure 1
Figure 1
Induced systemic resistance assay of the fractions (PA1 to PA12) isolated from the ethyl acetate extract of CF-SWUC02 in yellow chili seedlings. (A) % DSI represented as box plots (n ≥ 6). Different letters (a, b, c, d) indicate significant differences (p < 0.05). (B) Disease symptoms observed on seedlings at seven dpi. Col = C. truncatum CFPL01.
Figure 2
Figure 2
Percentage of mycelial growth inhibition (% MGI) and abnormalities in Col germination under PA3 treatment. (A) % MGI by PA3, carbendazim 50% WP, and mancozeb 80% WP at 200, 20, and 2 µg/mL. The negative control was potato dextrose agar without any supplements. Bars represent mean ± SD. Difference letters (a, b, c) indicate significant differences (p < 0.05) between treatments within each concentration. (B) Microscopic observations (1000×) of germinated hyphae from conidia treated with PA3 at 0 (control), 15.6, and 4000 µg/mL. Red arrows highlight abnormalities.
Figure 3
Figure 3
PA3 characteristic by 1H NMR and ES-MS spectroscopic data. (A) 1H NMR spectrum of PA3 in CD3OD, showing characteristic proton signals with the chemical structure of mono- and di-RLs displayed. (B) Negative-ion electrospray mass spectrum of PA3, with red circles highlighting the main detected peaks corresponding to molecular ions of mono- and di-RLs. The blue arrow indicates the detection limit, while the asterisks indicate the calculated monoisotopic masses of the detected ions.
Figure 4
Figure 4
Characterization of PA3 subfractions (PA3-1 and PA3-2) and their effects on disease symptoms in yellow chili seedlings. (A) Thin-layer chromatography (TLC) plate analysis of PA3 (left), PA3-1 (middle), and PA3-2 (right), visualized with p-anisaldehyde staining. (B) Percentage disease severity index (% DSI) of seedlings in mock, PA3-1, PA3-2, and Col treatments. Bars represent mean ± SD. Different letters (a, b) indicate significant differences (p < 0.05). (C) Disease severity symptoms observed on seedlings across different treatments.
Figure 5
Figure 5
Effects of PA3 application on seed germination and plant growth of yellow chili. (A) Germination speed index (GSI). (B) Percentage of seed germination (% SG). (C) Vigor index (VI). (D) Number of leaves per plant. (E) Number of flower buds per plant. (F) Plant height (cm). (G) Stem diameter (cm). Each dot represents an individual sample. Different letters (a, b, c) indicate statistically significant differences between treatments (p < 0.05).
Figure 6
Figure 6
Venn diagrams and heatmap of DEGs related to defense response. (A) Venn diagram showing the number of upregulated DEGs. (B) Venn diagram showing the number of downregulated DEGs. (C) Heatmap of 70 defense-related DEGs identified by GO terms, displaying Z-scores of gene expression levels. Genes highlighted in red indicate upregulated genes, while those in green indicate downregulated genes. Superscripts indicate the following: C = significant DEGs in Col treatment alone, PC = significant DEGs in PA3+Col treatment, and C + PC = significant DEGs in both treatments.
Figure 7
Figure 7
Top 10 enriched GO terms across three categories—biological process (yellow), cellular component (purple), and molecular function (blue)—related to DEGs. (A) Enriched GO terms in the Col treatment alone. (B) Enriched GO terms in the PA3+Col treatment. Unique defense-related GO terms are indicated in green, while shared defense-related GO terms between treatments are highlighted in pink.
Figure 8
Figure 8
Differential expression of DEGs involved in the phenylpropanoid and flavonoid biosynthesis pathways across different treatments. (A) The heatmap shows DEGs with their respective enzyme codes and gene IDs, with gene expression levels represented as Z-scores, indicating relative expression changes compared to the mean expression across treatments. (B) The schematic diagram illustrates the phenylpropanoid and flavonoid biosynthesis pathways. The colors within the boxes correspond to the Z-scores in the heatmap. Treatments are abbreviated as M = mock, P = PA3, PC = PA3+Col, and C = Col. DEGs encoding enzymes involved in the phenylpropanoid pathway are shown in red text, while those involved in the flavonoid pathway are shown in blue text.
Figure 9
Figure 9
Differential expression of DEGs involved in the α-linolenic acid biosynthesis pathway across different treatments. (A) The heatmap shows DEGs with their respective enzyme codes and gene IDs, with gene expression levels represented as Z-scores, indicating relative expression changes compared to the mean expression across treatments. (B) The schematic diagram illustrates the α-linolenic acid biosynthesis pathway, with enzyme codes and DEGs mapped to specific reactions. Treatments are abbreviated as M = mock, P = PA3, PC = PA3+Col, and C = Col.
Figure 10
Figure 10
Validation of gene expression levels by RNA-seq and RT-qPCR for six DEGs: PAL, C4H, CHI, AOC, ECHB, and BPR1. (A) Fold change comparison in the Col treatment alone relative to the mock treatment; and (B) fold change comparison in the PA3+Col treatment relative to the mock treatment. Yellow bars represent RNA-seq results, while purple bars represent RT-qPCR results, shown as log2 fold change.

Similar articles

References

    1. Karim K.M.R., Rafii M.Y., Misran A.B., Ismail M.F.B., Harun A.R., Khan M.M.H., Chowdhury M.F.N. Current and prospective strategies in the varietal improvement of chilli (Capsicum annuum L.) specially heterosis breeding. Agronomy. 2021;11:2217. doi: 10.3390/agronomy11112217. - DOI
    1. Than P.P., Prihastuti H., Phoulivong S., Taylor P.W., Hyde K.D. Chilli anthracnose disease caused by Colletotrichum species. J. Zhejiang Univ. Sci. B. 2008;9:764–778. doi: 10.1631/jzus.B0860007. - DOI - PMC - PubMed
    1. Saxena A., Raghuwanshi R., Gupta V.K., Singh H.B. Chilli anthracnose: The epidemiology and management. Front. Microbiol. 2016;7:1527. doi: 10.3389/fmicb.2016.01527. - DOI - PMC - PubMed
    1. Vlot A.C., Sales J.H., Lenk M., Bauer K., Brambilla A., Sommer A., Chen Y., Wenig M., Nayem S. Systemic propagation of immunity in plants. New Phytol. 2021;229:1234–1250. doi: 10.1111/nph.16953. - DOI - PubMed
    1. del Carmen Orozco-Mosqueda M., Fadiji A.E., Babalola O.O., Santoyo G. Bacterial elicitors of the plant immune system: An overview and the way forward. Plant Stress. 2023;7:100138. doi: 10.1016/j.stress.2023.100138. - DOI

MeSH terms

LinkOut - more resources