. 2024 Nov 24;25(23):12619.
doi: 10.3390/ijms252312619.

Blue Light-Induced Mitochondrial Oxidative Damage Underlay Retinal Pigment Epithelial Cell Apoptosis

Affiliations

Blue Light-Induced Mitochondrial Oxidative Damage Underlay Retinal Pigment Epithelial Cell Apoptosis

Mohamed Abdouh et al. Int J Mol Sci. .

Abstract

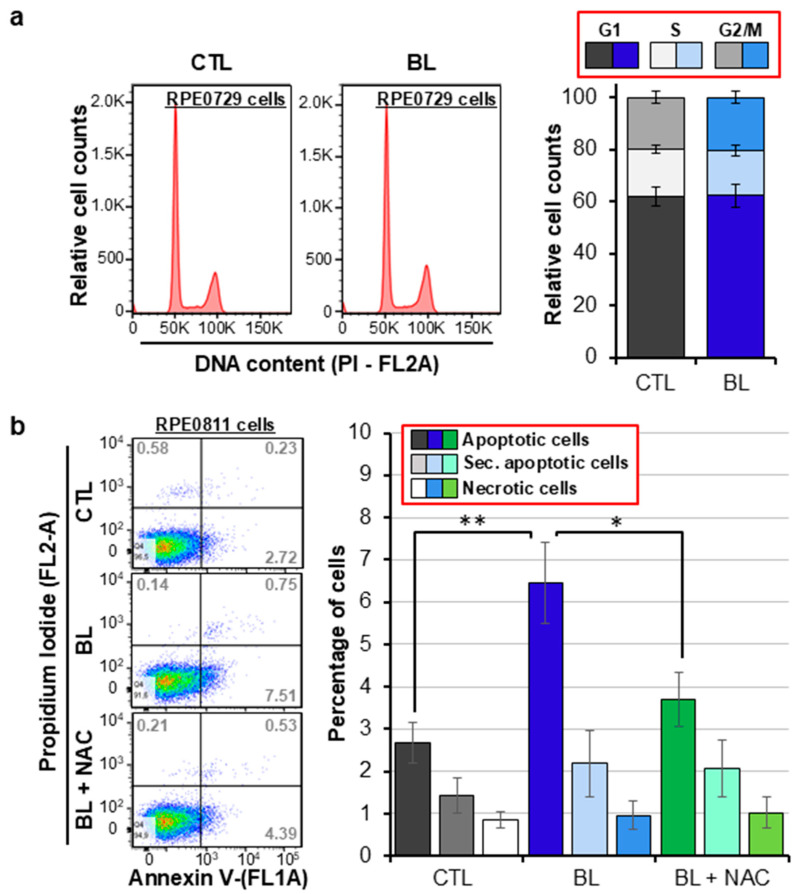
Reactive oxygen species (ROS) play a pivotal role in apoptosis. We reported that Blue Light (BL) induced oxidative stress in human retinal pigment epithelial (RPE) cells in vitro and increased drusen deposition and RPE cell apoptosis in human eyes. Here, we investigated the mechanisms underlying BL-induced damage to RPE cells. Cells were exposed to BL with or without the antioxidant N-acetylcysteine. Cells were analyzed for levels of ROS, proliferation, viability, and mitochondria membrane potential (ΔΨM) fluctuation. We performed proteomic analyses to search for differentially expressed proteins. ROS levels increased following RPE cell exposure to BL. While ROS production did not affect RPE cell proliferation, it was accompanied by decreased ΔΨM and increased cell apoptosis due to the caspase cascade activation in a ROS-dependent manner. Proteomic analyses revealed that BL decreased the levels of ROS detoxifying enzymes in exposed cells. We conclude that BL-induced oxidative stress is cytotoxic to RPE cells. These findings bring new insights into the involvement of BL on RPE cell damage and its role in the progression of age-related macular degeneration. The use of antioxidants is an avenue to block or delay BL-mediated RPE cell apoptosis to counteract the disease progression.

Keywords: antioxidant; apoptosis; blue light; caspases activation; mitochondria damage; oxidative stress; retinal pigment epithelial cells.


Conflict of interest statement

The authors declare no conflicts of interest.

Figures

Figure 1
Figure 1
BL-induced oxidative stress in primary RPE cells. Primary human RPE cells were exposed to BL for 30 min. (a) Cells were analyzed for the production of total cellular ROS using the DCF-DA probe. (b) Cells were analyzed for the production of mitochondrial superoxide anion using the MitoSox Red probe. Data are presented as mean ± SD (n = 6 independent experiments each repeated in quadruplicates, ** p ˂ 0.01, *** p ˂ 0.001).
Figure 2
Figure 2
BL-induced RPE cells apoptosis in a ROS-dependent manner. Primary human RPE cells were exposed to BL for 30 min. (a) 24 h post-BL exposure, cells were labeled with propidium iodide (PI) and analyzed for their proliferation. Representative cell cycle phase distribution histograms are shown where the first peak (at 50 k) corresponds to cells in the G1 phase, the second peak (at 100 k) corresponds to cells in the G2/M, and area in between the peaks represents cells in the S phase. The graph displays the percentages of cells in these different phases of cell cycle as analyzed using FlowJo software (v10.10). (b) 6 h post-BL exposure, cells were labeled with Annexin V and PI and analyzed for the percentages of apoptotic cells by flow cytometry. Representative Annexin V/PI density plots are shown that display live cells (left-lower quadrants), apoptotic cells (right-lower quadrant), secondary apoptotic cells (right-upper quadrant) and necrotic cells (left-upper quandrant). The numbers represent the percentages of cells in the respective quadrants as analyzed using FlowJo software. The graph displays means of the percentages of primary apoptotic, secondary apoptotic and necrotic cells. Data are presented as mean ± SD (n = 6 independent experiments, * p < 0.05, ** p ˂ 0.01).
Figure 3
Figure 3
BL reduced the mitochondrial membrane potential in a ROS-dependent manner. Primary human RPE cells were exposed to BL for 30 min, and cells were stained with JC-1 probe. Fluorescence of J-aggregates and J-monomers were measured. Data are expressed as the ratio between the 2 measures and are presented as mean ± SD (n = 6 independent experiments each repeated in quadruplicates, * p < 0.05, ** p ˂ 0.01.
Figure 4
Figure 4
BL increased caspase cascade activation in ROS-dependent manner. Primary human RPE cells were exposed to BL for 30 min. (a) Proteins extracts were analyzed by immunoblot for the activation of Caspase 9. β-actin and red ponceau staining were used as calibrators for proteins loading. The graph shows the levels of caspases activation in the corresponding samples. Data are expressed as the densitometer values relative to the value in control sample set at 1. (b) Cells were loaded with CellEvent Caspase 3/7 Green. Pictures were acquired using a LSM780 confocal microscope. The graph displays the levels of caspases 3 and 7 activation in the corresponding samples. Data are expressed as mean fluorescence intensity (MFI) measured in an Infinite M200 Pro microplate reader relative to the value in control sample set at 1. Data are presented as mean ± SD (n = 3–5 independent RPE cells samples). * p < 0.05, ** p < 0.01.
Figure 5
Figure 5
BL decreased the expression levels of ROS detoxifying enzymes. Primary human RPE cells were exposed to BL for 30 min. (a) Venn diagram analyses. Samples datasets were compared for shared proteins between non-exposed cells (CTL), between BL-exposed cells (BL), and between exposed and non-exposed cells. In the insert, CTL and BL-exposed RPE cells shared 2369 proteins, while 288 and 153 proteins were exclusively present in CTL and BL-exposed RPE cells, respectively (see Supplementary Table S1 for the full list of proteins). (b) Volcano plot representation of proteins significantly and differentially expressed between CTL and BL-exposed RPE cells (See Supplementary Tables S2 and S3 for the respective protein lists). For statistical analyses, we set the analysis for a T-Test with a significant level at 0.05). ■: Significant, ●: Nonsignificant. (c) Table showing a short list of ROS detoxifying enzymes which expression is decreased in BL-exposed cells. In Orange lines are shown differentially and significantly expressed proteins. In Green are shown proteins with decreased expression levels in BL-exposed cells but not reaching the statistical significance (See Supplementary Table S4 for the full list of identified proteins). Data are obtained from the analysis of 5 RPE cell lines derived from 5 different eye donors.
Figure 6
Figure 6
Gene ontology classification of proteomic data for differentially expressed proteins in primary RPE cells exposed or not to BL. The most enriched categories in biological processes, as analyzed by the DAVID bioinformatics platform, are shown. Data were collected from protein preparations obtained from five patient-derived RPE cells.
Figure 7
Figure 7
BL-induced RPE cell apoptosis model. BL-mediated oxidative stress triggered mitochondrial damage and concomitant caspase cascade activation. These effects induced RPE cell apoptosis, that could be reversed by antioxidants (i.e., N-acetyl cysteine; NAC).

Similar articles

Cited by

References

    1. Joachim N., Mitchell P., Burlutsky G., Kifley A., Wang J.J. The Incidence and Progression of Age-Related Macular Degeneration over 15 Years: The Blue Mountains Eye Study. Ophthalmology. 2015;122:2482–2489. doi: 10.1016/j.ophtha.2015.08.002. - DOI - PubMed
    1. Ferris F.L. Senile macular degeneration:review of epidemiologic features. Am. J. Epidemiol. 1983;118:132–151. doi: 10.1093/oxfordjournals.aje.a113624. - DOI - PubMed
    1. Heesterbeek T.J., Lorés-Motta L., Hoyng C.B., Lechanteur Y.T.E., den Hollander A.I. Risk factors for progression of age-related macular degeneration. Ophthalmic Physiol. Opt. 2020;40:140–170. doi: 10.1111/opo.12675. - DOI - PMC - PubMed
    1. Wong W.L., Su X., Li X., Cheung C.M., Klein R., Cheng C.Y., Wong T.Y. Global prevalence of age-related macular degeneration and disease burden projection for 2020 and 2040: A systematic review and meta-analysis. Lancet Glob. Health. 2014;2:e106–e116. doi: 10.1016/S2214-109X(13)70145-1. - DOI - PubMed
    1. Ding X., Patel M., Chan C.C. Molecular pathology of age-related macular degeneration. Prog. Retin. Eye Res. 2009;28:1–18. doi: 10.1016/j.preteyeres.2008.10.001. - DOI - PMC - PubMed

Grants and funding

LinkOut - more resources