

Potentiation of NMDA Receptors by AT1 Angiotensin Receptor Activation in Layer V Pyramidal Neurons of the Rat Prefrontal Cortex
- PMID: 39684355
- PMCID: PMC11641273
- DOI: 10.3390/ijms252312644
Potentiation of NMDA Receptors by AT1 Angiotensin Receptor Activation in Layer V Pyramidal Neurons of the Rat Prefrontal Cortex
Abstract
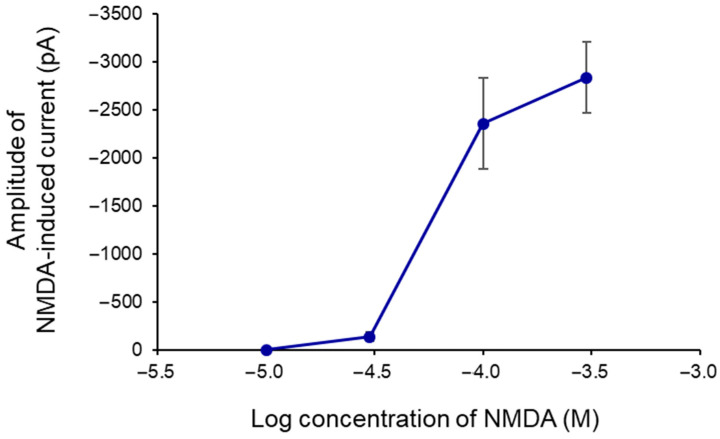
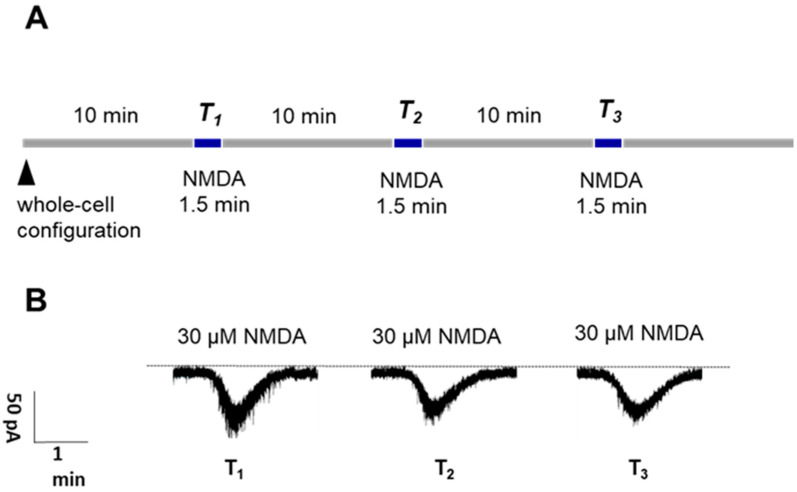
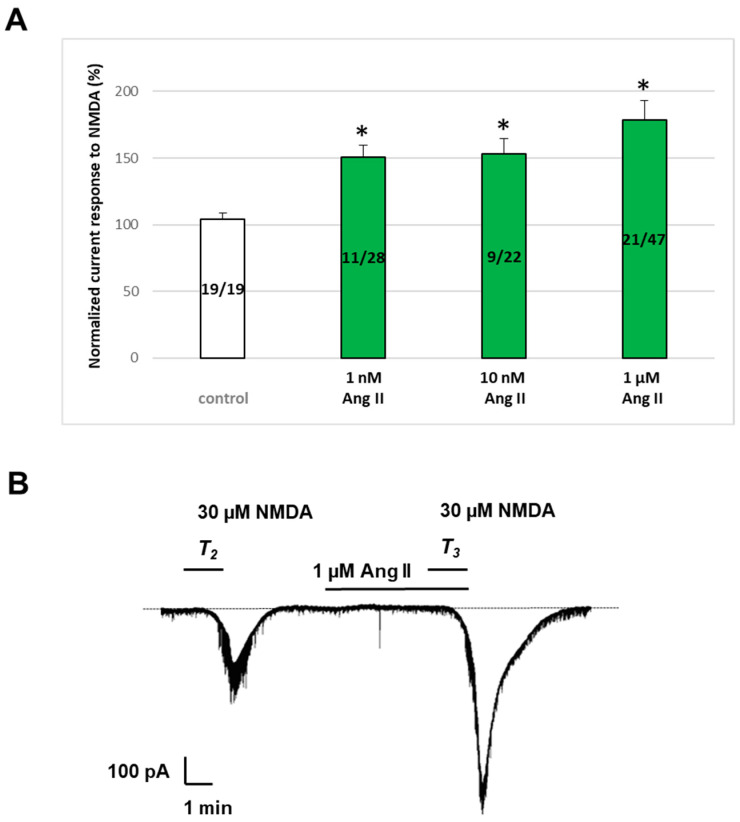
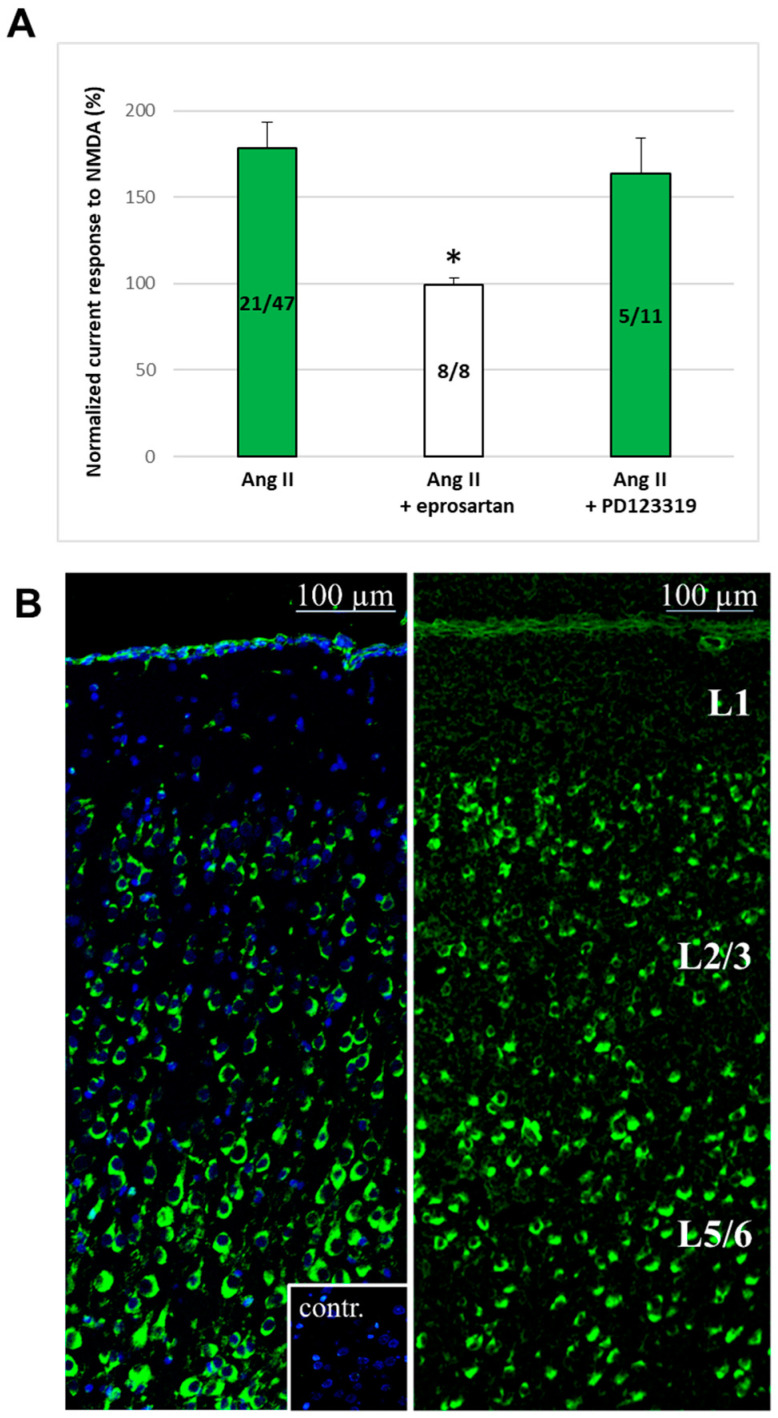
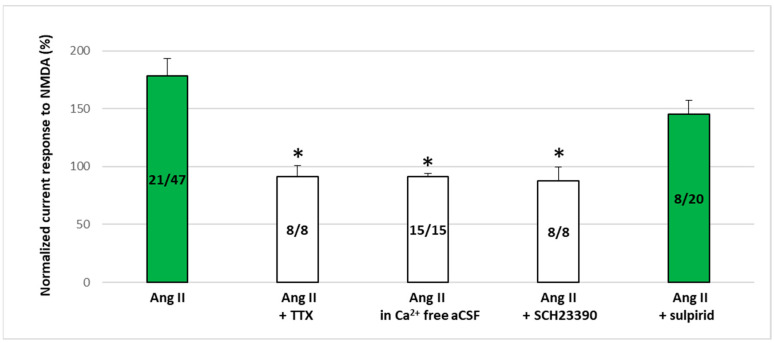
NMDA receptors in the prefrontal cortex (PFC) play a crucial role in cognitive functions. Previous research has indicated that angiotensin II (Ang II) affects learning and memory. This study aimed to examine how Ang II impacts NMDA receptor activity in layer V pyramidal cells of the rat PFC. Whole-cell patch-clamp experiments were performed in pyramidal cells in brain slices of 9-12-day-old rats. NMDA (30 μM) induced inward currents. Ang II (0.001-1 µM) significantly enhanced NMDA currents in about 40% of pyramidal cells. This enhancement was reversed by the AT1 antagonist eprosartan (1 µM), but not by the AT2 receptor antagonist PD 123319 (5 μM). When pyramidal neurons were synaptically isolated, the increase in NMDA currents due to Ang II was eliminated. Additionally, the dopamine D1 receptor antagonist SCH 23390 (10 μM) reversed the Ang II-induced enhancement, whereas the D2 receptor antagonist sulpiride (20 μM) had no effect. The potentiation of NMDA currents in a subpopulation of layer V pyramidal neurons by Ang II, involving AT1 receptor activation and dopaminergic signaling, may serve as an underlying mechanism for the effects of the renin-angiotensin system (RAS) elements on neuronal functions.
Keywords: AT1 angiotensin receptor; D1 dopamine receptor; NMDA receptor; RAS; neuromodulation; prefrontal cortex.
Conflict of interest statement
The authors declare no conflicts of interest. Preliminary results of this study were presented by L. Köles at the 22nd Scientific Symposium of the Austrian Pharmacological Society, a joint meeting with the Hungarian Society for Experimental and Clinical Pharmacology in Vienna, on 8–10 September 2016 [122]. This article is a revised and expanded version of that presentation.
Figures
Similar articles
-
Angiotensin IV Receptors in the Rat Prefrontal Cortex: Neuronal Expression and NMDA Inhibition.Biomedicines. 2024 Dec 31;13(1):71. doi: 10.3390/biomedicines13010071. Biomedicines. 2024. PMID: 39857655 Free PMC article.
-
Interaction of dopamine D1 and NMDA receptors mediates acute clozapine potentiation of glutamate EPSPs in rat prefrontal cortex.J Neurophysiol. 2002 May;87(5):2324-36. doi: 10.1152/jn.2002.87.5.2324. J Neurophysiol. 2002. PMID: 11976371
-
Effects of asenapine on prefrontal N-methyl-D-aspartate receptor-mediated transmission: involvement of dopamine D1 receptors.Synapse. 2010 Nov;64(11):870-4. doi: 10.1002/syn.20803. Synapse. 2010. PMID: 20842721
-
D1 but not D2 dopamine receptors or adrenoceptors mediate dopamine-induced potentiation of N-methyl-d-aspartate currents in the rat prefrontal cortex.Neurosci Lett. 2004 Nov 30;372(1-2):89-93. doi: 10.1016/j.neulet.2004.09.015. Neurosci Lett. 2004. PMID: 15531094
-
Integration of neuronal and glial signalling by pyramidal cells of the rat prefrontal cortex; control of cognitive functions and addictive behaviour by purinergic mechanisms.Neuropsychopharmacol Hung. 2013 Dec;15(4):206-13. Neuropsychopharmacol Hung. 2013. PMID: 24380961 Review.
Cited by
-
Genetic, Epigenetic, and Hormonal Regulation of Stress Phenotypes in Major Depressive Disorder: From Maladaptation to Resilience.Cell Mol Neurobiol. 2025 Mar 26;45(1):29. doi: 10.1007/s10571-025-01549-x. Cell Mol Neurobiol. 2025. PMID: 40138049 Free PMC article. Review.
-
TRP channels and cancer modulation: a voyage beyond metabolic reprogramming, oxidative stress and the advent of nanotechnologies in targeted therapy.J Exp Clin Cancer Res. 2025 Aug 14;44(1):240. doi: 10.1186/s13046-025-03495-4. J Exp Clin Cancer Res. 2025. PMID: 40813985 Free PMC article. Review.
-
Angiotensin IV Receptors in the Rat Prefrontal Cortex: Neuronal Expression and NMDA Inhibition.Biomedicines. 2024 Dec 31;13(1):71. doi: 10.3390/biomedicines13010071. Biomedicines. 2024. PMID: 39857655 Free PMC article.
-
Can pyridoxine function as an anti-pyroptosis agent? A narrative review.Inflammopharmacology. 2025 May;33(5):2341-2349. doi: 10.1007/s10787-025-01745-7. Epub 2025 Apr 17. Inflammopharmacology. 2025. PMID: 40244490 Review.
References
-
- Fuster J.M. The prefrontal cortex, mediator of cross-temporal contingencies. Hum. Neurobiol. 1985;4:169–179. - PubMed
MeSH terms
Substances
Grants and funding
- TKP2021-EGA-23/Ministry of Innovation and Technology of Hungary from the National Research, Development, and Innovation Fund
- TKP2021-EGA-25/Ministry of Innovation and Technology of Hungary from the National Research, Development, and Innovation Fund
- OTKA-K128875/National Research, Development, and Innovation Office of Hungary
- NKFI K 146086/National Research, Development, and Innovation Office of Hungary
LinkOut - more resources
Full Text Sources
Research Materials
Miscellaneous
