. 2024 Nov 26;25(23):12687.
doi: 10.3390/ijms252312687.

Binding of MAP3773c Protein of Mycobacterium avium subsp. paratuberculosis in the Mouse Ferroportin1 Coding Region

Affiliations

Binding of MAP3773c Protein of Mycobacterium avium subsp. paratuberculosis in the Mouse Ferroportin1 Coding Region

Dulce Liliana Dueñas Mena et al. Int J Mol Sci. .

Abstract

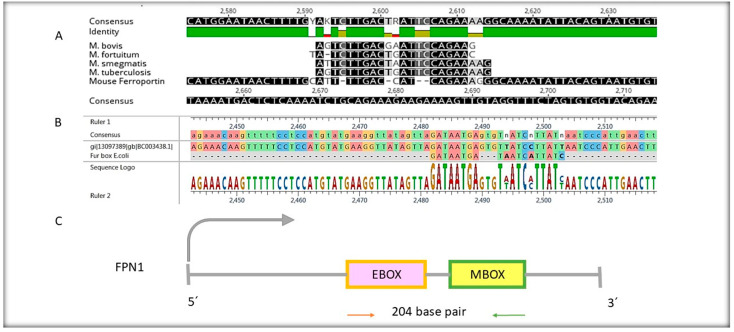
Mycobacterium avium subsp. paratuberculosis (MAP) is known to cause paratuberculosis. One notable protein, MAP3773c, plays a critical role in iron metabolism as a transcription factor. This study aims to investigate the binding affinity of MAP3773c to the chromatin of the Ferroportin1 (FPN1) gene in murine macrophage J774 A.1. We conducted a sequence alignment to identify potential interaction sites for MAP3773c. Following this, we used in silico analysis to predict binding interactions, complemented by electrophoretic mobility shift assay (EMSA) to confirm in vitro binding of MAP3773c. The map3773c gene was cloned into the pcDNA3.1 vector, with subsequent expression analysis carried out via Western blotting and real-time PCR. Chromatin immunoprecipitation (CHiP) assays were performed on transfected macrophages to confirm binding in the native chromatin context. Our in silico and in vitro analysis indicated that MAP3773c interacts with two binding motifs within the FPN1 coding region. The ChiP results provided additional validation, demonstrating the binding of MAP3773c to the FPN1 chromatin through successful amplification of the associated chromatin fragment via PCR. Our study demonstrated that MAP3773c binds to FPN1 and provides insight into the role of MAP3773c and its effect on host iron transport.

Keywords: Ferroportin1; MAP3773c; transcription factor; transcription regulation.


Conflict of interest statement

The authors declare no conflicts of interest.

Figures

Figure 1
Figure 1
Sequence alignment. (A) represents the alignment of mycobacterial sequences with FPN1 of Mus musculus. (B) represents the alignment of sequences of the iron box of E. coli with FPN1 of Mus musculus. (C) represents the coding sequence of FPN1 and the two internal regions where the two boxes recognized by MAP3773c are located.
Figure 2
Figure 2
Docking simulations of the MAP3773c protein with the DNA MBOX complexes were conducted to analyze the interaction dynamics. (A) spatial analysis was performed to evaluate the interaction sites between the protein and DNA, with specifications detailing the dimensions of interaction in the x, y, and z coordinates. The area of overall analysis (B) was quantified, alongside the coupling energies of the complexes (C). Key interaction sites between the protein and DNA (D) were identified and contact points within the complex were characterized. (E) The coupling of MBOX with MAP3773c can be observed at the specified binding site, indicating that they can bind with a binding energy of -9.2 kcal/mol. Interactions with specific amino acids, including ARG45, THR58, and GLU57 (highlighted in red), have also been detected. Additional models of protein–DNA interactions were explored, facilitated by visualizations generated using the Discovery Studio program (F).
Figure 3
Figure 3
Docking simulations of the MAP3773c protein with the DNA EBOX complexes were conducted to analyze the interaction dynamics. (A) A spatial analysis was performed to evaluate the interaction sites between the protein and DNA, with specifications detailing the dimensions of interaction in the x, y, and z coordinates. The area of overall analysis (B) was quantified, alongside the coupling energies of the complexes (C). Key interaction sites between the protein and DNA (D) were identified and contact points within the complex were characterized. (E) Alternative interaction visualization format. Additional models of protein–DNA interactions were explored, facilitated by visualizations generated using the Discovery Studio program (F).
Figure 4
Figure 4
Analysis of Western blotting and real-time PCR of macrophage transfection treatments with pcDNA3.1-map3773c. (A) Western blotting using the anti-map3773c antibody against the MAP3773c protein expressed at different time points, 24 h, 48 h and with Anti Actin antibody, 24 and 48 h. The analysis was performed for different treatment groups: line 1, MWM (molecular weight marker); line 2, transfected with pcDNA3.1-map3773c with neomyciny; line 3, not transfected without neomycin; line 4, not transfected with neomycin; line 5, transfected with pcDNA3.1; line 6, transfected with pcDNA3.1-map3773c and with iron 400 nM; and line 7, MAP3773c protein. (B) Real-time PCR, 24 h treatment, target, macrophages without transfection and neomycin. Neo, macrophages only with neomycin; pcDNA 3.1+ Neo, macrophages transfected with the vector without the map3773c gene and with neomycin; pcDNA3.1-map3773c +Neo, macrophages transfected with the vector and the map3773c gene and with neomycin; pcDNA3.1–map3773c+Neo+ FeNTA, macrophages transfected with pcDNA-map3773c with neomycin and with iron, but a 48 h of treatment. Actin as internal control. Data are presented as an average ± SD for three independent experiments. ** p < 0.01, *** p < 0.001 and **** p < 0.0001 vs. white; ns, not significant.
Figure 5
Figure 5
EMSA reaction. The experiments were conducted following the methods and materials described earlier. NRD (MAP3769-338) and NRD with protein (MAP3773c) were tested under four different conditions: (1) region 2482–2503 (EBOX) with two mM EDTA, (2) region 2592–2614 (MBOX) with two mM EDTA, (3) region 2482–2503 (EBOX) with 15 mM MnCl2 and (4) region 2592–2614 (MBOX) with 15 mM MnCl2. Additionally, two more conditions were tested: (5) region 2482–2503 (EBOX) with 15 mM ZnCl2 and (6) region 2592–2614 (MBOX) with 15 mM ZnCl2.
Figure 6
Figure 6
Macrophage transfection CHiP was performed with pcDNA3.1-map3773c at 24 and 48 h for case (A): Line 1: Molecular weight marker; 2, CHiP reaction input; 3, CHiP of transfected macrophage DNA pcDNA-map3773c for 24 h; 4, negative control of Anti-lgG rabbit; 5, positive control of chromatin Immunoprecipitation Actin with anti-RNA polymerase antibodies. For case (B), the same procedure was followed but the transfection treatments were performed with iron at 24 h. For case (C), the same as A, but the treatment duration was 48 h. For case (D), the same as B, but the iron treatment duration was 48 h.

References

    1. Ganz T. Cellular iron: Ferroportin is the only way out. Cell Metab. 2005;1:155–157. doi: 10.1016/j.cmet.2005.02.005. - DOI - PubMed
    1. Donovan A., Brownlie A., Zhou Y., Shepard J., Pratt S.J., Moynihan J., Paw B.H., Drejer A., Barut B., Zapata A., et al. Positional cloning of zebrafish ferroportin1 identifies a conserved vertebrate iron exporter. Nature. 2000;403:776–781. doi: 10.1038/35001596. - DOI - PubMed
    1. Knutson M.D., Vafa M.R., Haile D.J., Wessling-Resnick M. Iron loading and erythrophagocytosis increase ferroportin 1 (FPN1) expression in J774 macrophages. Blood. 2003;102:4191–4197. doi: 10.1182/blood-2003-04-1250. - DOI - PubMed
    1. Park B.Y., Chung J. Effects of various metal ions on the gene expression of iron exporter ferroportin-1 in J774 macrophages. Nutr. Res. Pract. 2008;2:317–321. doi: 10.4162/nrp.2008.2.4.317. - DOI - PMC - PubMed
    1. Verma S., Prescott R., Cherayil B.J. The commensal bacterium Bacteroides fragilis down-regulates ferroportin expression and alters iron homeostasis in macrophages. J. Leukoc. Biol. 2019;106:1079–1088. doi: 10.1002/JLB.2A1018-408RR. - DOI - PMC - PubMed

LinkOut - more resources