. 2024 Nov 26;25(23):12700.
doi: 10.3390/ijms252312700.

Molecular Characterization of Subdomain Specification of Cochlear Duct Based on Foxg1 and Gata3

Affiliations

Molecular Characterization of Subdomain Specification of Cochlear Duct Based on Foxg1 and Gata3

Yongjin Gil et al. Int J Mol Sci. .

Abstract

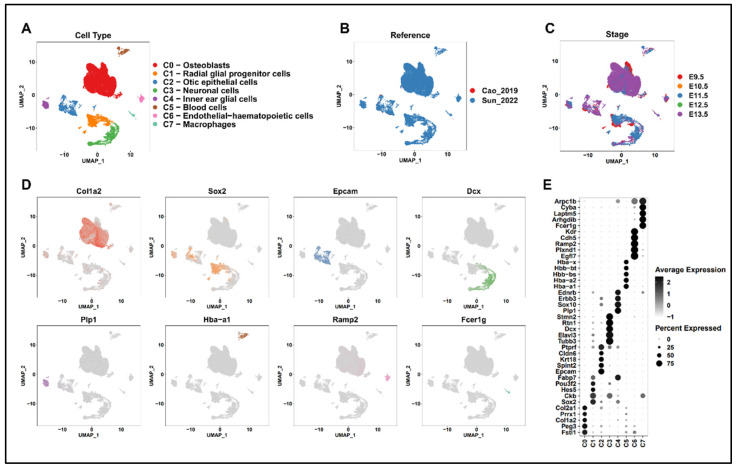
The inner ear is one of the sensory organs of vertebrates and is largely composed of the vestibule, which controls balance, and the cochlea, which is responsible for hearing. In particular, a problem in cochlear development can lead to hearing loss. Although numerous studies have been conducted on genes involved in the development of the cochlea, many areas still need to be discovered regarding factors that control the patterning of the early cochlear duct. Herein, based on the dynamic expression pattern of FOXG1 in the apical and basal regions of the E13.5 cochlear duct, we identified detailed expression regions through an open-source analysis of single-cell RNA analysis data and demonstrated a clinical correlation with hearing loss. The distinct expression patterns of FOXG1 and GATA3 during the patterning process of the cochlear duct provide important clues to understanding how the fates of the apical and basal regions are divided. These results are expected to be extremely important not only for understanding the molecular mechanisms involved in the early development of the cochlear duct, but also for identifying potential genes that cause hearing loss.

Keywords: Foxg1; cochlear duct; inner ear.


Conflict of interest statement

The authors declare no conflicts of interest.

Figures

Figure 1
Figure 1
Expressions of FOXG1 and GATA3 in the developing inner ear. At E9.5–E10.5, the otic vesicle begins to extend, and from E11.5, the cochlear duct begins to extend; the cross section of the cochlear duct is observed at E12.5 and E13.5. The section plane is indicated in the embryo image on the left. (A,B) At E9.5–E10.5, FOXG1 and GATA3 are expressed throughout the otic vesicle. (C) In the cochlea at E11.5, Gata3 shows a change in expression toward the medial–lateral part, whereas Foxg1 maintains global expression. (D) In the cochlea at E12.5, Gata3 is expressed only in the dorsal region, whereas Foxg1 continues to be expressed in both the dorsal and ventral regions. (E) At E13.5, three cochlear sections and nearby ganglia are visible. In all sections, Gata3 is expressed at the base, Foxg1 is expressed throughout the apical duct (asterisk in E), and only Gata3 is expressed at the base. Scale bar = 100 μm. CD, cochlear duct; fac, facio-acoustic (VII-VIII) neural crest complex; GER, the greater epithelial ridge; LER, the lesser epithelial ridge; OV, otic vesicle; PHV, primary head vein; PIN, Pinna; SC, Spinal cord. (F) Quantitative analysis of changes in Foxg1 expression at the base and apex of E13.5 cochlea. The cochlea was divided into the roof and floor, and the proportion of cells expressing Foxg1 and Gata3 in the corresponding region was shown (n = 5). At the apex, Foxg1 expression was high at the roof and floor, but was decreased at the floor of the base compared to the apex. **** p ≤ 0.0001.
Figure 2
Figure 2
Identification of inner-ear cell type. (AC) UMAP plots for cell type (A), reference (B), and stage (C). (D) UMAP plots showing marker gene expression in individual clusters. (E) Dot plots showing the expressions of the top 5 marker genes and their proportion in individual cell clusters. Color gradient represents the average expression, and dot size indicates the percentage of expressed cells.
Figure 3
Figure 3
hdWGCNA of cochlear epithelial cell subtype. (A) UMAP plots showing modules identified by hdWGCNA and the top 10 hub genes for each module. Colors represent the following modules: CD−M1 (roof) in orange, CD−M2 (LER and PD) in green, CD−M3 (GER and PD) in red, CD−M4 (cell cycle) in cyan, CD−M5 (epithelial patterning) in dark green, CD−M6 (GER and Roof) in light pink, CD−M7 (cartilage) in dark blue, CD−M8 (protein and RNA metabolism) in medium blue, CD−M9 (ribosome) in pink, and CD−M10 (mitochondria) in dark purple. (B) Radar plot showing the kME values of hub genes. Colors represent the following genes: Foxg1 in light pink, Gata3 in green, Otx2 in orange, Bmp4 in red, Sox2 in cyan, and Fgf10 in medium blue. (C) UMAP plot showing the hub gene network.
Figure 4
Figure 4
Network analysis of Foxg1 and Gata3. (A) UMAP plot showing the expression of Foxg1 and Gata3. Colors represent the following genes: Foxg1 in red, Gata3 in green, and cells with blended expression of both genes in yellow. (B) Gene network of the top 20 genes highly correlated with Foxg1. Colors represent the following modules: CD−M3 (GER and PD) in red and CD−M6 (GER and roof) in light pink. (C) Gene network of the top 20 genes highly correlated with Gata3. Colors represent the following modules: CD−M2 (LER and PD) in green. (D) Dot plot showing the Gene Ontology (GO) terms related to the biological process for genes included in the Foxg1 network. Dot size represents the gene count, whereas color represents the adjusted p-value. (E) Dot plot showing the GO terms related to the biological process for genes included in the Gata3 network. Dot size represents gene count, and color represents the adjusted p-value.
Figure 5
Figure 5
Expression of various marker genes in the E13.5 cochlear duct. (A) OTX2, a cochlear roof marker, is specifically expressed in the roof of the apical and primary ducts. FOXG1 is expressed throughout the basal, roof, and GER. In vertex ducts, they are visible on both the roof and the floor. (B) SOX2, a sensory domain marker, is co-expressed in the basal region with Gata3, and Gata3 is expressed more broadly throughout the LER. (C) Unlike GATA3, SOX9 is expressed throughout the cochlear epithelium. (D) The expression of JAG1 can be observed in the prosensory domain and GER, together with that of FOXG1. Scale bar = 100 μm. GER, greater epithelial ridge; LER, lesser epithelial ridge; PSD, prosensory domain; SGN, spiral ganglion neurons.
Figure 6
Figure 6
The association between hearing loss-associated disease and modules. (A) Heatmap showing genes and hearing loss-related diseases divided by modules. (B) Heatmap showing genes and the Z-scored kME values for each module. (C) Scheme summarizing the structure of the cochlear duct and genes related to hearing loss diseases within each module.

Similar articles

References

    1. Kochhar A., Hildebrand M.S., Smith R.J. Clinical aspects of hereditary hearing loss. Genet. Med. 2007;9:393–408. doi: 10.1097/GIM.0b013e3180980bd0. - DOI - PubMed
    1. Zhang W., Kim S.M., Wang W., Cai C., Feng Y., Kong W., Lin X. Cochlear Gene Therapy for Sensorineural Hearing Loss: Current Status and Major Remaining Hurdles for Translational Success. Front. Mol. Neurosci. 2018;11:221. doi: 10.3389/fnmol.2018.00221. - DOI - PMC - PubMed
    1. Pyott S.J., Pavlinkova G., Yamoah E.N., Fritzsch B. Harmony in the Molecular Orchestra of Hearing: Developmental Mechanisms from the Ear to the Brain. Annu. Rev. Neurosci. 2024;47:1–20. doi: 10.1146/annurev-neuro-081423-093942. - DOI - PMC - PubMed
    1. Egilmez O.K., Kalcioglu M.T. Genetics of Nonsyndromic Congenital Hearing Loss. Scientifica. 2016;2016:7576064. doi: 10.1155/2016/7576064. - DOI - PMC - PubMed
    1. Shearer A.E., Hildebrand M.S., Schaefer A.M., Smith R.J. Genetic Hearing Loss Overview. GeneReviews®; Seattle, WA, USA: 2023. [(accessed on 10 November 2024)]. Available online: https://www.ncbi.nlm.nih.gov/books/NBK1434/

MeSH terms

LinkOut - more resources