. 2024 Nov 26;25(23):12701.
doi: 10.3390/ijms252312701.

Neurotrophic Effects of Foeniculum vulgare Ethanol Extracts on Hippocampal Neurons: Role of Anethole in Neurite Outgrowth and Synaptic Development

Affiliations

Neurotrophic Effects of Foeniculum vulgare Ethanol Extracts on Hippocampal Neurons: Role of Anethole in Neurite Outgrowth and Synaptic Development

Sarmin Ummey Habiba et al. Int J Mol Sci. .

Abstract

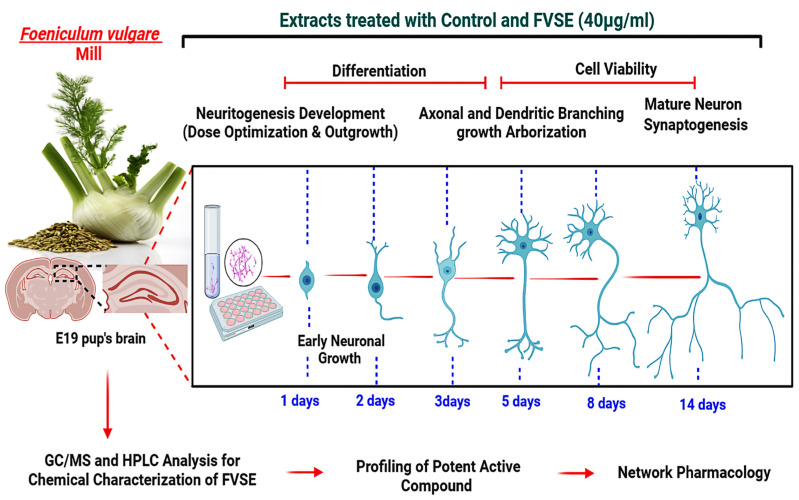
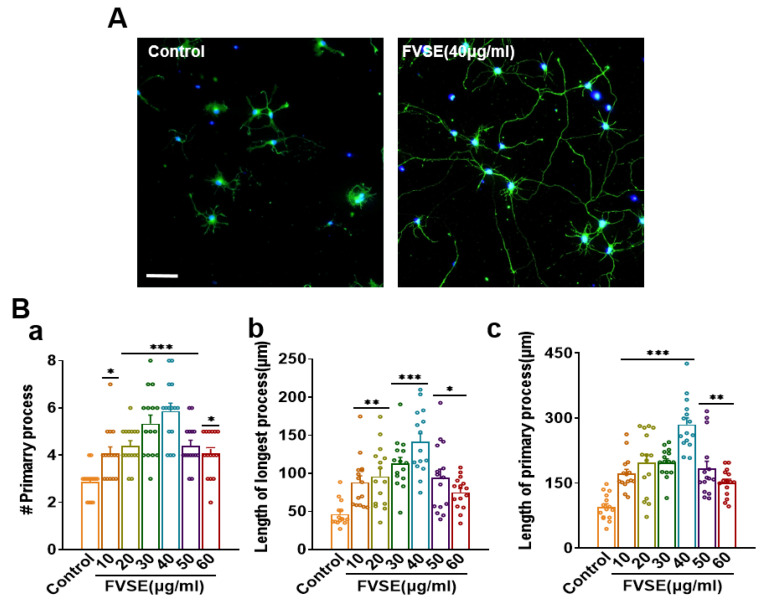
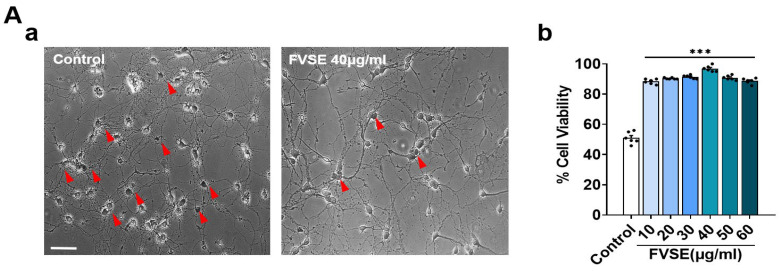
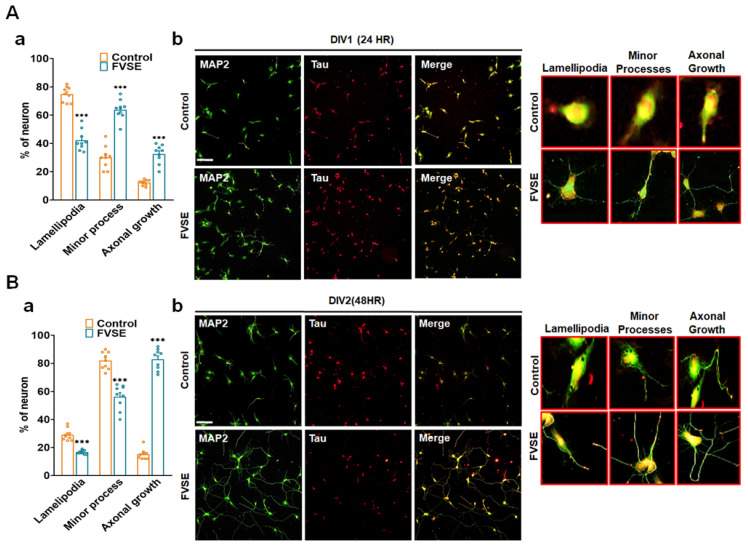
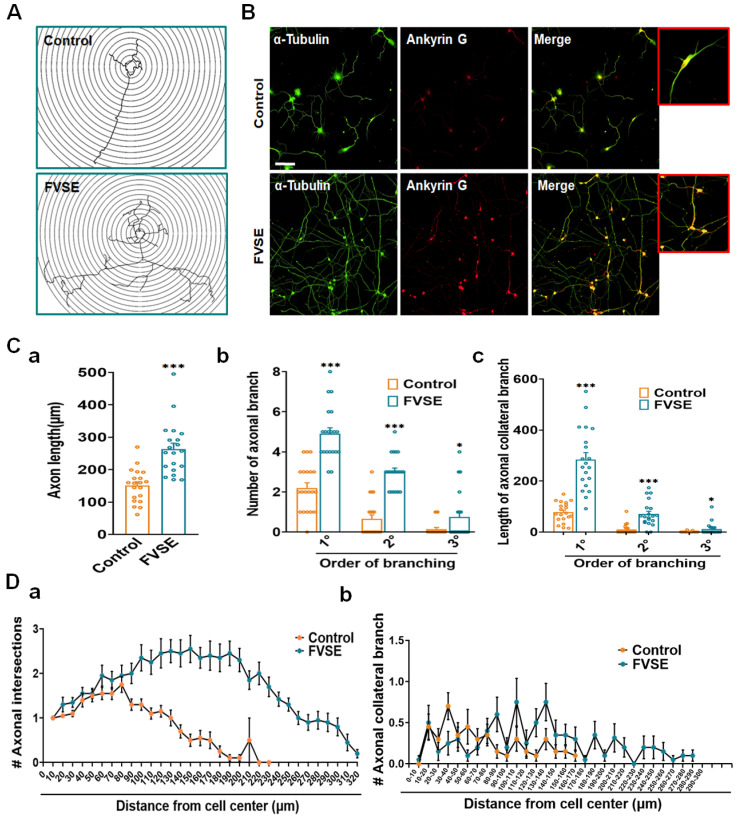
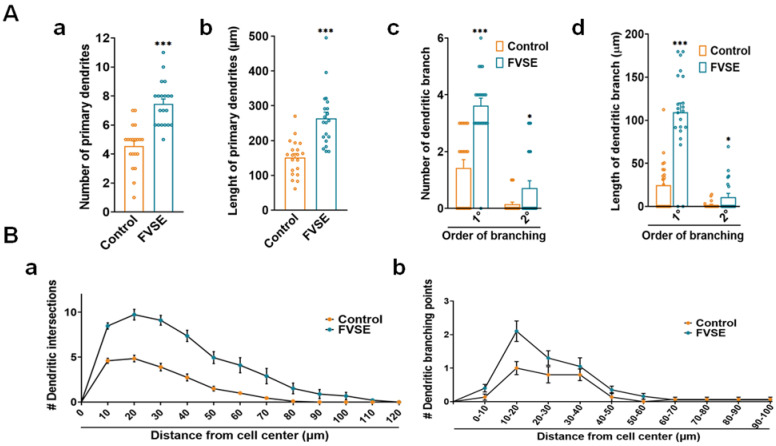
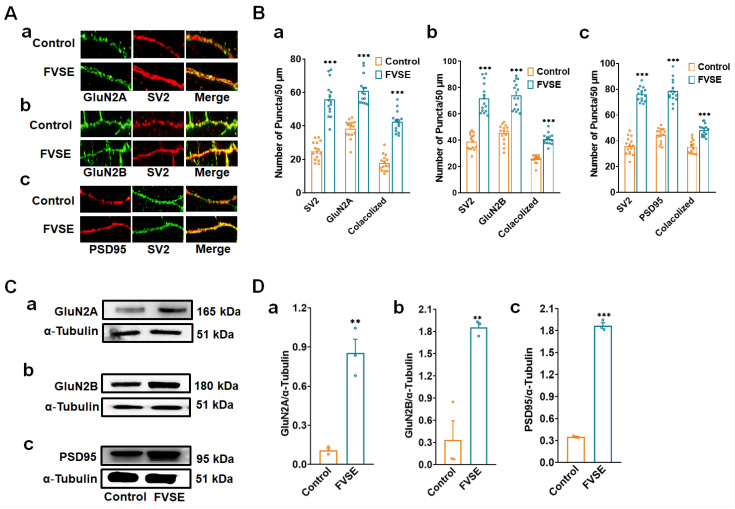
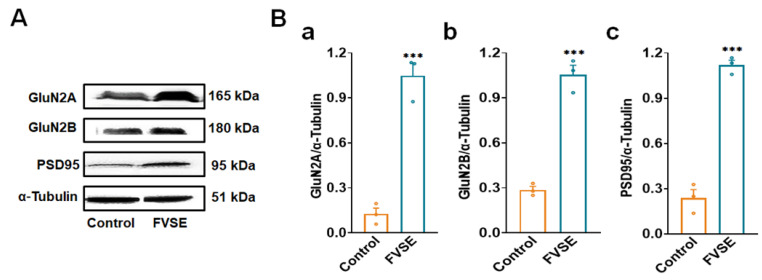
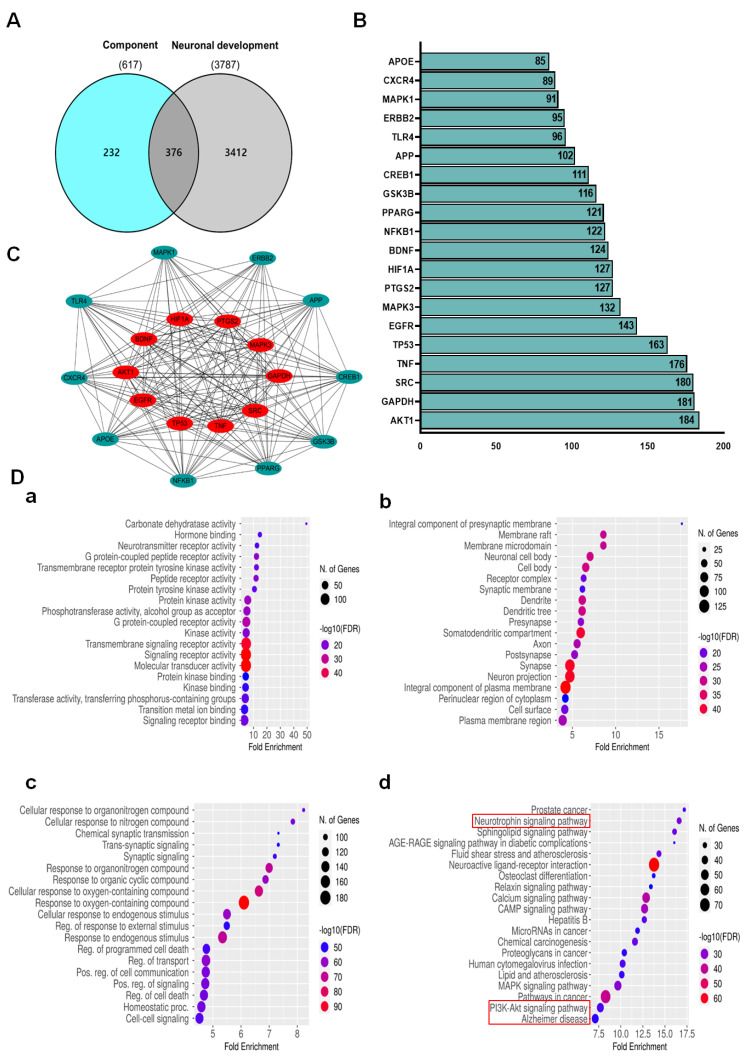
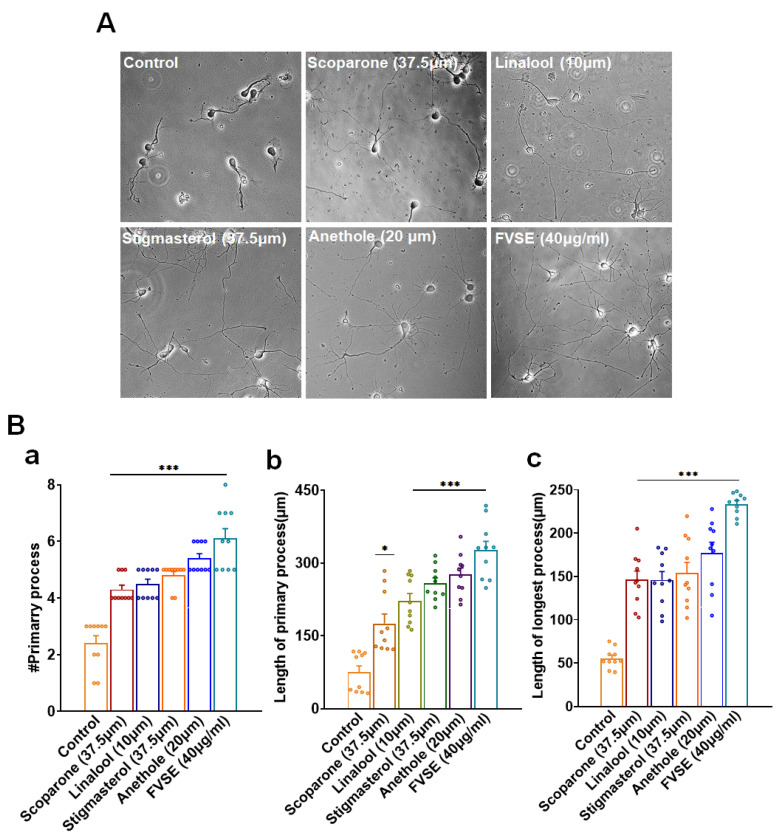
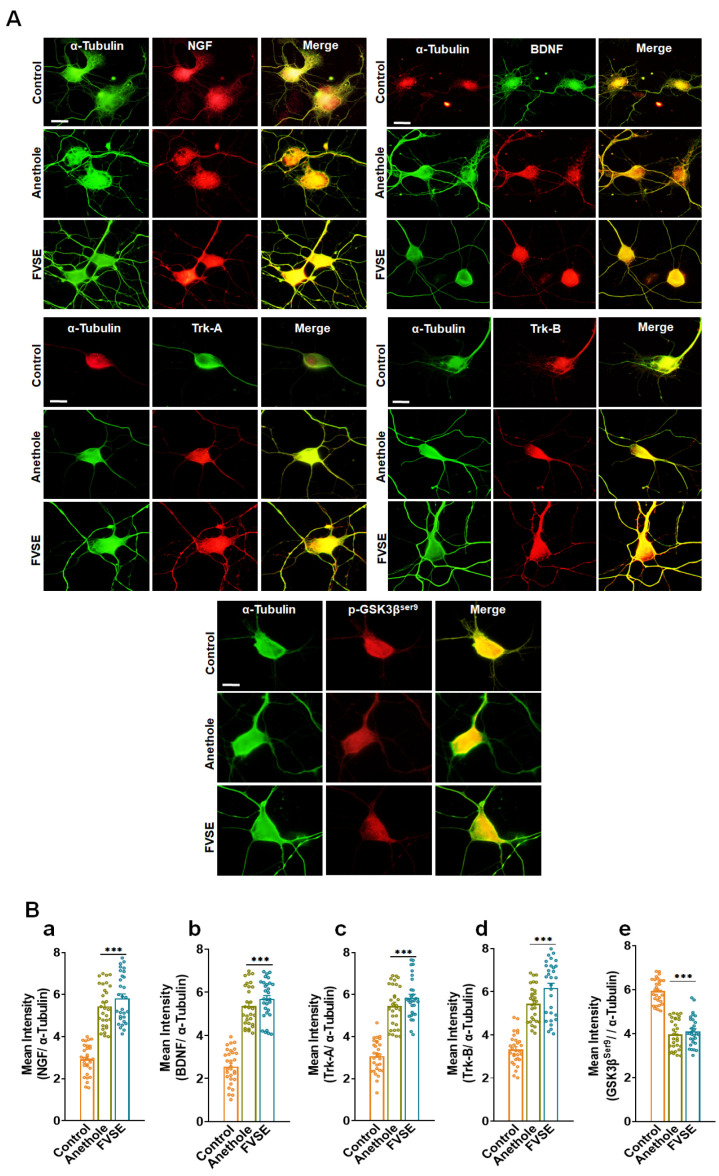
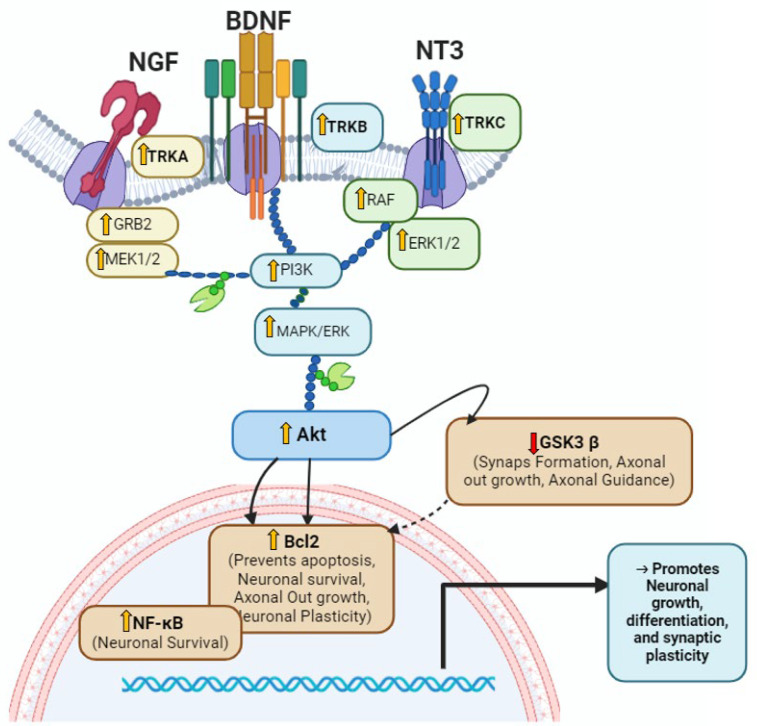
Foeniculum vulgare Mill, commonly known as fennel, is an aromatic herb traditionally used for culinary and medicinal purposes, with potential therapeutic effects on neurological disorders. However, limited research has focused on its neurotrophic impact, particularly on neuronal maturation and synaptic development. This study investigates the neurotrophic effects of F. vulgare ethanol extracts (FVSE) on the maturation of rat primary hippocampal neurons. Results show that FVSE and its prominent component, anethole, significantly promote neurite outgrowth in a dose-dependent manner. Optimal axonal and dendritic growth occurred at concentrations of 40 µg/mL FVSE and 20 µM anethole, respectively, without causing cytotoxicity, underscoring the safety of FVSE for neuronal health. Additionally, FVSE enhances the formation of synapses, essential for neuronal communication. Network pharmacology analysis revealed that FVSE components influence critical neurotrophic pathways, including PI3K-AKT and Alzheimer's disease pathways. Specifically, FVSE modulates key proteins, including tropomyosin receptor kinase (Trk), glycogen synthase kinase 3 (GSK3βser9), phosphatidylinositol 3-kinase (PI3K), and extracellular signal-regulated protein kinase (Erk1/2). Anethole was found to play a key role in regulating these pathways, which was confirmed by immunocytochemistry experiments demonstrating its effect on promoting neuronal growth and synaptic development. In conclusion, this study highlights the neurotrophic properties of FVSE, with anethole emerging as a critical bioactive compound. These findings provide valuable insights into the therapeutic potential of fennel in treating neurological disorders, offering a basis for future research into interventions promoting neuronal growth and survival.

Keywords: Foeniculum vulgare Mill (FVSE); PI3K-AKT signaling pathway; anethole; hippocampal neurons; neurite outgrowth; neurodegenerative diseases; neurotrophic effects; neurotrophin signaling pathway; synaptic development.


Conflict of interest statement

The authors declare no conflicts of interest.

Figures

Figure 1
Figure 1
Diagram illustrating the evaluation of FVSE on hippocampal neurons, covering stages from chemical analysis (GC/MS and HPLC) to neuronal differentiation, growth, and synaptogenesis under FVSE (40 µg/mL) treatment.
Figure 2
Figure 2
Neurite Outgrowth Quantification in FVSE-treated Neurons: Hippocampal neurons were cultured for three days and treated with FVSE at varying concentrations. Immuno-stained images illustrate neurite outgrowth, with representative images comparing FVSE (40 μg/mL) and vehicle treatments. Morphometric analysis assessed the number of neurites, total neurite length, and the length of the longest neurite. Statistical significance was determined by one-way ANOVA, followed by Tukey’s post hoc test (* p < 0.05, ** p < 0.01, *** p < 0.001). Each experiment was replicated three times (n = 3), with 10 neurons per replicate. Data are presented as Mean ± S.E.M.
Figure 3
Figure 3
Effects of FVSE on Neuronal Cell Viability. (A) Trypan blue-stained images showing viable neurons, with dead neurons indicated by red arrows in panel (a). The bar graph (b) illustrates the percentage of surviving cells after treatment with varying concentrations of FVSE (10–60 μg/mL). The scale bar represents 50 μm. Neuronal viability was determined by counting the number of unstained (live) cells relative to the total number of assessed cells (living and dead). Results were analyzed using one-way analysis of variance (ANOVA) and are presented as mean ± standard error of the mean (SEM) from three independent studies (n = 6, with 400–500 neurons per study). Statistical significance is indicated by *** p < 0.001.
Figure 4
Figure 4
During the initial stages of neuronal differentiation, FVSE was applied at a concentration of 40 μg/mL to assess early developmental maturation. Neurons were fixed at DIV1 and DIV2 and stained with antibodies for MAP2 (green) and tau (red) under consistent culture conditions throughout the experiment. (A(-b)) Representative fluorescence image showing early development at 24 h (DIV1), with insets representing normal developmental stages: Stage 1 (lamellipodia formation), Stage 2 (minor process formation), and Stage 3 (neurite outgrowth). (A(-a)) Statistical analysis displaying the percentage of neurons reaching each developmental stage at the corresponding time points. (B(-b)) Representative fluorescence images taken at 48 h (DIV2), along with the corresponding statistical analysis (B(-a)). Scale bars represent 50 μm and 10 μm (insets). Values in the bar graphs are presented as mean ± SEM from 300 to 400 neurons. Statistical significance compared to the vehicle is indicated by *** p < 0.001.
Figure 5
Figure 5
FVSE Enhances Axon Morphogenesis in Hippocampal Neurons. Hippocampal neurons were cultured for 5 days under the conditions described in Figure 2. After culture, cells were fixed and subjected to double immunostaining with ankyrin G (red) and α-tubulin (green). Ankyrin G, located at the axon initial segment (AIS), was used to identify axons, while α-tubulin marked dendrites. Representative fluorescence images of DIV5 cultures were used to assess neuronal morphology, with a scale bar of 50 μm. Morphometric analysis includes (A) sholl analysis and (B) immune-fluorescent images comparing FVSE-treated and control neurons. Quantitative measurements showed significant increases in FVSE-treated neurons for (C(-a)) axon length, (C(-b)) number of axonal branches by branching order, and (C(-c)) axonal collateral branch length by branching order. Sholl analysis also highlighted enhanced axonal complexity in FVSE-treated neurons, as observed in (D(-a)) the number of axonal intersections and (D(-b)) the total length of axonal branches. Data are presented as mean ± SEM (from three independent biological replicates). Statistical significance compared to the control is indicated by * p < 0.05 and *** p < 0.001 (Student’s t-test).
Figure 6
Figure 6
FVSE Promotes Dendritic Morphogenesis in Neurons. Representative photomicrographs for dendritic morphogenesis, similar to those in Figure 5B, show the differences between FVSE-treated and control neurons. Morphometric analysis includes (A(-a)) the number of primary dendrites, (A(-b)) the total length of primary dendrites, (A(-c)) the number of dendritic branches, and (A(-d)) the total length of dendritic branches. Beyond that, Sholl analysis illustrates (B(-a)) the number of dendritic intersections and (B(-b)) the branching points at various distances from the cell center. Bar graphs present mean values ± S.E.M. (n = 3, 10 neurons per group). Statistical significance relative to the vehicle control is denoted by * p < 0.05 and *** p < 0.001.
Figure 7
Figure 7
Impact of FVSE on Synaptic Connections. (A) Fluorescence microscopy images illustrating synaptic connections with dual labeling of SV2 (green) and NMDA receptor subunits (GluN2A and GluN2B) or PSD95 (red), showing co-localization (yellow puncta) in control and FVSE-treated neurons. Panels a–c show the synaptic co-localization of SV2 with GluN2A, GluN2B, and PSD95, respectively, highlighting an increase in synapse density with FVSE treatment. The scale bar represents 2 µm. (B) Quantification of puncta density for SV2 and each respective marker in a 50 µm segment. Panels (B(-a))–(B(-c)) display the density of SV2 co-localized with GluN2A, GluN2B, and PSD95, respectively, showing significant increases in co-localized puncta in FVSE-treated neurons compared to controls. (C) Immunoblotting analysis of neuronal lysates from DIV14, verifying the expression levels of GluN2A, GluN2B, and PSD95 in FVSE-treated versus control neurons, with α-tubulin as a loading control. Panels (C(-a))–(C(-c)) present the immunoblotting results for GluN2A, GluN2B, and PSD95, respectively, with increased expression in FVSE-treated neurons. (D) Bar graphs quantifying the relative intensity of GluN2A, GluN2B, and PSD95 normalized to α-tubulin, as shown in panels (D(-a))–(D(-c)). These results demonstrate a significant upregulation of synaptic components in FVSE-treated neurons, supporting enhanced synaptic connectivity and plasticity. Statistical data are presented as mean ± standard error of the mean (S.E.M.) from three independent experiments (n = 3, with 10 neurons per experiment). Student’s t-tests were used to determine statistical significance (** p < 0.01 and *** p < 0.001).
Figure 8
Figure 8
Analysis of Synaptic Protein Expression in the Cortex of 5-Week-Old ICR Mice Treated with FVSE. (A) Representative Western blot images showing the levels of GluN2A, GluN2B, PSD95, and the loading control α-Tubulin in cortical tissue from control and FVSE-treated groups. (B) Quantitative analysis of Western blot band intensity normalized to α-Tubulin for (a) GluN2A, (b) GluN2B, and (c) PSD95. Data are expressed as mean ± S.E.M. from four mice per group. Statistically significant differences compared to the control group are indicated by *** p < 0.001 (Student’s t-test).
Figure 9
Figure 9
Network and Enrichment Analysis of FVSE Bioactive Compounds and Neuronal Development Targets. (A) Venn diagram showing the overlap between genes associated with FVSE bioactive compounds and those involved in neuronal development, identifying 376 common genes. (B) Protein-protein interaction (PPI) network of the 20 common genes, with key hub genes highlighted in red, including AKT1, SRC, and TP53. (C) Bar chart displaying the top 20 genes related to neuronal development, with critical genes labeled. (D) Dot plots representing enrichment analysis of common target genes, showing significant involvement in (a) biological processes, (b) cellular components, (c) molecular functions, and (d) KEGG pathways, highlighting pathways such as Neurotrophin signaling, PI3K-AKT signaling, and Alzheimer’s disease pathways.
Figure 10
Figure 10
(A) Bright-field images illustrating the neuritogenetic effects of various treatments, including Scoparone (37.5 μM), Linalool (10 μM), Stigmasterol (37.5 μM), Anethole (20 μM), and FVSE (40 μg/mL), compared to the control. Neurite outgrowth is visible across the different treatments, with the scale bar representing 50 μm. (B) Quantitative analysis of morphometric parameters, including (a) the number of primary neurites per neuron, (b) the length of the primary neurites, and (c) the length of the longest neurite. Data are presented as the mean ± standard error of the mean (S.E.M.) from three independent experiments (n = 3, with 10 neurons per experiment). Statistical significance was determined using one-way analysis of variance (ANOVA), with * p < 0.05 and *** p < 0.001 indicating levels of significance.
Figure 11
Figure 11
Immunofluorescence Characterization of Neurotrophin Signaling Proteins in Primary Cultured Neurons. (A) Representative fluorescence images of neurons labeled with α-tubulin (green) as a structural marker, alongside neurotrophin proteins (red): NGF, BDNF, Trk-A, Trk-B, and GSK3βser9. Merged images show areas of co-localization (yellow), indicating overlap between α-tubulin and the specific neurotrophin markers. Scale bar represents 50 µm. (B) Quantitative analysis of mean fluorescence intensity for neurotrophin markers relative to α-tubulin expression: (a) NGF, (b) BDNF, (c) Trk-A, (d) Trk-B, and (e) GSK3βser9. Data are expressed as mean ± S.E.M. from three independent experiments with 30 neurons per group. Statistical significance is denoted by *** p < 0.001 (Student’s t-test).
Figure 12
Figure 12
The diagram illustrates the neurotrophic activity of FVSE via activation of the Trk-B receptor in the Neurotrophin signaling pathway. This activation triggers the PI3K/Akt pathway, which regulates Bcl2, NF-κB, and GSK3βser9 to promote neuronal survival, differentiation, and synaptic plasticity. Solid arrows represent activation, and blunt arrows indicate inhibition.

Similar articles

References

    1. Ivraghi M.S., Zamanian M.Y., Gupta R., Achmad H., Alsaab H.O., Hjazi A., Romero-Parra R.M., Alwaily E.R., Hussien B.M., Hakimizadeh E. Neuroprotective effects of gemfibrozil in neurological disorders: Focus on inflammation and molecular mechanisms. CNS Neurosci. Ther. 2024;30:e14473. doi: 10.1111/cns.14473. - DOI - PMC - PubMed
    1. Morton H., Kshirsagar S., Orlov E., Bunquin L.E., Sawant N., Boleng L., George M., Basu T., Ramasubramanian B., Pradeepkiran J.A., et al. Defective mitophagy and synaptic degeneration in Alzheimer’s disease: Focus on aging, mitochondria and synapse. Free Radic. Biol. Med. 2021;172:652–667. doi: 10.1016/j.freeradbiomed.2021.07.013. - DOI - PubMed
    1. Ashique S., Pal R., Sharma H., Mishra N., Garg A. Unraveling the Emerging Niche Role of Extracellular Vesicles (EVs) in Traumatic Brain Injury (TBI) CNS Neurol. Disord.-Drug Targets-CNS Neurol. Disord. 2024;23:1357–1370. doi: 10.2174/0118715273288155240201065041. - DOI - PubMed
    1. Adamu A., Li S., Gao F., Xue G. The role of neuroinflammation in neurodegenerative diseases: Current understanding and future therapeutic targets. Front. Aging Neurosci. 2024;16:1347987. doi: 10.3389/fnagi.2024.1347987. - DOI - PMC - PubMed
    1. Alkahtani S., Al-Johani N.S., Alarifi S. Mechanistic insights, treatment paradigms, and clinical progress in neurological disorders: Current and future prospects. Int. J. Mol. Sci. 2023;24:1340. doi: 10.3390/ijms24021340. - DOI - PMC - PubMed

MeSH terms

LinkOut - more resources