. 2024 Nov 26;25(23):12706.
doi: 10.3390/ijms252312706.

Anorectal Remodeling in the Transitional Zone with Increased Expression of LGR5, SOX9, SOX2, and Keratin 13 and 5 in a Dextran Sodium Sulfate-Induced Mouse Model of Ulcerative Colitis

Affiliations

Anorectal Remodeling in the Transitional Zone with Increased Expression of LGR5, SOX9, SOX2, and Keratin 13 and 5 in a Dextran Sodium Sulfate-Induced Mouse Model of Ulcerative Colitis

Mio Kobayashi et al. Int J Mol Sci. .

Abstract

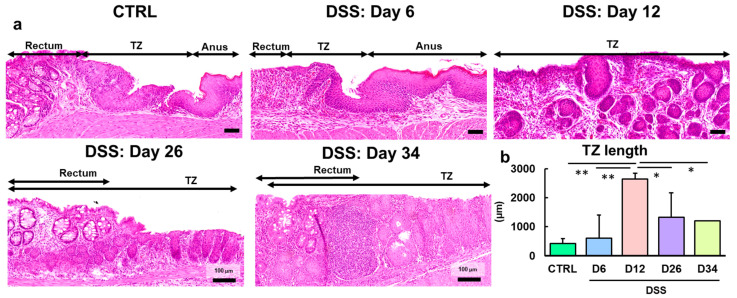
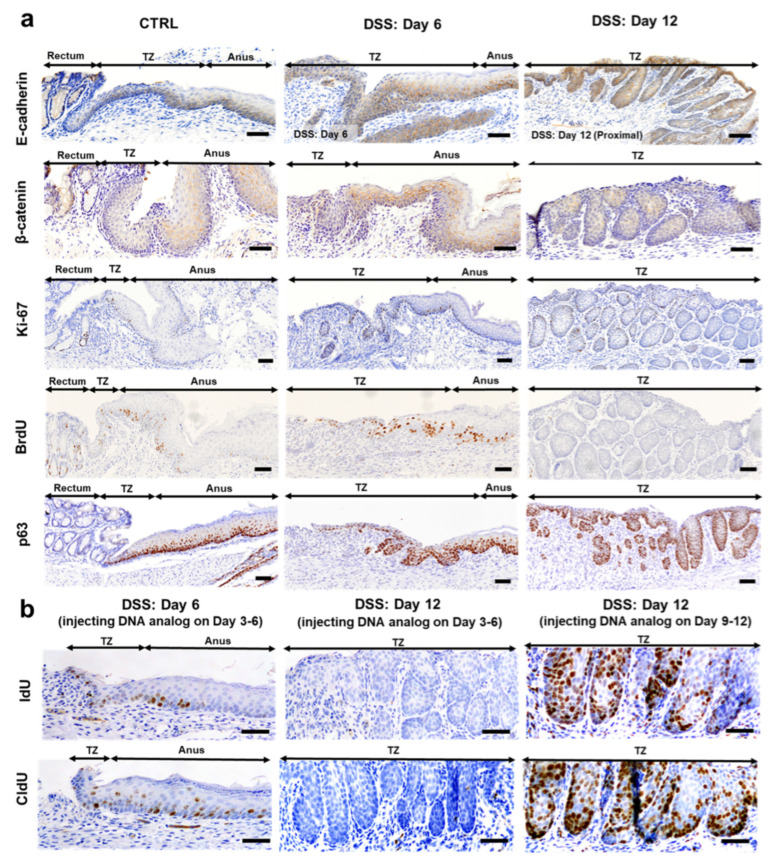
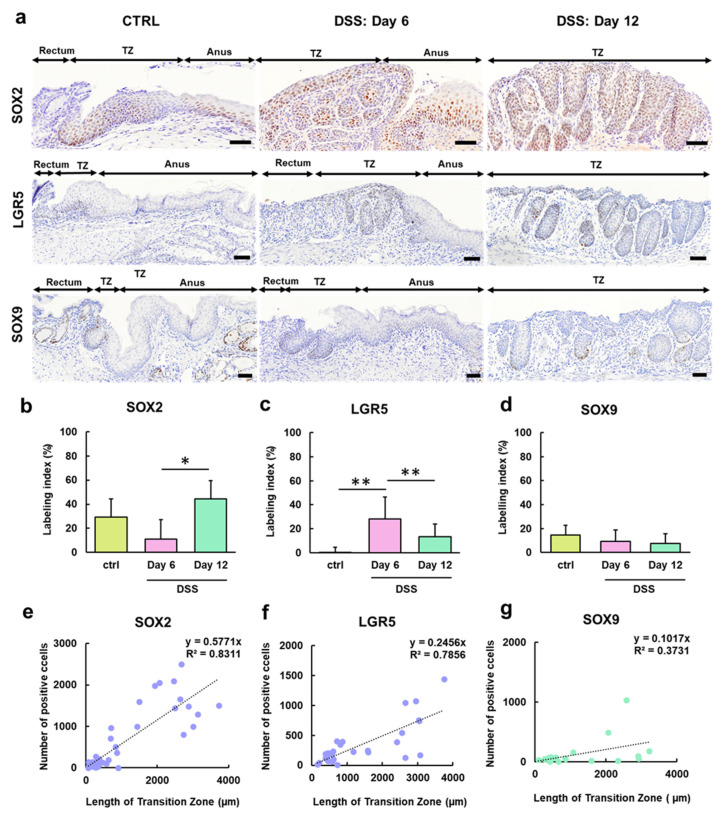
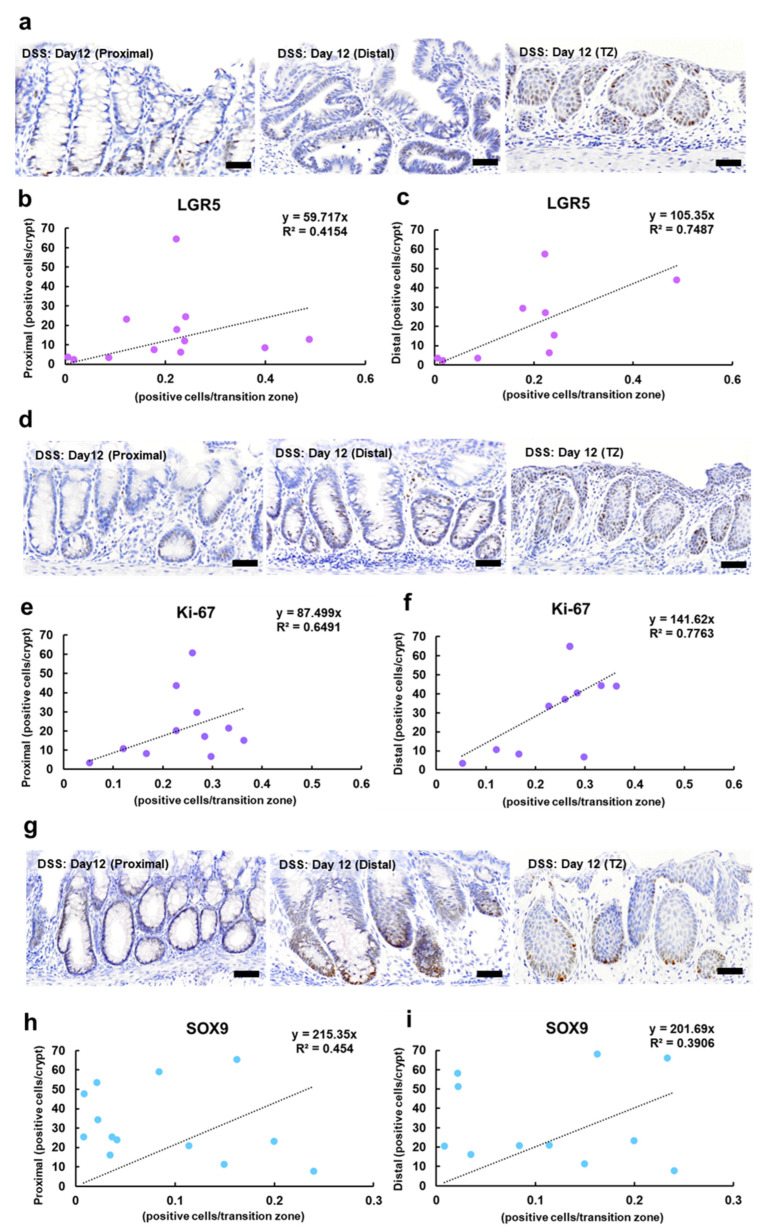
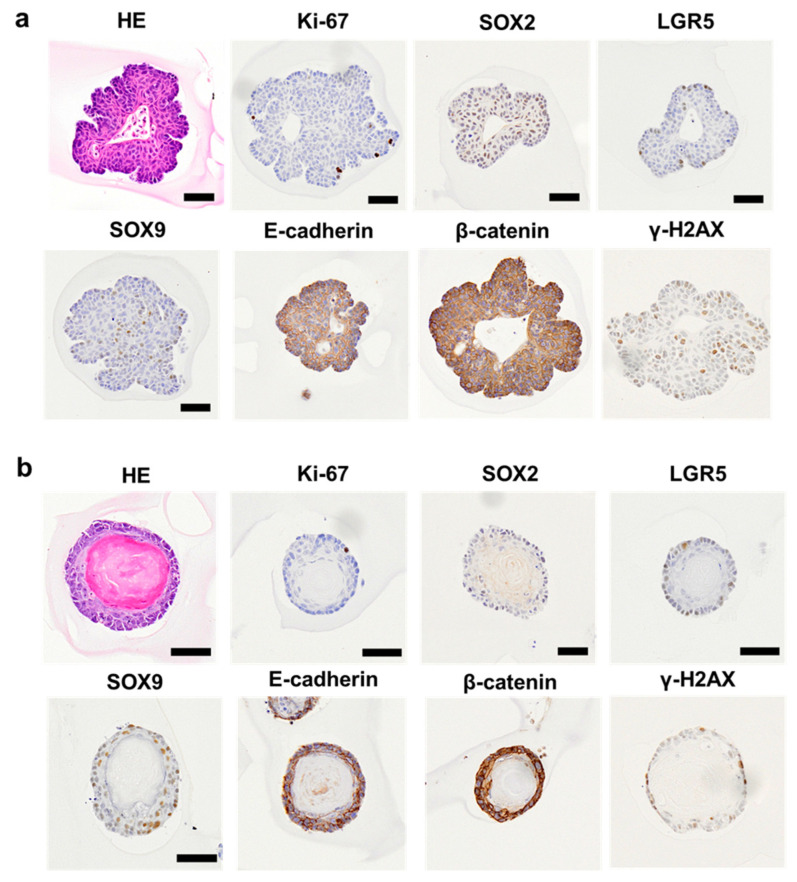
Although hyperplasia of the anorectal transitional zone (TZ) has been reported in mouse models of ulcerative colitis, the mechanisms underlying this phenomenon are not fully understood. We characterized keratin subtypes and examined the expression of stem cell markers in the TZ. Dextran sodium sulfate-treated mice showed abnormal repair of the anorectal region, which consisted of mixed hyperplastic TZ and regenerating crypts. Liquid chromatography-tandem mass spectrometry from the paraffin-embedded TZ in the treated mice revealed that the major keratins were type I cytokeratin (CK)13 and type II CK5, but notable expression of type I CK10 and CK42 and type II CK1, CK4, CK6a, CK8, and CK15 was also detected. Hyperplastic TZ was characterized by the expression of tumor protein 63, sex-determining region Y-box 2 (SOX2), SOX9, and leucine-rich repeat-containing G-protein coupled receptor 5 (Lgr5). Lgr5 was highly expressed in the TZ in the early stages of colitis, followed by higher expression levels of SOX2. The TZ-derived organoids expressed LGR5, SOX2, and SOX9. The present study suggests that transitional zones showing abnormal keratin assembly and stem cell activation may interfere with rectal crypt regeneration, leading to pathological anorectal remodeling in severe colitis.

Keywords: LGR5; SOX2; SOX9; mouse; transitional zone; ulcerative colitis.


Conflict of interest statement

The authors declare no conflicts of interest.

Figures

Figure 1
Figure 1
Morphological characterization of the TZ in the control and DSS-treated groups. (a) Representative images of the TZ in the control mice and mice administered 4% or 5% DSS in drinking water for 6 days (Day 6), followed by withdrawal of DSS for 6 days (Day 12), 20 days (Day 26), and 28 days (Day 34). In the control mice, the TZ with non-keratinizing squamous epithelium was observed between the rectum with crypts and the anus with keratinizing squamous epithelium. In the DSS-treated mice, the non-keratinizing squamous epithelium covered the ulcer lesions in the rectum on Day 6 and proliferated intensely toward the depths on Day 12. On Days 26 and 34, pathological remodeling was shown as mixed with regenerative crypts (light blue triangles) and the hyperplastic TZ (yellow triangles) in the ulcer regions (see Figure S2). Hematoxylin and eosin stain. Bar = 50 (CTRL, Days 6 and 12) or 100 µm (Days 26 and 34). (b) Comparison of TZ lengths in the control and DSS-treated groups at each time point. The mice were treated with 5% DSS for 6 days and euthanized on days 6 and 12. The other mice were treated with 4% DSS for 6 days and euthanized on days 26 and 34. N = 3 (CTRL), 6 (D6), 9 (D12), 3 (D26), and 2 (D34). *, ** Significant differences between each time point or region (p < 0.05 or 0.01, Tukey–Kramer multiple comparison test). CTRL, control; DSS, dextran sodium sulfate; D6, Day 6; D12, Day 12; D26, Day 26; D34, Day 34; TZ, transitional zone.
Figure 2
Figure 2
Immunohistochemical analyses of cell adhesion, cell proliferation, and epithelial stem (basal) cell markers in the TZ in the control and DSS-treated groups. (a) Representative images of the expression of E-cadherin, β-catenin, Ki-67, and p63 and BrdU labeling in the control mice and mice administered 5% DSS in drinking water for 6 days (Day 6) followed by withdrawal of DSS for 6 days (Day 12). Cell adhesion proteins E-cadherin and β-catenin are less or weakly expressed in comparison with the expression levels in the anus. Ki-67 is expressed in the basal layers of crypts, TZ, and anus, and BrdU is labeled in the control and DSS-treated groups on Day 6, but not on Day 12, when injected twice on days 4 and 5 (see text Experiment III for BrdU labeling). p63 is highly expressed in the basal and suprabasal layers in the TZ and anus, but not in the crypts. The positive signals are visualized with 3,3′-diaminobenzidine as a chromogen (brown), followed by counterstaining with hematoxylin. Bar = 50 µm. (b) IdU or CldU is labeled in the TZ on Day 6, but not on Day 12, when injected intraperitoneally at 8 h intervals from Days 3 to 6. Both analogs are labeled in the TZ on Day 12 when injected intraperitoneally at 8 h intervals from Days 9 to 12 (see text Experiment IV for CldU, BrdU, and IdU labeling). BrdU, 5-bromo-2′-deoxyuridine; CldU, 5-chloro-2′-deoxyuridine; IdU, 5-Iodo-2′-deoxyuridine; DSS, dextran sodium sulfate; p63, tumor protein 63; TZ, transitional zone.
Figure 3
Figure 3
Immunohistochemical analysis of stem cell markers in the TZ in the control and DSS-treated groups. (a) Representative images of the expression of SOX2, LGR5, and SOX9 in the control mice and mice administered 5% DSS in drinking water for 6 days (Day 6) followed by withdrawal of DSS for 6 days (Day 12). SOX2 is highly expressed in the TZ and anus. Labeling indices of SOX2 (b), LGR5 (c), and SOX9 (d) in the TZ. Scatter plots with correlation coefficient (R2) and linear function (y = ax) between the number of cells showing positive results for SOX2 (e), Lgr5 (f), and SOX9 (g) and the length of the TZ. *, ** Significant differences between each time point or region (p < 0.05 or 0.01, Tukey–Kramer multiple comparison test). DSS, dextran sodium sulfate; LGR5, leucine-rich repeat-containing G-protein-coupled receptor 5; SOX2, sex-determining region on Y-box transcription factor 2; SOX9, sex-determining region on Y-box transcription factor 9; TZ, transitional zone.
Figure 4
Figure 4
Immunohistochemical analysis of stem cell and cell proliferation markers in the crypts and TZ in the DSS-treated mice. Representative images showing nuclear expression of LGR5 (a), Ki-67 (d), and SOX9 (g) in the TZ of the treated mice administered 5% DSS in drinking water for 6 days (Day 6), followed by withdrawal of DSS for 6 days (Day 12). The positive signals are visualized with 3,3′-diaminobenzidine as the chromogen (brown), followed by counterstaining with hematoxylin. Bar = 50 µm. Scatter plots with correlation coefficient (R2) and linear function (y = ax) between the number of positive cells in the crypts and TZ in the labeling of LGR5, proximal colon (b), distal colon (c); Ki-67, proximal colon (e), distal colon (f); and SOX9, proximal colon (h), distal colon (i). DSS, dextran sodium sulfate; LGR5, leucine-rich repeat-containing G-protein-coupled receptor 5; SOX9, sex-determining region on Y-box transcription factor 9; TZ, transitional zone.
Figure 5
Figure 5
Morphological and immunohistochemical characterization of TZ- and anus-derived organoids. Representative images of organoids of non-keratinizing (a) and keratinizing squamous cells (b) in mice administered 4% DSS in drinking water for 6 days followed by the withdrawal of DSS for 21 days (Day 26). Organoids with non-keratinizing and keratinizing squamous cells were derived from the TZ and anus, respectively. Hematoxylin and eosin staining. Bar = 50 µm. Immunohistochemical expression of Ki-67, SOX2, LGR5, SOX9, E-cadherin, β-catenin, and γ-H2AX in TZ- (a) and anus-derived organoids (b). The positive signals are visualized with 3,3′-diaminobenzidine as a chromogen (brown), followed by counterstaining with hematoxylin. Bar = 50 µm. DSS, dextran sodium sulfate; γ-H2AX, phosphorylation of histone H2AX at serine 139; LGR5, leucine-rich repeat-containing G-protein-coupled receptor 5; SOX2, sex-determining region on Y-box transcription factor 2; SOX9, sex-determining region on Y-box transcription factor 9; TZ, transitional zone.
Figure 6
Figure 6
Some SOX2-retaining cells colocalize with SOX9 or LGR5-retaining cells. Representative images of TZ (ad) and organoids of a non-keratinizing squamous cell (e,f) in the treated mouse administered 4% DSS in drinking water for 6 days, followed by withdrawal of DSS for 6 days (Day 12: (ad) and 21 days (Day 26; (e,f)). Double immunofluorescence staining for SOX2 (Magenta) and SOX9 (Green) (a,b) or SOX2 (Magenta) and LGR5 (Green) (c,d) in TZ. Double immunofluorescence staining for SOX2 (Magenta) and SOX9 (Green) in the organoid (e,f). Nuclei were counterstained with DAPI (blue). Higher magnification of the region for indicated square (white line) in Figure 6b,d,f), with a white arrow showing colocalization (b’,d’,f’). SOX2 immunoreactivities in mice and organoids derived from TZ were observed in the nucleus as a diffuse pattern. LGR5 and SOX9 were mainly observed in the nucleus for a marginal region at TZ. The nuclei colocalized with SOX2 and SOX9 (SOX2+SOX9low cells) or SOX2 and LGR5 (SOX2+LGR5low cells) were shown as arrows (b’,d’,f’). Bar = 50 µm ((af) are the same sections) or 25 µm (b’,d’,f’). DSS, dextran sodium sulfate; LGR5, leucine-rich repeat-containing G-protein-coupled receptor 5; SOX2, sex-determining region on Y-box transcription factor 2; SOX9, sex-determining region on Y-box transcription factor 9; TZ, transitional zone.

Similar articles

Cited by

References

    1. Ramos T., Scott D., Ahmad S. An update on ocular surface epithelial stem cells: Cornea and conjunctiva. Stem Cells Int. 2015;2015:601731. doi: 10.1155/2015/601731. - DOI - PMC - PubMed
    1. Kubilus J.K., Zapater IMorales C., Linsenmayer T.F. The Corneal Epithelial barrier and its developmental role in isolating corneal epithelial and conjunctival cells from one another. Investig. Ophthalmol. Vis. Sci. 2017;58:1665–1672. doi: 10.1167/iovs.16-20737. - DOI - PMC - PubMed
    1. Jiang M., Li H., Zhang Y., Yang Y., Lu R., Liu K., Lin S., Lan X., Wang H., Wu H., et al. Transitional basal cells at the squamous-columnar junction generate Barrett’s oesophagus. Nature. 2017;550:529–533. doi: 10.1038/nature24269. - DOI - PMC - PubMed
    1. Yang E.J., Quick M.C., Hanamornroongruang S., Lai K., Doyle L.A., McKeon F.D., Xian W., Crum C.P., Herfs M. Microanatomy of the cervical and anorectal squamocolumnar junctions: A proposed model for anatomical differences in HPV-related cancer risk. Mod. Pathol. 2015;28:994–1000. doi: 10.1038/modpathol.2015.54. - DOI - PMC - PubMed
    1. Moshi J.M., Hoogduin K.J., Ummelen M., Henfling M.E.R., van Engeland M., Wouters K.A.D., Stoop H., Demers I., Looijenga L.H.J., Ramaekers F.C.S., et al. Switches of SOX17 and SOX2 expression in the development of squamous metaplasia and squamous intraepithelial lesions of the uterine cervix. Cancer Med. 2020;9:6330–6343. doi: 10.1002/cam4.3201. - DOI - PMC - PubMed

MeSH terms

LinkOut - more resources