. 2024 Nov 27;25(23):12731.
doi: 10.3390/ijms252312731.

Extracellular Vesicles from a Novel Chordoma Cell Line, ARF-8, Promote Tumorigenic Microenvironmental Changes When Incubated with the Parental Cells and with Human Osteoblasts

Affiliations

Extracellular Vesicles from a Novel Chordoma Cell Line, ARF-8, Promote Tumorigenic Microenvironmental Changes When Incubated with the Parental Cells and with Human Osteoblasts

Khoa N Nguyen et al. Int J Mol Sci. .

Abstract

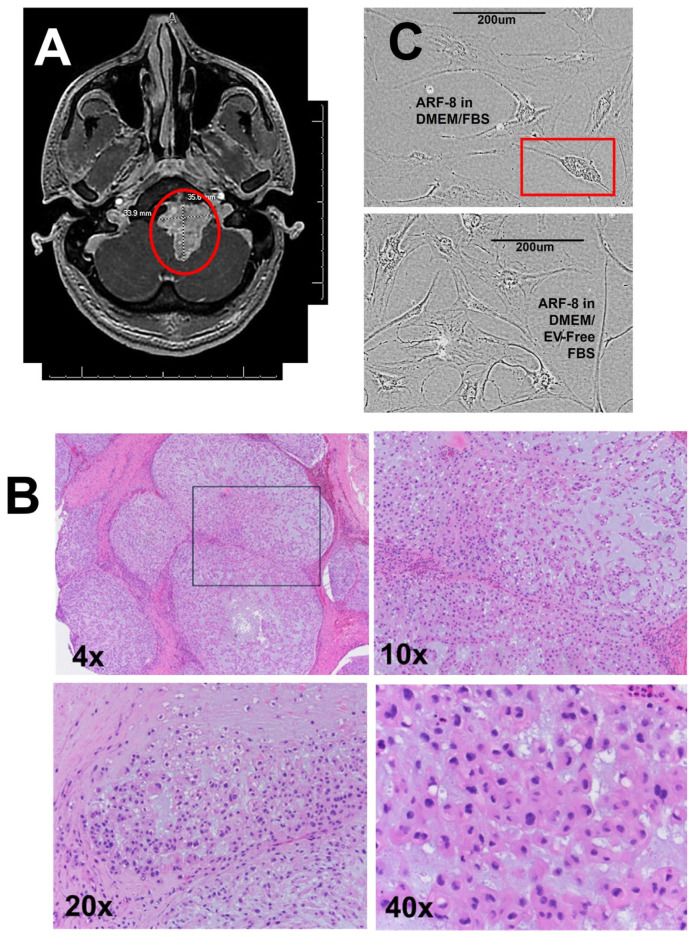
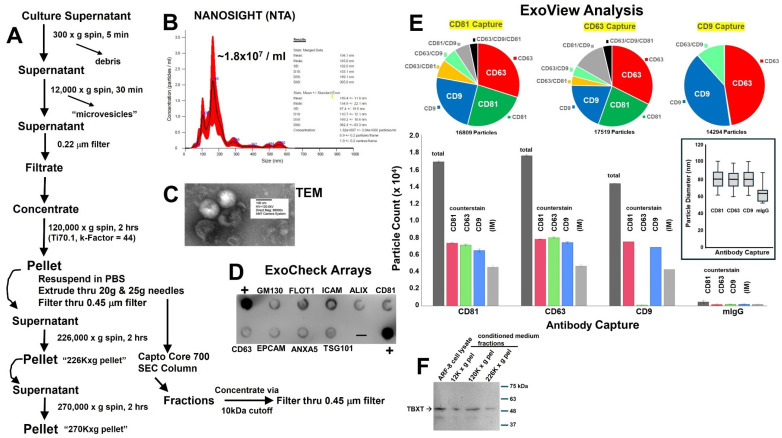
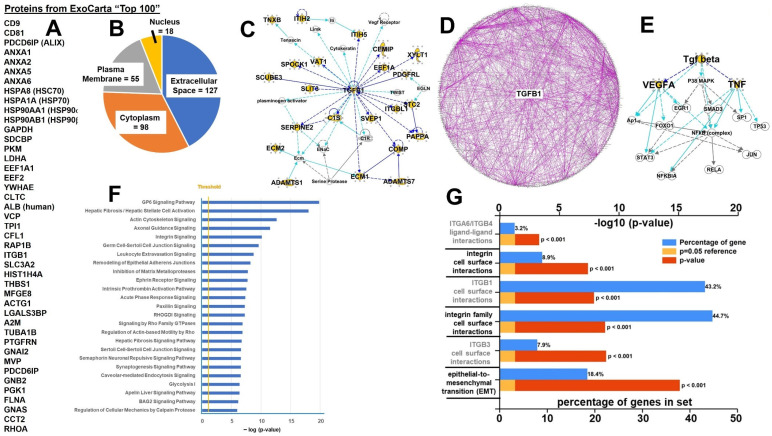
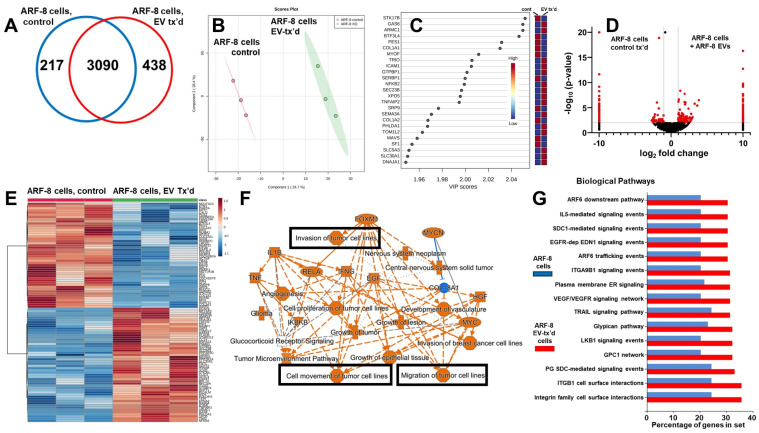
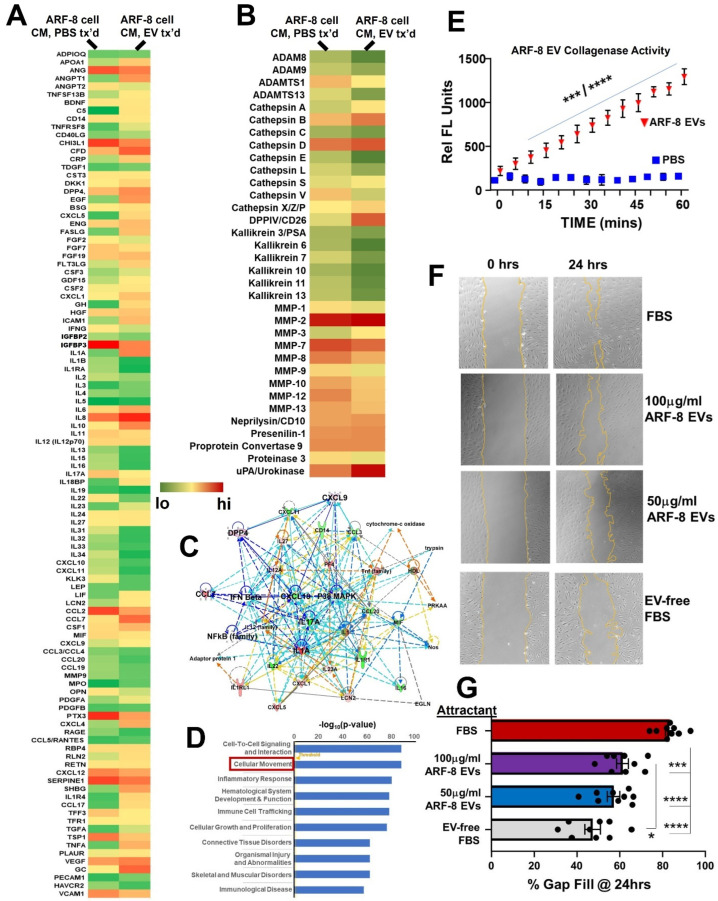
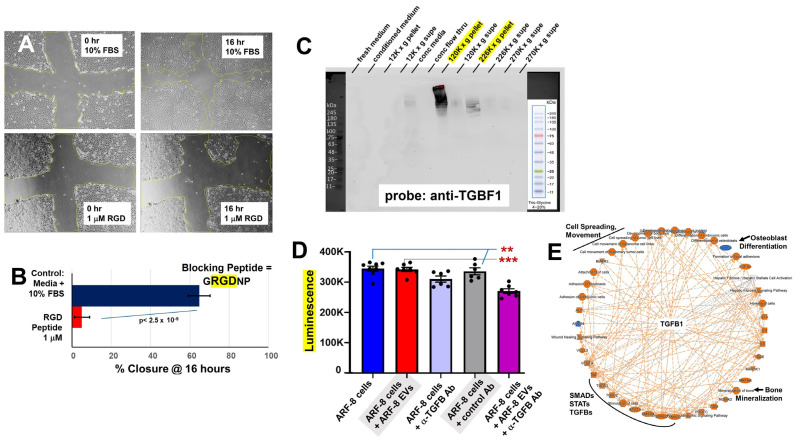
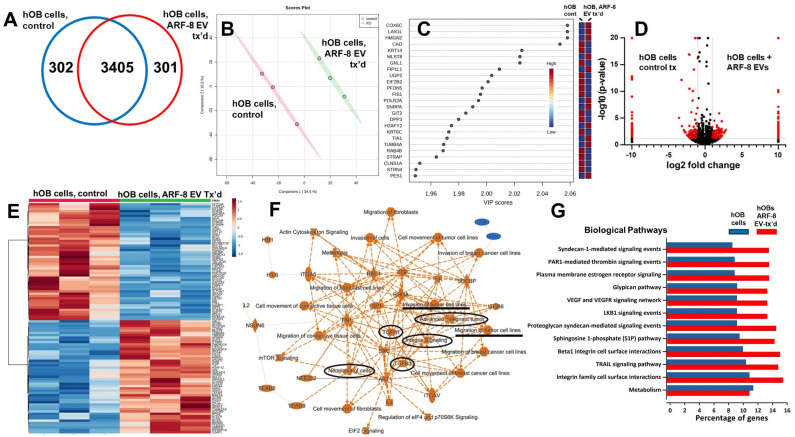
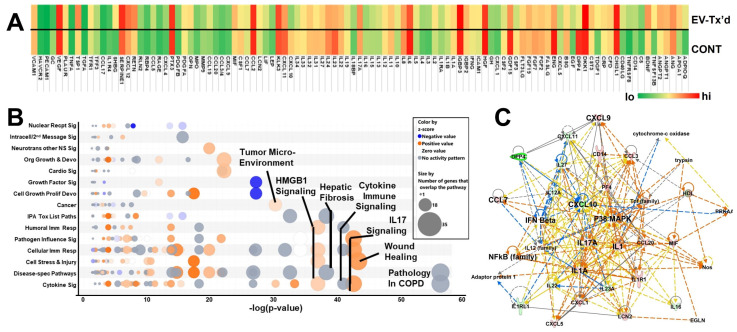
Chordomas are rare, generally slow-growing spinal tumors that nonetheless exhibit progressive characteristics over time, leading to malignant phenotypes and high recurrence rates, despite maximal therapeutic interventions. The tumors are notoriously resistant to therapies and are often located in regions that complicate achieving gross total resections. Cell lines from these tumors are rare as well. We cultured a new chordoma cell line (ARF-8) derived from an extensive clival chordoma that extended back to the cervical spine. We characterized the ARF-8 cellular and extracellular vesicle (EV) proteomes, as well as the impacts of ARF-8 EVs on the proteomes and secretomes of recipient cells (both ARF-8 and human osteoblasts) in autocrine and paracrine settings. Our proteomic analyses suggested roles for transforming growth factor beta (TGFB/TGFβ), cell-matrix interactions involving the epithelial-to-mesenchymal transition (EMT), and cell-extracellular matrix interactions in cell migration, consistent with a migratory/metastatic tumor phenotype. We demonstrated that ARF-8 tumor cell migration was dependent on general (arginine-glycine-aspartic acid [RGD]-based) integrin activity and that ARF-8 EVs could promote such migration. ARF-8 EVs also prompted proteomic/secretomic changes in human osteoblast cells, again with indications that cell-cell and cell-extracellular matrix interactions would be activated. All the characteristics typically associated with chordomas as cancers-migration and invasion, therapeutic resistance, metastatic potential-can be driven by tumor EVs. Overall, ARF-8 EVs promoted predicted tumorigenic phenotypes in recipient cells and suggested novel therapeutic targets for chordomas.

Keywords: cell line; chordoma; collagen; epithelial-to-mesenchymal transition (EMT); extracellular matrix; extracellular vesicles (EVs); integrins; migration; proteomics; secretome.


Conflict of interest statement

The authors declare no conflicts of interest. The funders had no role in the design of the study; in the collection, analyses, or interpretation of data; in the writing of the manuscript; or in the decision to publish the results.

Figures

Figure 1
Figure 1
ARF-8 surgical resection, immunohistochemistry, and cell line. (A) MRI with a red circle indicating the chordoma in the patient clivus. Longest dimensions were 33.9 mm in width, 35.6 mm in length. (B) Histological appearance of the chordoma with increasing magnification (4×, 10×, 20×, 40×). The inset from the 4× is shown at higher power in the 10×. The 20× and 40× images are from different slides. (C) Appearance of the ARF-8 cell line grown in DMEM+10% fetal bovine serum (FBS; top) and in DMEM+10% EV-free FBS (bottom). The blocked area shows a cell with the physaliphorous (bubbly) cytoplasm characteristic of chordomas.
Figure 2
Figure 2
ARF-8 EVs and extracellular particles. (A) Schematic of steps involved in EV/particle isolation. (B) Nanosight nanoparticle tracking analysis (NTA) of ARF-8 EVs (stats: merged data; mean: 197.7 nm, mode: 165.0 nm, SD: 102.6 nm). (C) Transmission electron microscopy (TEM) of ARF-8 EVs with scale bars listed. (D) ExoCheck arrays showing putative typical EV markers for lysed EVs from the ARF-8 cell line. “+” = positive control. (E) ExoView single-particle interferometric reflectance imaging sensing (SP-IRIS) with immunofluorescence counterstain; top row shows pie charts of proportions of counterstained CD81, CD63, and CD9 markers on immunocaptured EVs; bottom row shows particle counts by capture and counterstain (including negative control murine IgG); inset to right shows particle diameters based on antibody capture type. (F) Western blots of ARF-8 cell lysates and fractionated conditioned media extracellular pellets (12,000× p; 120,000× p; 226,000× p) probed with anti-brachyury/TBXT antibody.
Figure 3
Figure 3
ARF-8 EV proteomics. (A) Thirty-three ARF-8 EV proteins that are among the ExoCarta “Top 100” proteins most frequently found in that database (http://exocarta.org/exosome_markers_new, accessed on 20 November 2024). (B) Subcellular/extracellular derivation of ARF-8 EV proteins. (C) Ingenuity pathway analysis (IPA) highest scoring network “Connective Tissue Disorders, Dermatological Disease and Conditions, Developmental Disorder” (score = 39; 23 focus molecules). Note TGFB1 as a major node. Gold highlights = proteins identified in proteomics and secretome analyses. “Scores” are based on Fisher’s exact test, −log(p-value); “focus molecules” are considered focal point generators within the network. Number of genes illustrated was limited to 35 by the algorithm. IPA network legends (node and path design shapes, edges and their descriptions) are in Supplementary Figure S2. (D) Overlay of top 7 IPA-generated networks in radial view; again, TGFB1 is the central node. (E) IPA upstream analysis scored TGFB1 most significantly; the TGFB group mechanistic network is shown. (F) IPA-derived top 25 canonical pathways. Statistical significance “threshold” (gold line) = 1.25. (G) FunRich top biological pathways shown by statistical significance and percentage of identified genes in the overall dataset.
Figure 4
Figure 4
ARF-8 cellular proteomics without and with treatment by ARF-8 EVs. (A) Venn diagram showing unique and overlapping numbers of proteins identified. (B) Orthogonal partial least squares discriminant analysis (PLS-DA) score plot showing clustering and distinction between ARF-8 cell proteomics (controls vs. cells treated with ARF-8 EVs). (C) Variable importance in projection (VIP) scores indicating the variables’ (genes/proteins) driving the PLS-DA results. (D) Volcano graphs showing differential proteomic expression between control ARF-8 cells and ARF-8 cells treated with ARF-8 EVs. Data were generated in Scaffold 5 and presented using Prism 9.5. (E) Hierarchical clustering heatmaps from ANOVA statistical analyses utilized normalized data that were standardized by autoscaling features (top 100) with Euclidean distance measurements and clustered by ward; control ARF-8 cells, left; EV-treated ARF-8 cells, right. (F) IPA graphical summary of the ARF-8 proteomes from untreated vs. EV-treated cells; orange colors indicate putatively activated states and pathways, while blue predicts downregulation. Items of particular interest regarding cell motility are boxed in black. (G) Top 15 biological pathways generated in FunRich identified comparing proteomes of ARF-8 cells (blue bars) vs. ARF-8 cells treated with ARF-8 EVs (red bars), shown as the percentage of genes in the datasets. Data for B, C, and E were generated in Metaboanalyst 6.0.
Figure 5
Figure 5
ARF-8 cell secretome +/− incubation with ARF-8 EVs. (A) Secretome (cyto/chemokine array) heatmap of ARF-8 cell conditioned media (CM) from cells treated (“tx’d”) with PBS or treated with ARF-8 EVs. (B) Heatmap of secreted proteases from ARF-8 cells treated with PBS or treated with ARF-8 EVs. (C) Ingenuity pathway analysis (IPA) network #1, “Cellular Movement, Hematological System Development and Function, Immune Cell Trafficking” (score = 47; 22 focus molecules). (D) ARF-8 secretome top 10 (by statistical significance) diseases and biofunctions from IPA. Boxed is “Cellular Movement” as the second highest-scoring category. “Threshold” value for significance is shown in orange = 1.25. (E) ARF-8 EV collagenase/MMP activity compared with PBS. *** p < 0.001 vs. PBS up to 30 min timepoint; **** p < 0.0001 vs. PBS for 30–60 min timepoints. (F) Migration/scratch assay of ARF-8 cells filling the gap over 24 h. Attractants are fetal bovine serum (FBS, + control), ARF-8 EVs at two different concentrations, and EV-free FBS (baseline attractant). (G) Quantification of scratch assay. * p < 0.05; *** p < 0.001; **** p < 0.0001.
Figure 6
Figure 6
Integrins, TGFB, and EMT in ARF-8 cells. (A) Scratch closure assays with ARF-8 cells moving into the gap after 16 h treatment with either medium + 10% FBS (positive control) or in the presence of 1 μM GRGDNP peptide to block integrins. (B) Quantification of scratch closure after 16 h where RGD peptide strongly inhibited cell migration. (C) Western blot probing for TGFB1 of fractionated ARF-8 conditioned medium (30 μg for each fraction) showing reactivity in high-speed centrifuged pellets (marked in yellow, 120,000× g, and that supernatant further centrifuged at 226,000× g). Molecular weight markers on the blot are indicated and shown separately at left. (D) Treatment of ARF-8 EVs with anti-TGFB1 antibody 1D11 before EV incubation with ARF-8 cells reduced ATP production. ** p < 0.01 vs. conditions 1–4; *** p < 0.001 vs. conditions 2–4. (E) ARF-8 EMT signature proteome represented as an IPA graphical summary in radial format showing TGFB1 as the major central node with links to SMAD transcription factors, STAT signaling, cell migration, and osteoblast differentiation and bone mineralization upregulated activities.
Figure 7
Figure 7
Human osteoblast (hOB) cellular proteomics without (control, PBS-treated) and with ARF-8 EV treatment (tx’d). (A) Venn diagram showing unique and overlapping numbers of proteins identified. (B) Orthogonal partial least squares discriminant analysis (PLS-DA) score plot showing clustering and distinction between hOB cell proteomics (controls vs. cells treated with ARF-8 EVs). (C) Variable importance in projection (VIP) scores indicating the variables (genes/proteins) driving the PLS-DA results. (D) Volcano graphs showing differential proteomic expression between control hOB cells and hOB cells treated with ARF-8 EVs. Data were generated in Scaffold 5 and presented using Prism 9.5. (E) Hierarchical clustering heatmaps from ANOVA statistical analyses utilized normalized data that were standardized by autoscaling features (top 100) with Euclidean distance measurements and clustered by ward; control hOB cells, left; ARF-8 EV-treated hOB cells, right. (F) IPA graphical summary of the hOB proteomes from untreated vs. EV-treated cells; orange colors indicate putatively activated states and pathways, while blue predicts downregulation. Items of particular interest regarding cell motility, integrins, TGFBs, and neoplasia/malignancy are circled or underlined in black. (G) Top 12 biological pathways generated in FunRich identified comparing proteomes of hOB cells (blue bars) vs. hOB cells treated with ARF-8 EVs (red bars) shown as the percentage of genes in the datasets. Data for (B,C,E) were generated in Metaboanalyst 5.0.
Figure 8
Figure 8
hOB secretome following incubation with ARF-8 EVs. (A) Secretome (cyto/chemokine array) heatmap of hOB cell conditioned media (CM) from cells treated (“tx’d”) with PBS or treated with ARF-8 EVs. (B) Ingenuity pathway analysis (IPA) canonical pathway “Bubble Chart” generated from the protein quantification changes in the ARF-8 EV-treated hOB secretome (Figure 8A). Key pathways are denoted. The significance threshold (-log[p-value]) was set at 1.25. Blue indicates a negative activation z score; orange, positive, gray, no activity pattern. (C) IPA network #1, “Cellular Movement, Hematological System Development and Function, immune Cell Trafficking” (score = 47; 22 focus molecules).

Similar articles

References

    1. McMaster M.L., Goldstein A.M., Bromley C.M., Ishibe N., Parry D.M. Chordoma: Incidence and survival patterns in the United States, 1973–1995. Cancer Causes Control. 2001;12:1–11. doi: 10.1023/A:1008947301735. - DOI - PubMed
    1. Ulici V., Hart J. Chordoma. Arch. Pathol. Lab. Med. 2022;146:386–395. doi: 10.5858/arpa.2020-0258-RA. - DOI - PubMed
    1. International Agency for Research on Cancer . World Health Organization Classification of Tumours. 5th ed. Volume 3 IARC Publications; Lyon, France: 2020.
    1. International Agency for Research on Cancer . World Health Organization Classification of Tumours. 5th ed. Volume 3 IARC Publications; Lyon, France: 2020. WHO Classification of Tumours of Soft Tissue and Bone.
    1. Choi J.H., Ro J.Y. The 2020 WHO Classification of Tumors of Bone: An Updated Review. Adv. Anat. Pathol. 2021;28:119–138. doi: 10.1097/PAP.0000000000000293. - DOI - PubMed

LinkOut - more resources