. 2024 Nov 28;25(23):12782.
doi: 10.3390/ijms252312782.

Nidogen 2 Overexpression Promotes Hepatosteatosis and Atherosclerosis

Affiliations

Nidogen 2 Overexpression Promotes Hepatosteatosis and Atherosclerosis

Ishita Kathuria et al. Int J Mol Sci. .

Abstract

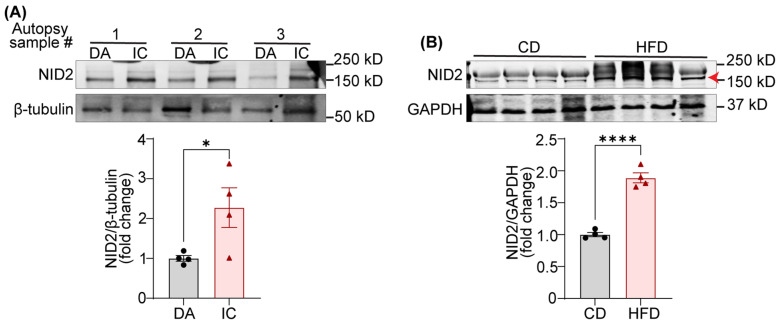
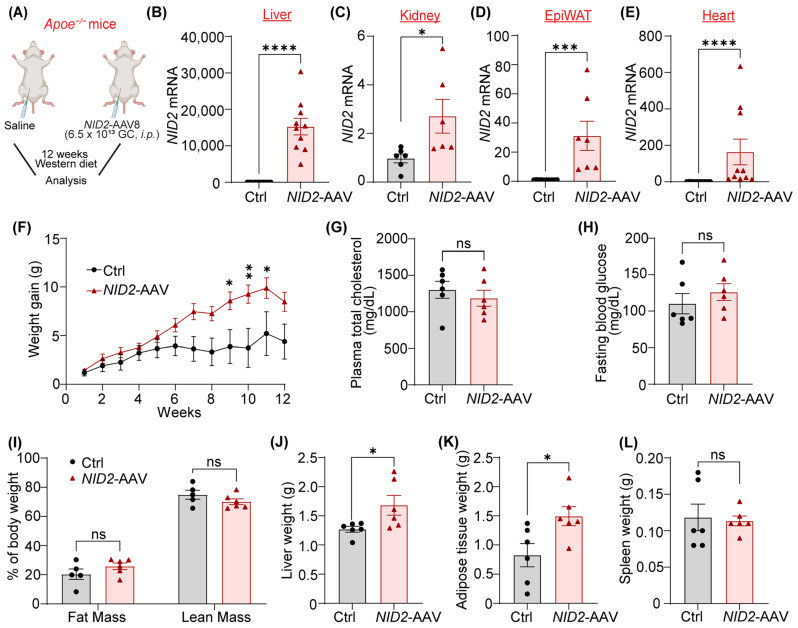
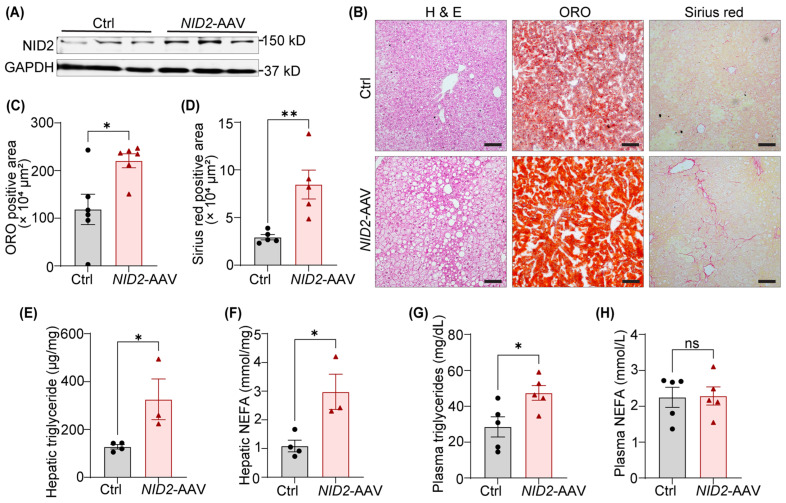
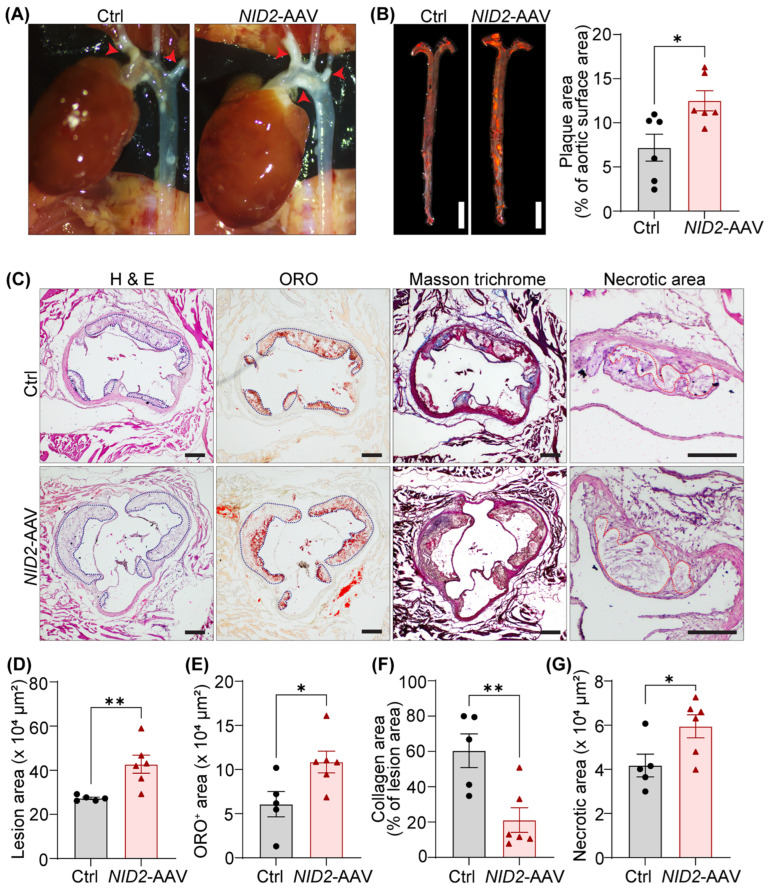
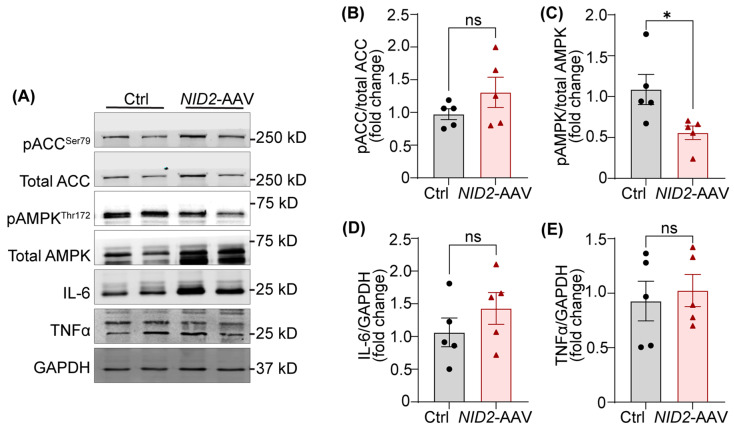
Clinical and genetic studies strongly support a significant connection between nonalcoholic fatty liver disease (NAFLD) and atherosclerotic cardiovascular disease (ASCVD) and identify ASCVD as the primary cause of death in NAFLD patients. Understanding the molecular factors and mechanisms regulating these diseases is critical for developing novel therapies that target them simultaneously. Our preliminary immunoblotting experiments demonstrated elevated expression of nidogen 2 (NID2), a basement membrane glycoprotein, in human atherosclerotic vascular tissues and murine steatotic livers. Therefore, we investigated the role of NID2 in regulating hepatosteatosis and atherosclerosis utilizing Western diet-fed Apoe-/- mice with/without NID2 overexpression. Quantitative real-time PCR confirmed increased NID2 mRNA expression in multiple organs (liver, heart, kidney, and adipose) of NID2-overexpressing mice. Male mice with NID2 overexpression exhibited higher liver and epididymal white adipose tissue mass, increased hepatic lipid accumulation, and fibrosis. Additionally, these mice developed larger atherosclerotic lesions in the whole aortas and aortic roots, with increased necrotic core formation. Mechanistic studies showed reduced AMPK activation in the livers of NID2-overexpressing mice compared with controls, without any effects on hepatic inflammation. In conclusion, these findings suggest that NID2 plays a deleterious role in both hepatosteatosis and atherosclerosis, making it a potential therapeutic target for these conditions.

Keywords: AMPK; NAFLD; atherosclerosis; hepatosteatosis; nidogen 2.


Conflict of interest statement

The authors have declared that no conflicts of interest exist.

Figures

Figure 1
Figure 1
Expression of NID2 protein is elevated in human atherosclerotic arteries and murine steatotic livers. (A) Representative western blot images for NID2 and β-tubulin protein expression in human atherosclerotic inner curvature (IC) and non-atherosclerotic descending aorta (DA) vascular tissue. The bar diagram shows mean protein levels expressed as a ratio of NID2 to β-tubulin. (B) Representative Western blot images for NID2 (red arrowhead points to the correct band) and GAPDH in the livers of control diet (CD)- and calorie-matched high-fat diet (HFD, 12 weeks)-fed C57BL/6J mice. The bar diagram represents the mean NID2 protein expression (n = 4). Statistical analyses were performed using a two-tailed unpaired t-test (A,B). Data represent mean ± SEM. * p < 0.05, and **** p < 0.0001.
Figure 2
Figure 2
NID2 overexpression enhances liver and epididymal white adipose tissue mass in male mice. (A) The schematic diagram illustrates the experimental plan. Apoe−/− mice were injected with control (Ctrl) and NID2-AAV intraperitoneally, fed a Western diet for 12 weeks, and analyzed. (BE) Male control and NID2-AAV-injected Apoe−/− mice were utilized to measure NID2 mRNA levels in various organs by qRT-PCR at least in duplicate. Bar diagrams represent mRNA expression in the liver (B, n = 10), kidney (C, n = 6), epididymal white adipose tissue (EpiWAT, D, n = 7–10), and heart (E, n = 10). Bar diagrams show body weight gain (F), plasma total cholesterol (G), fasting blood glucose (H), whole-body fat/lean mass (I), liver weight (J), adipose tissue weight (K), and spleen weight (L) (n = 5–6). A two-tailed unpaired t-test (C,GK), two-tailed unpaired Mann–Whitney test (B,D,E,L), and two-way ANOVA followed by Sidak post hoc test for multiple comparisons (F) were utilized for statistical analyses. Data represent mean ± SEM. ns: non-significant. * p < 0.05, *** p < 0.001 and **** p < 0.0001.
Figure 3
Figure 3
NID2 overexpression in mice promotes hepatic lipid accumulation and fibrosis. Male Apoe−/− mice were injected with control and NID2-AAV intraperitoneally, fed a Western diet for 12 weeks, and analyzed. (A) Representative Western blot images for NID2 and GAPDH protein expression in the livers of control and NID2-overexpressing mice (n = 3). (B) Representative images of liver sections stained with H & E (lipid droplets), ORO (neutral lipid accumulation), and Sirius red (fibrosis); scale bar 100 μm. (CH) Bar diagrams represent lipid accumulation (C, n = 6), fibrosis area (D, n = 5), hepatic triglyceride (E, n = 3–4), NEFA levels (F, n = 3–4), plasma triglyceride (G, n = 5) and NEFA levels (H, n = 5), in control and NID2-AAV-injected mice. Statistical analyses were performed using a two-tailed unpaired t-test (CH). Data represent mean ± SEM. ns: non-significant. * p < 0.05, and ** p < 0.01.
Figure 4
Figure 4
NID2 overexpression augments atherosclerosis in male hypercholesterolemic mice. Male Apoe−/− mice were injected with control (Ctrl) and NID2-AAV intraperitoneally, fed a Western diet for 12 weeks and analyzed. (A) Representative in situ images of the aortic arch (red arrowheads point to atherosclerotic lesions). (B) Representative ORO staining of whole aortas; scale bar 5 mm. The bar diagram represents ORO-positive areas in whole aortas (n = 6). (C) Representative images of aortic root cross-sections stained with H & E (lesion area and necrotic core), ORO (lipid accumulation), and Masson’s trichrome (collagen content); scale bar 200 μm. (DG) Bar diagrams show lesion area (D), lipid deposition (E), collagen content (F), and necrotic core area (G) (n = 5–6). Statistical analyses were performed using a two-tailed unpaired t-test (B,DG). Data represent mean ± SEM. * p < 0.05, and ** p < 0.01.
Figure 5
Figure 5
NID2 overexpression inhibits the activation of the lipid metabolism-related protein AMPK. (A) Representative Western blot images for lipid metabolism and pro-inflammatory proteins utilizing liver lysates from control and NID2-AAV-injected mice. Bar diagrams represent mean protein expression (B,C) as the ratios of phospho-total proteins ACC (B) and AMPK (C), and protein levels of IL-6 (D) and TNFα (E) (n = 5). Statistical analyses were performed using a two-tailed unpaired t-test. Data represent mean ± SEM. ns: non-significant. * p < 0.05.

Similar articles

References

    1. Han S.K., Baik S.K., Kim M.Y. Non-alcoholic fatty liver disease: Definition and subtypes. Clin. Mol. Hepatol. 2023;29:S5–S16. doi: 10.3350/cmh.2022.0424. - DOI - PMC - PubMed
    1. Polyzos S.A., Mantzoros C.S. Making progress in nonalcoholic fatty liver disease (NAFLD) as we are transitioning from the era of NAFLD to dys-metabolism associated fatty liver disease (DAFLD) Metabolism. 2020;111S:154318. doi: 10.1016/j.metabol.2020.154318. - DOI - PMC - PubMed
    1. Riazi K., Azhari H., Charette J.H., Underwood F.E., King J.A., Afshar E.E., Swain M.G., Congly S.E., Kaplan G.G., Shaheen A.A. The prevalence and incidence of NAFLD worldwide: A systematic review and meta-analysis. Lancet Gastroenterol. Hepatol. 2022;7:851–861. doi: 10.1016/S2468-1253(22)00165-0. - DOI - PubMed
    1. Loomba R., Ratziu V., Harrison S.A., NASH Clinical Trial Design International Working Group Expert Panel Review to Compare FDA and EMA Guidance on Drug Development and Endpoints in Nonalcoholic Steatohepatitis. Gastroenterology. 2022;162:680–688. doi: 10.1053/j.gastro.2021.10.051. - DOI - PMC - PubMed
    1. Harrison S.A., Taub R., Neff G.W., Lucas K.J., Labriola D., Moussa S.E., Alkhouri N., Bashir M.R. Resmetirom for nonalcoholic fatty liver disease: A randomized, double-blind, placebo-controlled phase 3 trial. Nat. Med. 2023;29:2919–2928. doi: 10.1038/s41591-023-02603-1. - DOI - PMC - PubMed

MeSH terms

LinkOut - more resources