. 2024 Nov 28;25(23):12787.
doi: 10.3390/ijms252312787.

Combining antimiR-25 and cGAMP Nanocomplexes Enhances Immune Responses via M2 Macrophage Reprogramming

Affiliations

Combining antimiR-25 and cGAMP Nanocomplexes Enhances Immune Responses via M2 Macrophage Reprogramming

Marija Petrovic et al. Int J Mol Sci. .

Abstract

Glioblastoma (GBM) is an aggressive brain cancer with a highly immunosuppressive tumor microenvironment (TME), invariably infiltrated by tumor-associated macrophages (TAMs). These TAMs resemble M2 macrophages, which promote tumor growth and suppress immune responses. GBM cells secrete extracellular vesicles (EVs) containing microRNA-25, which inhibits the cGAS-STING pathway and prevents TAMs from adopting a pro-inflammatory M1 phenotype. This study characterizes antimiR-25/cGAMP nanocomplexes (NCs) for potential therapeutic applications. A particle size analysis revealed a significant reduction upon complexation with antimiR-25, resulting in smaller, more stable nanoparticles. Stability tests across pH levels (4-6) and temperatures (25-37 °C) demonstrated their resilience in various biological environments. Biological assays showed that antimiR-25 NCs interacted strongly with transferrin (Tf), suggesting potential for blood-brain barrier passage. The use of cGAMP NCs activated the cGAS-STING pathway in macrophages, leading to increased type I IFN (IFN-β) production and promoting a shift from the M2 to M1 phenotype. The combined use of cGAMP and antimiR-25 NCs also increased the expression of markers involved in M1 polarization. These findings offer insights into optimizing antimiR-25/cGAMP NCs for enhancing immune responses in GBM.

Keywords: EVs; PAMAM; STING pathway; antagomir-25; antimiR-25; cGAMP; cancer immunotherapy; extracellular vesicles; nanomedicine; polymeric nanoparticles.


Conflict of interest statement

The authors declare no conflicts of interest.

Figures

Figure 6
Figure 6
IFN-β secretion levels in BMDMs upon exposure to increasing cGAMP and antimiR-25 NCs. Unpolarized M0 (a) or polarized towards M2 (b) BMDMs treated with antimiR-25 (0, 0.072, 0.143, 0.215, or 0.286 µg/mL) and cGAMP (0, 25, 50, 75, or 100 µg/mL) NCs. x-denotes the combination of formulation parameters being investigated. Data are presented as the mean ± SD of three independent experiments and comparisons were made using an unpaired t test. * p < 0.05, ** p < 0.005, *** p < 0.001, and **** p < 0.0001.
Figure 7
Figure 7
The antimiR-25 and cGAMP NC treatments reprogram gene expression in BMDMs under hypoxic conditions. The expression of M2-associated markers (Arg1 and Mrc1) (in red) and M1-associated markers (Cxcl10, Il1b, Nos2, and Ifna) (in blue) measured by RT-qPCR. The left panel represents the relative gene expression in unpolarized M0 BMDMs (a) and the right panel represents M2-polarized BMDMs (b). Macrophages were treated with antimiR-25-coupled NCs (0.143 µg/mL) and/or cGAMP-coupled NCs (100 µg/mL) or empty NCs (ctrl) for 24 h in the presence of hypoxic GBM-derived EVs at a 1% O2 level. Data are presented as the mean ± SD of three independent experiments and comparisons were made using an unpaired t test. * p < 0.05 and ** p < 0.005.
Figure 8
Figure 8
The antimiR-25 and cGAMP NC treatments modulate Nos2 gene expression in BMDMs under normoxic conditions. The expression of M2-associated markers (Arg1 and Mrc1) (in red) and M1-associated markers (Cxcl10, Il1b, Nos2, and Ifna) (in blue) measured by RT-qPCR. The left panel represents the relative gene expression in unpolarized M0 BMDMs (a) and the right panel represents M2-polarized BMDMs (b). Macrophages were treated with antimiR-25-coupled NCs (0.143 µg/mL) and/or cGAMP-coupled NCs (100 µg/mL) or empty NCs (ctrl) in the presence of hypoxic GBM-derived EVs at a 21% O2 level. Data are presented as the mean ± SD of three independent experiments and comparisons were made using an unpaired t test. * p < 0.05 and ** p < 0.005 and **** p < 0.0001.
Figure 9
Figure 9
cGAMP NCs induce IFN-β secretion in M0 and M2 macrophages under 1% and 21% O2. The quantification of IFN-β secretion by BMDMs polarized to M0 (A) and M2 (B) upon incubation at different oxygen levels (1% O2 or 21% O2). The BMDMs were treated with empty NCs (PG3) or NCs loaded with antimiR-25 and/or cGAMP, x-denotes the combination of formulation parameters being investigated. Data are presented as the mean ± SD of three independent experiments and comparisons were made using 2-way ANOVA. **** p < 0.0001.
Figure 1
Figure 1
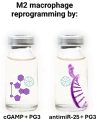
NCs made of cGAMP/PG3 and antimiR-25/PG3 NCS. Created in BioRender.
Figure 2
Figure 2
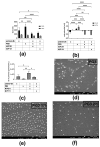
Nanocharacterization. (a) Zeta potential measured by ELS and NTA; (b) size measured by DLS and NTA, (c) number of particles measured by NTA; (df) scanning electron microscopy (SEM) images of antimiR-25 NCs. x-denotes the combination of formulation parameters being investigated Data are presented as mean ± SD of three independent experiments and comparisons were made using 2-way ANOVA. * p < 0.05, ** p < 0.005, *** p < 0.001, and **** p < 0.0001.
Figure 3
Figure 3
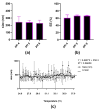
Critical formulation parameters. NCs were prepared in MilliQ water at pH 6. Additional pH values of 4 and 5 were adjusted before measurements. (a) Size measured at pH 4, 5, and 6 by DLS; (b) EE% measured at pH 4, 5, and 6 using a (Quant-iT RiboGreen assay kit (ThermoFisher, Waltham, MA, USA); (c) DLS size measurement of antimiR-25 NCs exposed to a temperature in the range of 25–37 °C.
Figure 4
Figure 4
Storage stability (a) zeta potential and (b) size of antimiR-25 NCs measured by NTA and DLS at day 0 and 7 and 1 month or lyophilized. Data are presented as the mean ± SD of three independent experiments and comparisons were made using a 2-way ANOVA. * p < 0.05, ** p < 0.005, and **** p < 0.0001, ns means statistically non-significant.
Figure 5
Figure 5
The antimiR-25 NCs’ interactions with transferrin. The Videodrop image capture and graphical representation of antimiR-25 NCs (a) and antimiR-25 NCs mixed with 0.28 mg/mL human holo-transferrin (HTF) (b); (c) binding affinity calculation between antimiR-25 NCs.

References

    1. Tankov S., Walker P.R. Glioma-Derived Extracellular Vesicles—Far More Than Local Mediators. Front. Immunol. 2021;12:679954. doi: 10.3389/fimmu.2021.679954. - DOI - PMC - PubMed
    1. Liao D., Johnson R.S. Hypoxia: A key regulator of angiogenesis in cancer. Cancer Metastasis Rev. 2007;26:281–290. doi: 10.1007/s10555-007-9066-y. - DOI - PubMed
    1. Tomaszewski W., Sanchez-Perez L., Gajewski T.F., Sampson J.H. Brain Tumor Microenvironment and Host State: Implications for Immunotherapy. Clin. Cancer Res. 2019;25:4202–4210. doi: 10.1158/1078-0432.CCR-18-1627. - DOI - PMC - PubMed
    1. Binnewies M., Roberts E.W., Kersten K., Chan V., Fearon D.F., Merad M., Coussens L.M., Gabrilovich D.I., Ostrand-Rosenberg S., Hedrick C.C., et al. Understanding the tumor immune microenvironment (TIME) for effective therapy. Nat. Med. 2018;24:541–550. doi: 10.1038/s41591-018-0014-x. - DOI - PMC - PubMed
    1. Sica A., Mantovani A. Macrophage plasticity and polarization: In vivo veritas. J. Clin. Investig. 2012;122:787–795. doi: 10.1172/JCI59643. - DOI - PMC - PubMed

MeSH terms

LinkOut - more resources