. 2024 Dec 4;25(23):13040.
doi: 10.3390/ijms252313040.

A Reduction in Mitophagy Is Associated with Glaucomatous Neurodegeneration in Rodent Models of Glaucoma

Affiliations

A Reduction in Mitophagy Is Associated with Glaucomatous Neurodegeneration in Rodent Models of Glaucoma

Renuka M Chaphalkar et al. Int J Mol Sci. .

Abstract

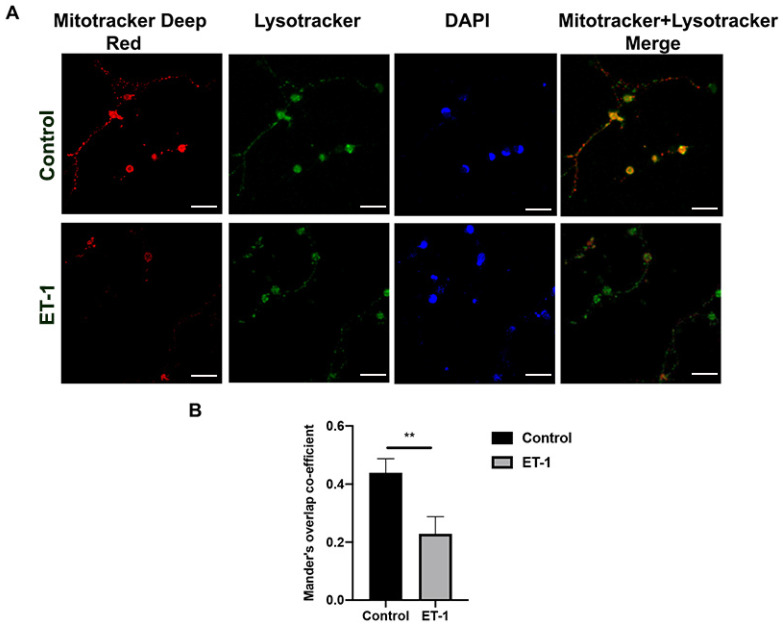
Glaucoma is a heterogenous group of optic neuropathies characterized by the degeneration of optic nerve axons and the progressive loss of retinal ganglion cells (RGCs), which could ultimately lead to vision loss. Elevated intraocular pressure (IOP) is a major risk factor in the development of glaucoma, and reducing IOP remains the main therapeutic strategy. Endothelin-1 (ET-1), a potent vasoactive peptide, has been shown to produce neurodegenerative effects in animal models of glaucoma. However, the detailed mechanisms underlying ET-1-mediated neurodegeneration in glaucoma are not completely understood. In the current study, using a Seahorse Mitostress assay, we report that ET-1 treatment for 4 h and 24 h time points causes a significant decline in various parameters of mitochondrial function, including ATP production, maximal respiration, and spare respiratory capacity in cultured RGCs. This compromise in mitochondrial function could trigger activation of mitophagy as a quality control mechanism to restore RGC health. Contrary to our expectation, we observed a decrease in mitophagy following ET-1 treatment for 24 h in cultured RGCs. Using Morrison's model of ocular hypertension in rats, we investigated here, for the first time, changes in mitophagosome formation by analyzing the co-localization of LC-3B and TOM20 in RGCs. We also injected ET-1 (24 h) into transgenic GFP-LC3 mice to analyze the formation of mitophagosomes in vivo. In Morrison's model of ocular hypertension, as well as in ET-1 injected GFP-LC3 mice, we found a decrease in co-localization of LC3 and TOM20, indicating reduced mitophagy. Taken together, these results demonstrate that both ocular hypertension and ET-1 administration in rats and mice lead to reduced mitophagy, thus predisposing RGCs to neurodegeneration.

Keywords: glaucoma; mitophagy; neurodegeneration.


Conflict of interest statement

The authors declare no conflicts of interest.

Figures

Figure 1
Figure 1
ET-1 decreases oxygen consumption rate (OCR) at 4 h and 24 h in primary RGCs. (A). Representative OCR profiles showing OCR recordings at baseline and after treatment with oligomycin, FCCP, and rotenone/Antimycin A following ET-1 treatment for 4 h. (B). Representative OCR profiles showing OCR recordings at baseline and after treatment with oligomycin, FCCP, and rotenone/Antimycin A following ET-1 treatment for 24 h. (C). Bar graphs showing quantitation of oxygen consumption rate during basal respiration, maximal respiration, ATP-linked respiration, spare respiratory capacity, and proton leak following ET-1 treatment for 4 h. (D). Bar graphs showing quantitation of oxygen consumption rate during basal respiration, maximal respiration, ATP-linked respiration, spare respiratory capacity, and proton leak following ET-1 treatment for 24 h. Data represented as the mean ± SEM, (Student’s t-test, n = 3 biological replicates per group), significance at * p < 0.05, ** p < 0.01, **** p < 0.0001.
Figure 2
Figure 2
Endothelin treatment elevates reactive oxygen species in cultured primary RGCs. (A). Primary RGCs were either untreated (control), or treated with H2O2 (positive control), ET-1, or ET-3 for 1 h. Cells were stained with CellRox (Green) to detect reactive oxygen species and nuclear dye DAPI (Blue). (B). Mitochondrial membrane potential determined by JC-1 assay in RGCs treated with vehicle or ET-1 for 4 h. FCCP (100 μM), an uncoupler of oxidative phosphorylation, was used as positive control. Experiments were performed in triplicate. Data are represented as mean  ± SEM (**** p < 0.0001) (one-way ANOVA followed by Tukey’s multiple comparisons test).
Figure 3
Figure 3
ET-1 treatment mediated decrease in co-localization of Lysotracker (Green) and Mitotracker (Red) in cultured primary RGCs were stained with Mitotracker Deep Red, Lysotracker Red and nuclear dye DAPI (Blue) following ET-1 treatment for 24 h. (A). A decrease in co-staining (yellow) of mitotracker and lysotracker was found following ET-1 treatment indicative of decreased mitophagy. (B). Quantitation of co-localization puncta was determined by Mander’s overlap co-efficient. Scale bar = 20 µm. Data represented as the mean ± SEM, (Student’s t-test, n = 3 biological replicates per group), significance at ** p < 0.01.
Figure 4
Figure 4
Intravitreal ET-1 administration in GFP-LC3 transgenic mice decreased autophagosome formation in retinal ganglion cells. (A). OCT sections showing a significant decrease in co-localization of GFP-LC3 (green) with TOM20 (yellow) 24 h following intravitreal ET-1 injection (white arrow heads indicate the co-localization of GFP-LC3 and TOM20 in GCL layer). Brn3a immunostaining (red) was used to detect RGCs and additional staining was done with nuclear dye DAPI (Blue). (B). Quantitation of co-localization of GFP-LC3 with TOM20 determined by Mander’s overlap co-efficient (n = 3, * p < 0.05). Scale bar =20 µm. Data represented as mean ± SEM. NFL: nerve fiber layer, GCL: ganglion cell layer, IPL: inner plexiform layer, INL: inner nuclear layer.
Figure 5
Figure 5
Elevated IOP in Brown Norway rats decreased the formation of mitophagosomes in retinal ganglion cells. (A). IOP was elevated in one eye of rats by the Morrison model and maintained for 2 weeks. Representative graph of IOP measurements for IOP elevated (red squares) and contralateral control (black circles) eyes in adult retired breeder Brown Norway rats. (B). Retina sections obtained from rat eyes were stained using anti-LC3B (marker of autophagosomes) and anti- TOM20 (outer mitochondrial membrane protein). Brn3a immunostaining (cyan) was used to detect RGCs and additional staining was done with nuclear dye DAPI (blue). Retinas from IOP elevated rat eyes showed a significant decrease in co-localization puncta in RGCs. (C). Quantitation of co-localization of LC3B (red) with TOM20 (green) was determined by assessment of Mander’s overlap co-efficient (n = 6, * p < 0.001). Scale bar = 20 µm. Data represented as mean  ± SEM. NFL: nerve fiber layer, GCL: ganglion cell layer, IPL: inner plexiform layer, INL: inner nuclear layer.

Similar articles

Cited by

References

    1. Boland M.V., Quigley H.A. Risk factors and open-angle glaucoma: Classification and application. J. Glaucoma. 2007;16:406–418. doi: 10.1097/IJG.0b013e31806540a1. - DOI - PubMed
    1. Weinreb R.N., Leung C.K., Crowston J.G., Medeiros F.A., Friedman D.S., Wiggs J.L., Martin K.R. Primary open-angle glaucoma. Nat. Rev. Dis. Primers. 2016;2:16067. doi: 10.1038/nrdp.2016.67. - DOI - PubMed
    1. Leske M.C., Heijl A., Hussein M., Bengtsson B., Hyman L., Komaroff E., Early Manifest Glaucoma Trial G. Factors for glaucoma progression and the effect of treatment: The early manifest glaucoma trial. Arch. Ophthalmol. 2003;121:48–56. doi: 10.1001/archopht.121.1.48. - DOI - PubMed
    1. Pascale A., Drago F., Govoni S. Protecting the retinal neurons from glaucoma: Lowering ocular pressure is not enough. Pharmacol. Res. 2012;66:19–32. doi: 10.1016/j.phrs.2012.03.002. - DOI - PubMed
    1. Chidlow G., Wood J.P.M., Casson R.J. Investigations into Hypoxia and Oxidative Stress at the Optic Nerve Head in a Rat Model of Glaucoma. Front. Neurosci. 2017;11:478. doi: 10.3389/fnins.2017.00478. - DOI - PMC - PubMed

LinkOut - more resources